ATOM-USD— AI Stock Forecast & Price Targets
Published 6/30/2026 · A free sample of K3vl4r’s AI-powered analysis.
Kronos price forecasts, scored fundamentals & technicals, and a multi-horizon plan.
View the live ATOM-USD price forecast →
The technical picture shows ATOM-USD in a deeply oversold, contrarian zone with recent price action significantly below prior forecast bands. While social sentiment is bullish, the model's own directional accuracy metrics are poor across all visible timeframes, suggesting caution despite potential underlying ecosystem strength. A measured approach is warranted, awaiting confirmation of a structural reversal above key support levels.
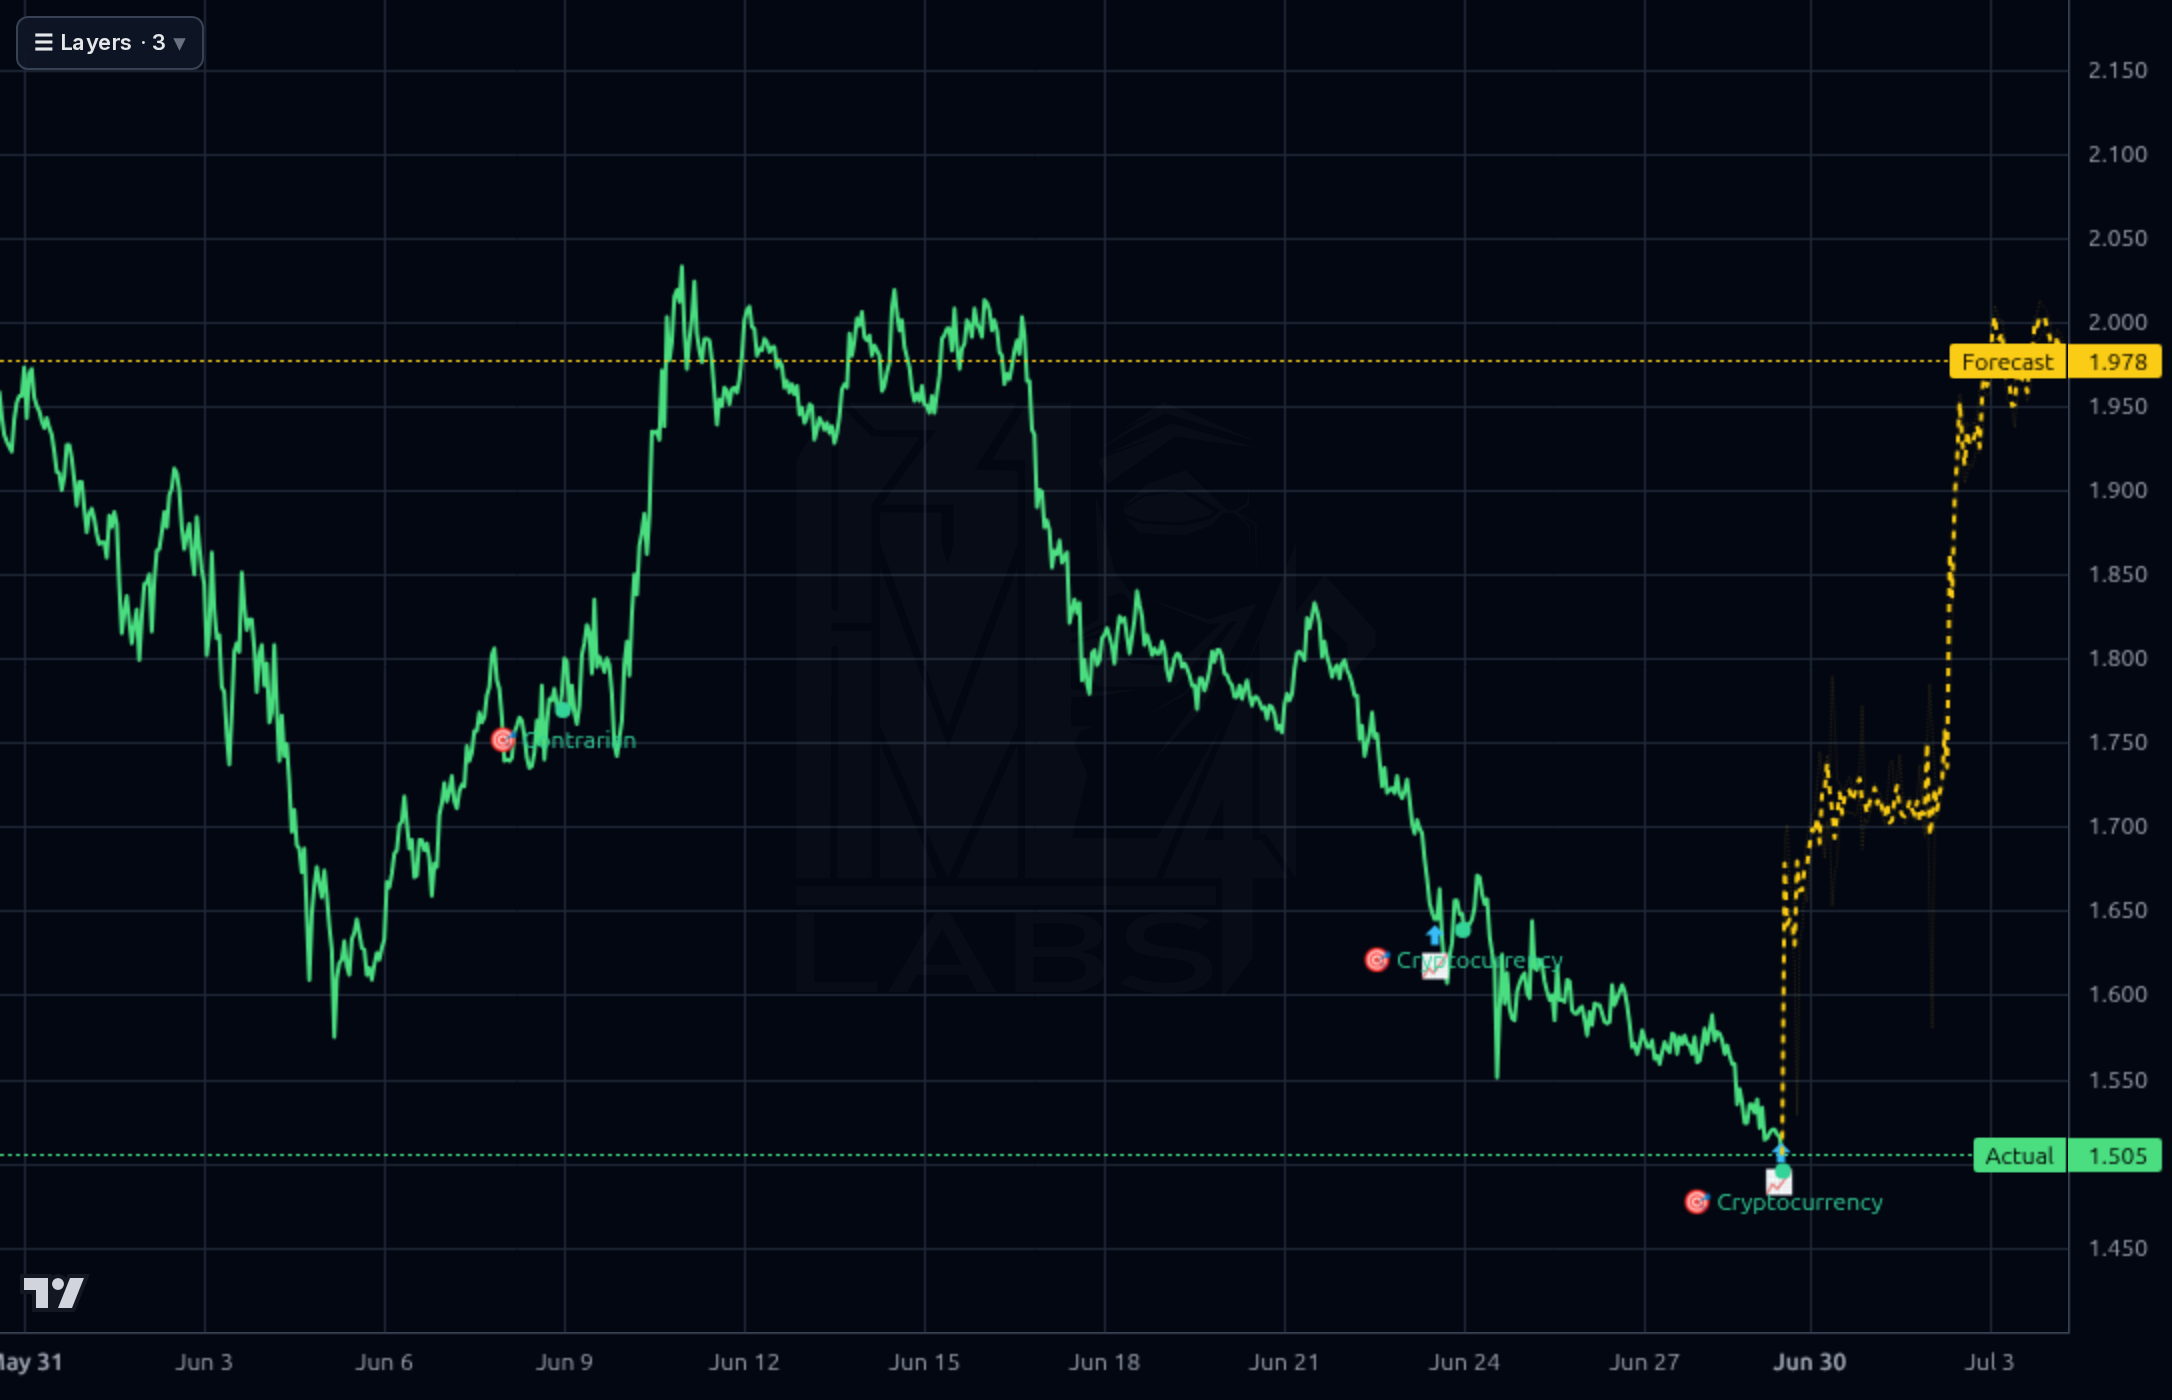
Wait for confirmation of a bounce off established support levels, ideally above $1.60 on the 1D chart. A break below $1.45 would signal further downside risk. Size any initial entry cautiously, treating it as a contrarian dip-buy.
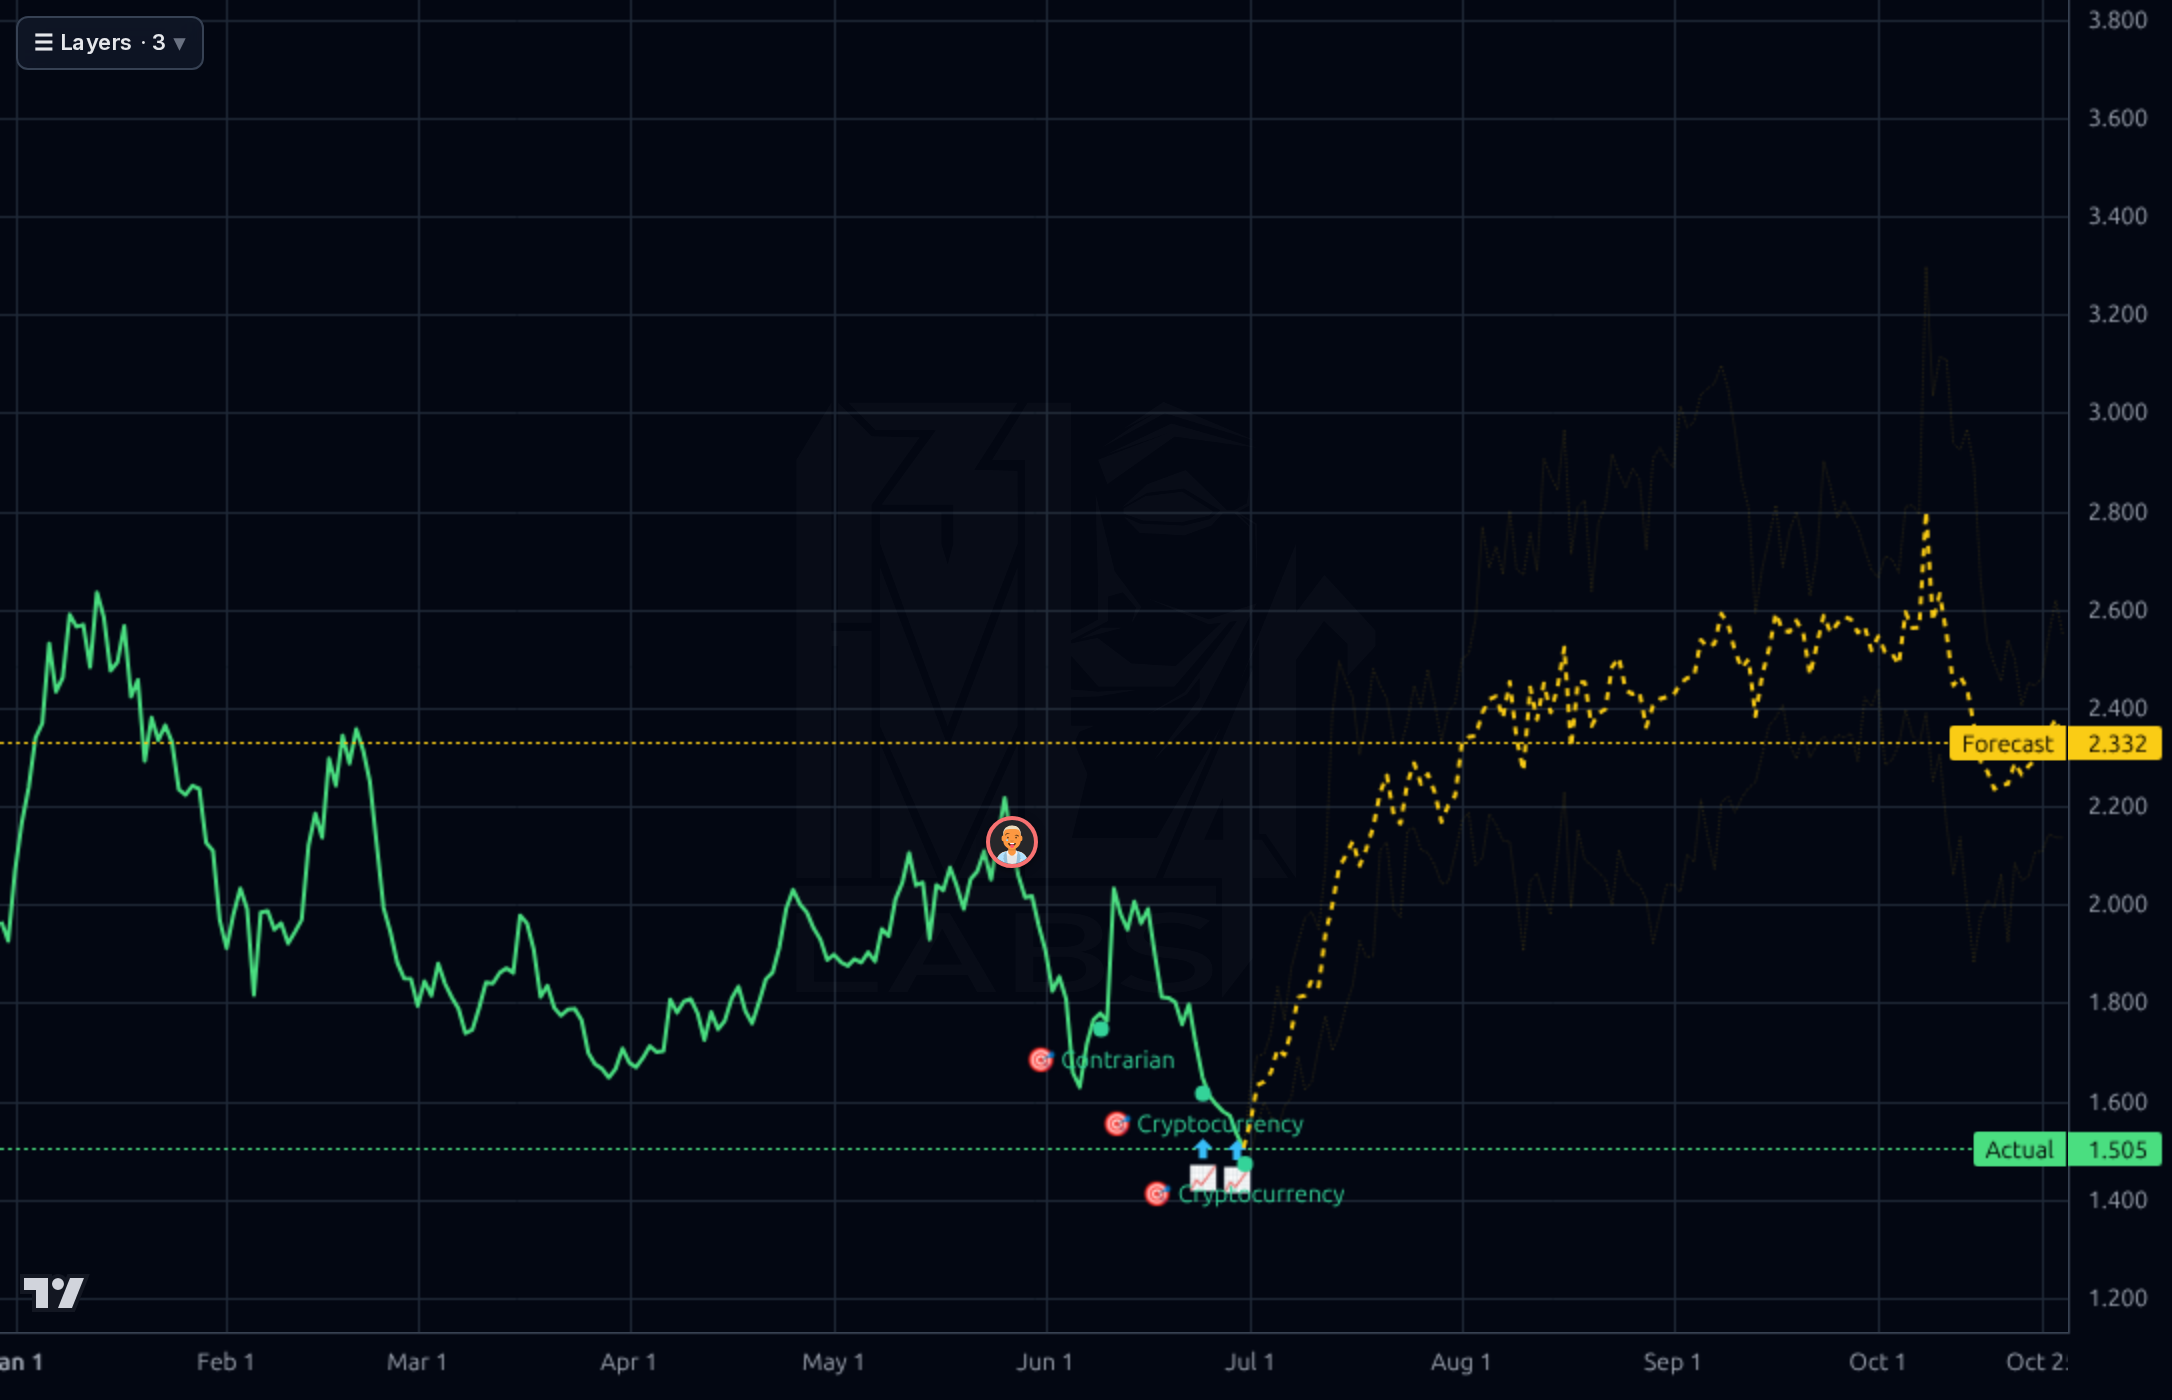
The thesis remains that ATOM has significant upside potential given its underlying technology and ecosystem narrative, but the current price action suggests profit-taking or macro headwinds are dominant. A realistic base target should be derived from structural support rather than extrapolating failed prior forecasts.
The long-term driver is the adoption and utility within the decentralized infrastructure space. The biggest risk remains market cycle dependency, meaning sustained bullishness requires broader crypto market recovery.
Fundamentals are not available for cryptocurrencies / futures, rendering traditional valuation metrics (P/E, PEG, etc.) inapplicable. The analysis must rely solely on price action, forecast models, and sentiment.
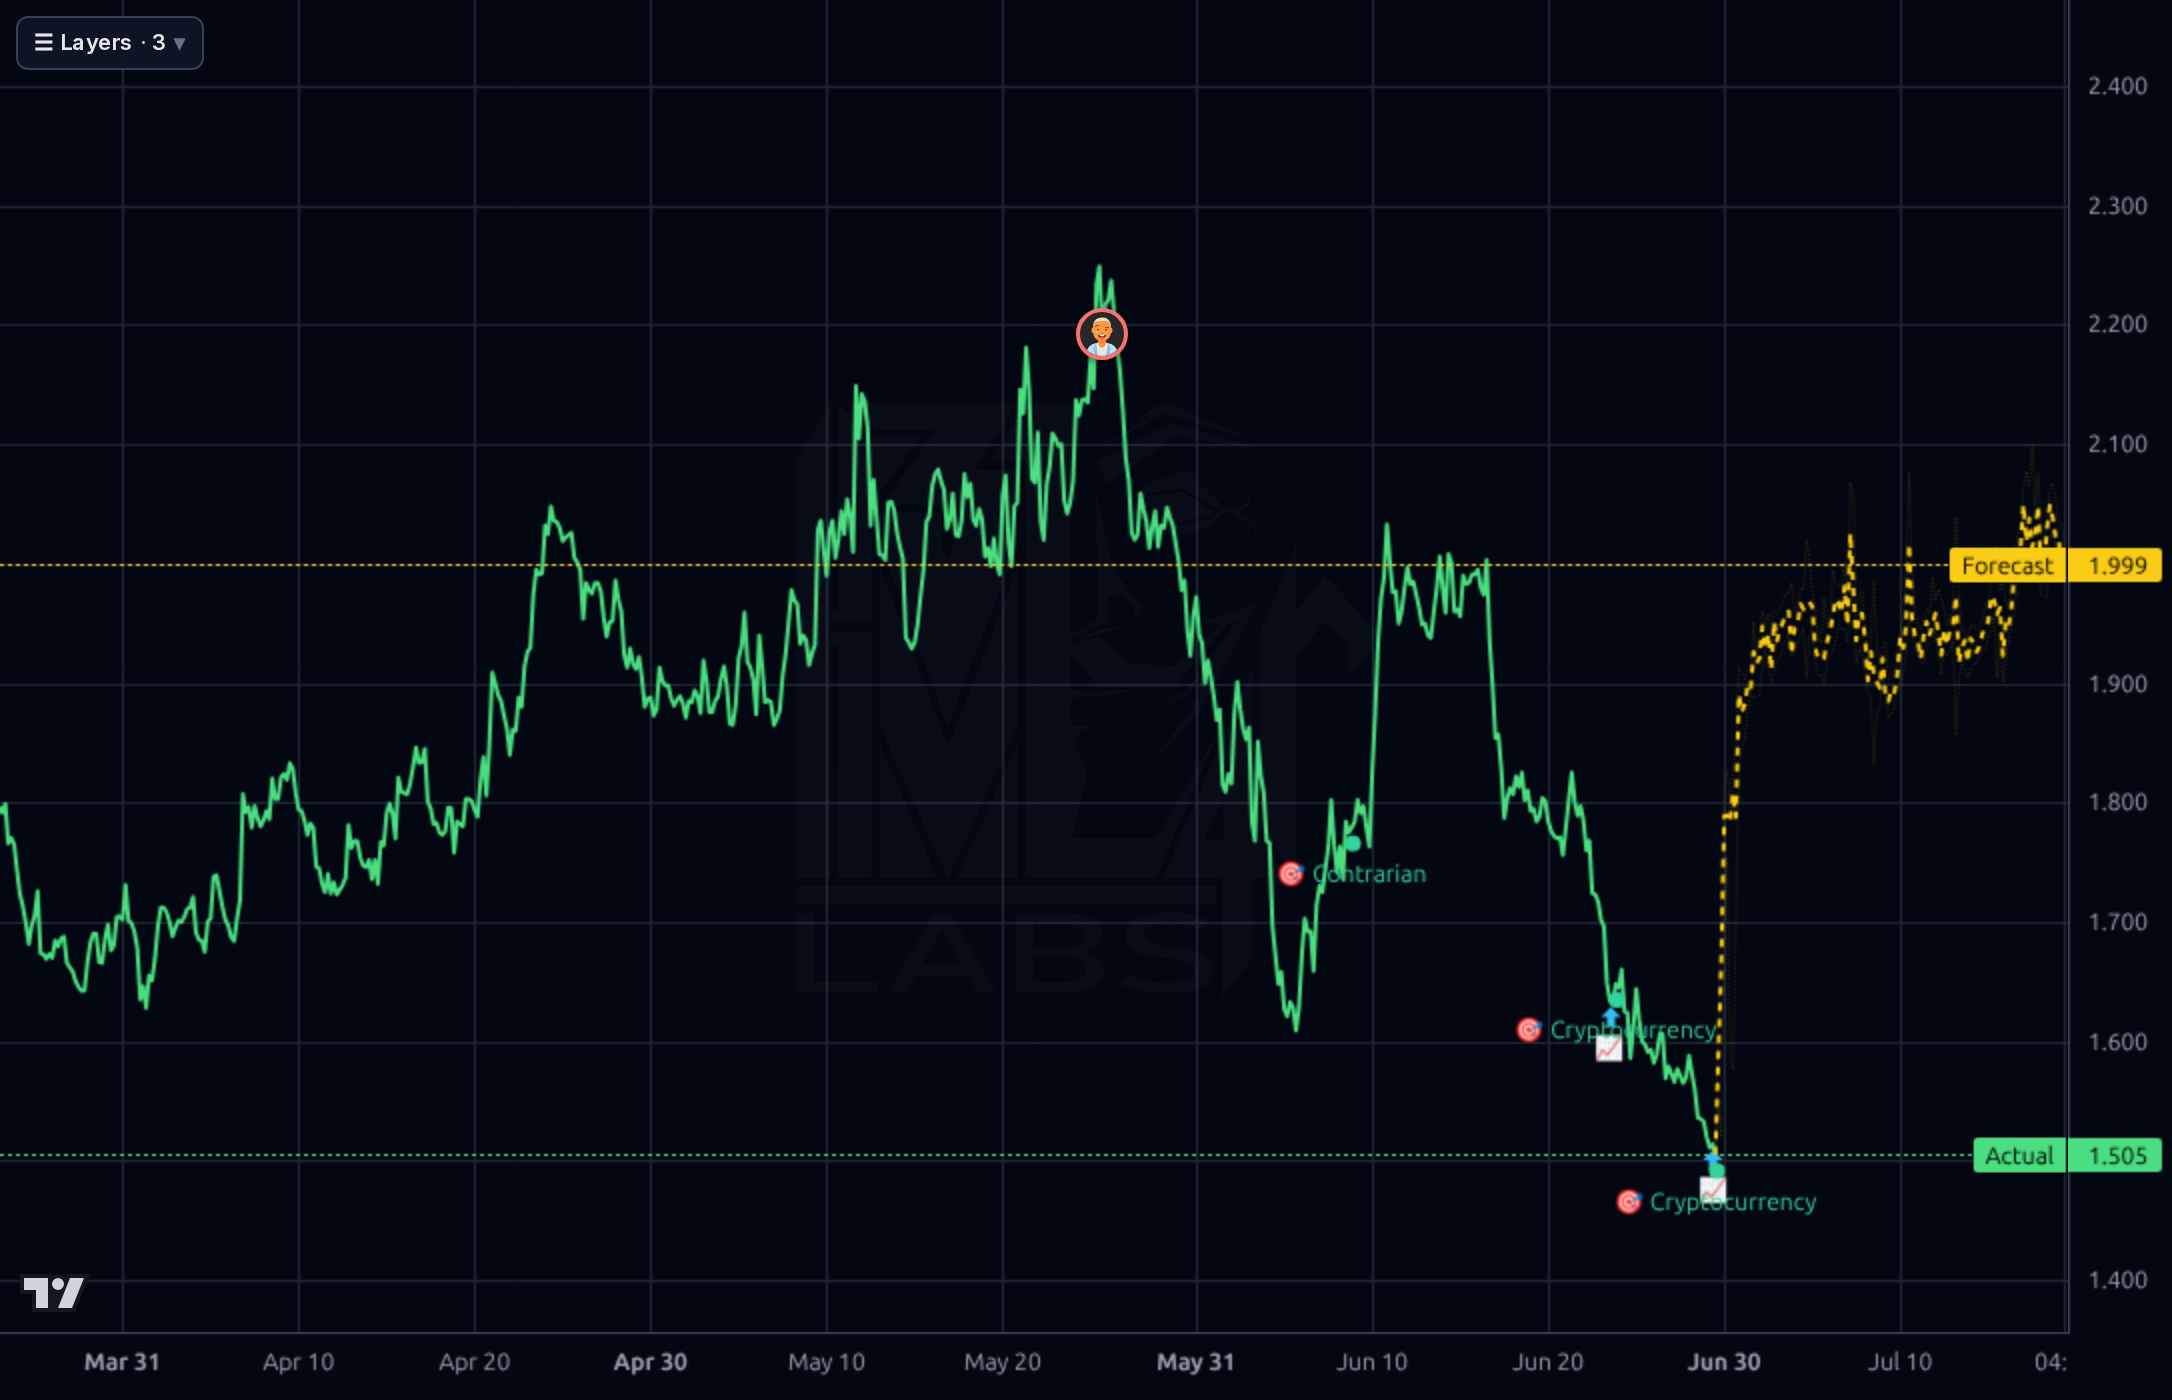
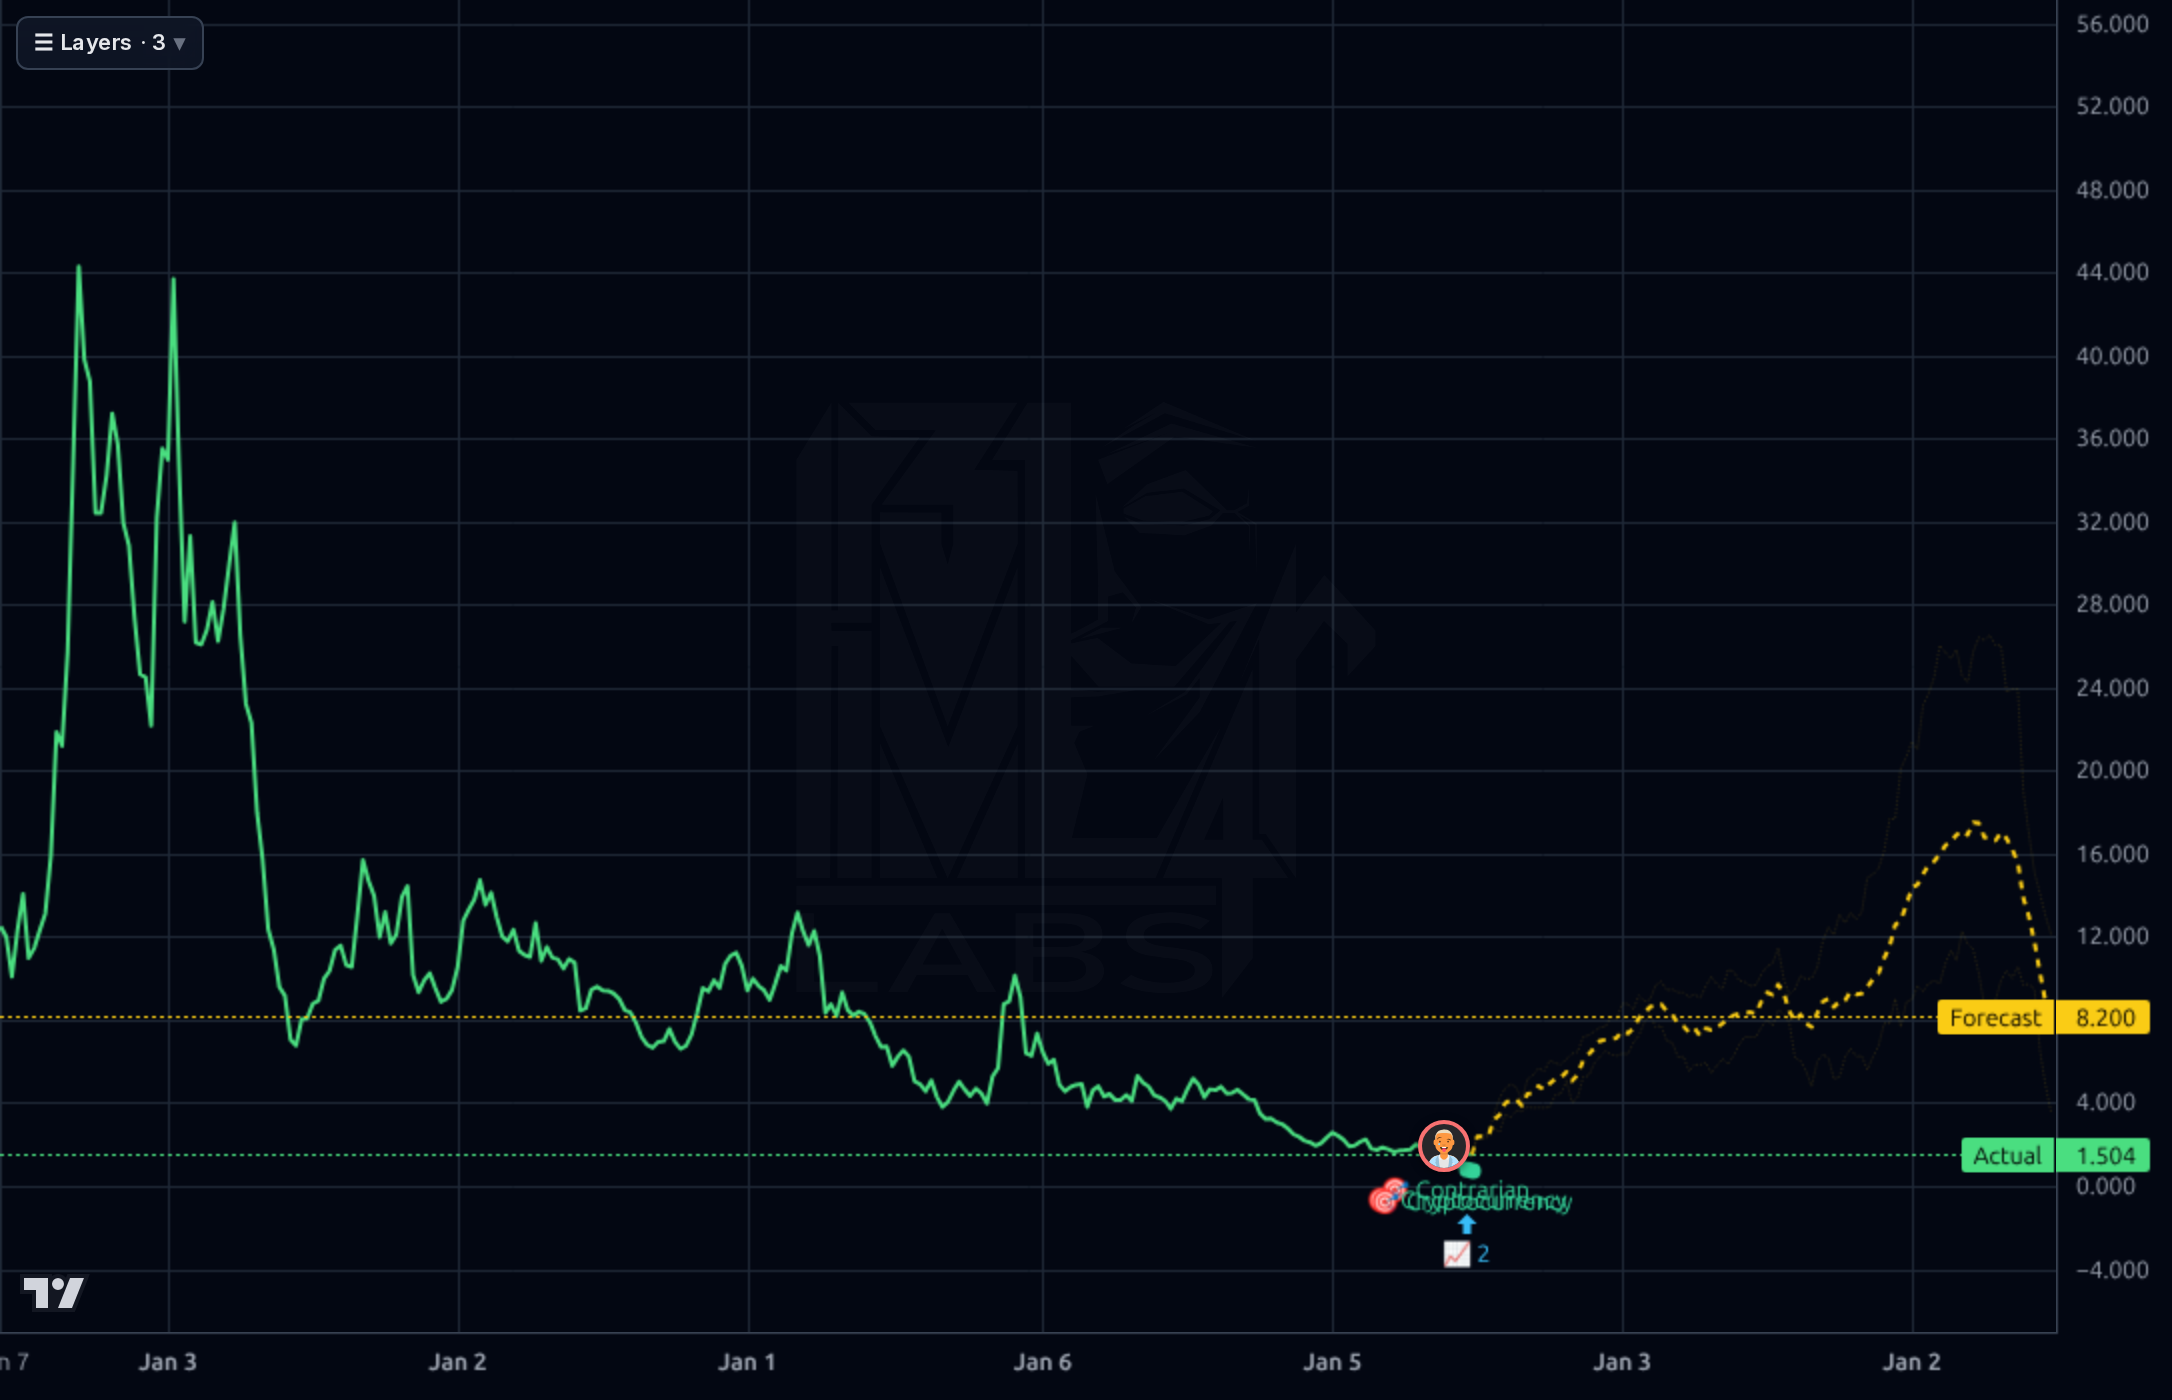
The 1D chart shows a clear downtrend with the current price near $1.52 significantly below the recent forecast bands. The 1W chart confirms this bearish structure, showing the actual price far removed from the yellow forecast band. Support appears to be forming in consolidation patterns around the $1.40 - $1.60 range based on visual inspection of both charts. Model reliability is questionable, as directional accuracy metrics (e.g., 34% for 1D) are substantially below naive baselines, suggesting caution regarding immediate forecast reliance.
There is no recent news provided in the database to influence the technical or fundamental outlook for ATOM-USD. The social sentiment data indicates a high level of retail bullishness (75% bullish), which should be treated purely as a contrarian indicator rather than predictive fact, given the lack of fundamental catalysts.
- Monitor ecosystem development activity as a proxy for underlying utility, given the absence of traditional financial metrics.
- High reliance on speculative sentiment (75% bullish crowd) without corresponding fundamental catalysts.
- Poor model accuracy metrics across all timeframes suggest high uncertainty in short-term price predictions.
- The current price is significantly discounted relative to prior analyst base targets, indicating potential overextension of the bearish move.
Get AI analysis on any stock
This is one of hundreds of Kronos AI reports — scored fundamentals & technicals, bull/base/bear price targets, a multi-horizon plan, and continuously-updated forecasts across the market. Create a free account to explore them all.
Create your free account →Already a member? Sign in · Join our Discord