EPAM — AI Stock Forecast & Price Targets
Published 7/9/2026 · A free sample of K3vl4r’s AI-powered analysis.
Kronos price forecasts, scored fundamentals & technicals, and a multi-horizon plan.
View the live EPAM price forecast →
EPAM trades at 6.1x forward EPS with $1.04B cash and D/E 0.08 after a -58% YTD drawdown, offering deep-value optionality but with genuine structural questions about AI-driven client insourcing eroding the IT services TAM. The August 6th earnings print is a binary catalyst — Q1's gross margin compression to 27.7% and negative $36M OCF must reverse to validate the cyclical-trough thesis, otherwise the stock re-rates lower toward the $73 52-week low.
Hold existing longs; do not add materially into the August 6th earnings print (~28 days away) — this is a binary event with high IV that will crush post-report and will gap in either direction. The stock has bounced +22% off the $73 low and is now bumping the $90 area; a clean break and hold above $92-95 would confirm short-term momentum but is unlikely to sustain into a binary catalyst. Prudent stance: trim any speculative adds above $92, keep core position, and reserve dry powder for a post-earnings gap. Invalidation for a short-term long bias is a decisive break below $80 pre-earnings, which would signal renewed distribution. Do not size a swing trade off the model forecast — its 1d directional accuracy has not beaten naive and MAPE is 67%.
The 1-6 month view is genuinely two-state. If August 6th earnings show gross margin stabilization at or above 28%, positive Q2 OCF recovery, and constructive book-to-bill commentary from North American clients, the stock re-rates toward $115-125 (roughly 8x forward EPS) with 30-40% upside driven by short covering (20.4% short interest) and index/mandate re-inclusion flows. If earnings confirm further margin compression or cut guidance, the stock likely tests $73 and possibly the $60-65 zone as the structural-erosion narrative takes hold. Expected return range: -20% to +35% over 6 months, skewed slightly positive by valuation but with real tail risk. What changes the thesis: a gross margin print below 27% or negative Q2 OCF would flip me to HOLD/TRIM.
The 1-3 year terminal thesis rests on whether EPAM can rotate its revenue mix from commoditizing engineering staff-augmentation into higher-margin AI/cloud systems integration at the speed AI-driven productivity gains compress the legacy book. The Databricks and TGS partnerships are directionally right but not yet material to the P&L. Multi-year drivers: successful AI-partner monetization, potential accretive M&A funded by $1B cash, and aggressive buybacks at these multiples (each 10% buyback adds ~$1.40 to EPS). The biggest structural risk is that generative AI permanently compresses the IT services revenue pool by 20-30% as clients internalize engineering; in that scenario EPAM's fair value is $60-70 regardless of balance sheet strength, as we've seen repeatedly that balance sheet alone does not create a floor when the narrative faces structural disruption.
Top-line growth remains positive but decelerating in quality: TTM revenue is $5.56B (+14.2% Y/Y) with Q1 2026 revenue of $1.40B, essentially flat sequentially from Q4 2025's $1.41B — a stall after four quarters of expansion. The more concerning line is margins: gross margin compressed to 27.7% in Q1 2026 from 30.1% in Q4 2025, and operating margin fell to 8.3% from 10.6%, dragging net income to $82.5M from $109.4M. Cash flow quality is the biggest question mark — Q1 2026 operating cash flow flipped to -$36M from +$283M in Q4, and free cash flow was -$54M, though management has historically shown seasonal Q1 weakness. The balance sheet remains a fortress: $1.04B cash, $288M debt, D/E of 0.08, current ratio 2.67, and TTM FCF of $693M supporting a P/FCF of just 8.3x. ROE at 10.9% and ROIC at 10.5% are respectable but well below the pre-2023 franchise level. The valuation stack — 12.3x trailing P/E, 6.1x forward P/E, 0.81 P/S, 0.58 PEG, 5.45x EV/EBITDA — is deeply discounted versus IT-services peers, reflecting the market's pricing of structural, not cyclical, damage.
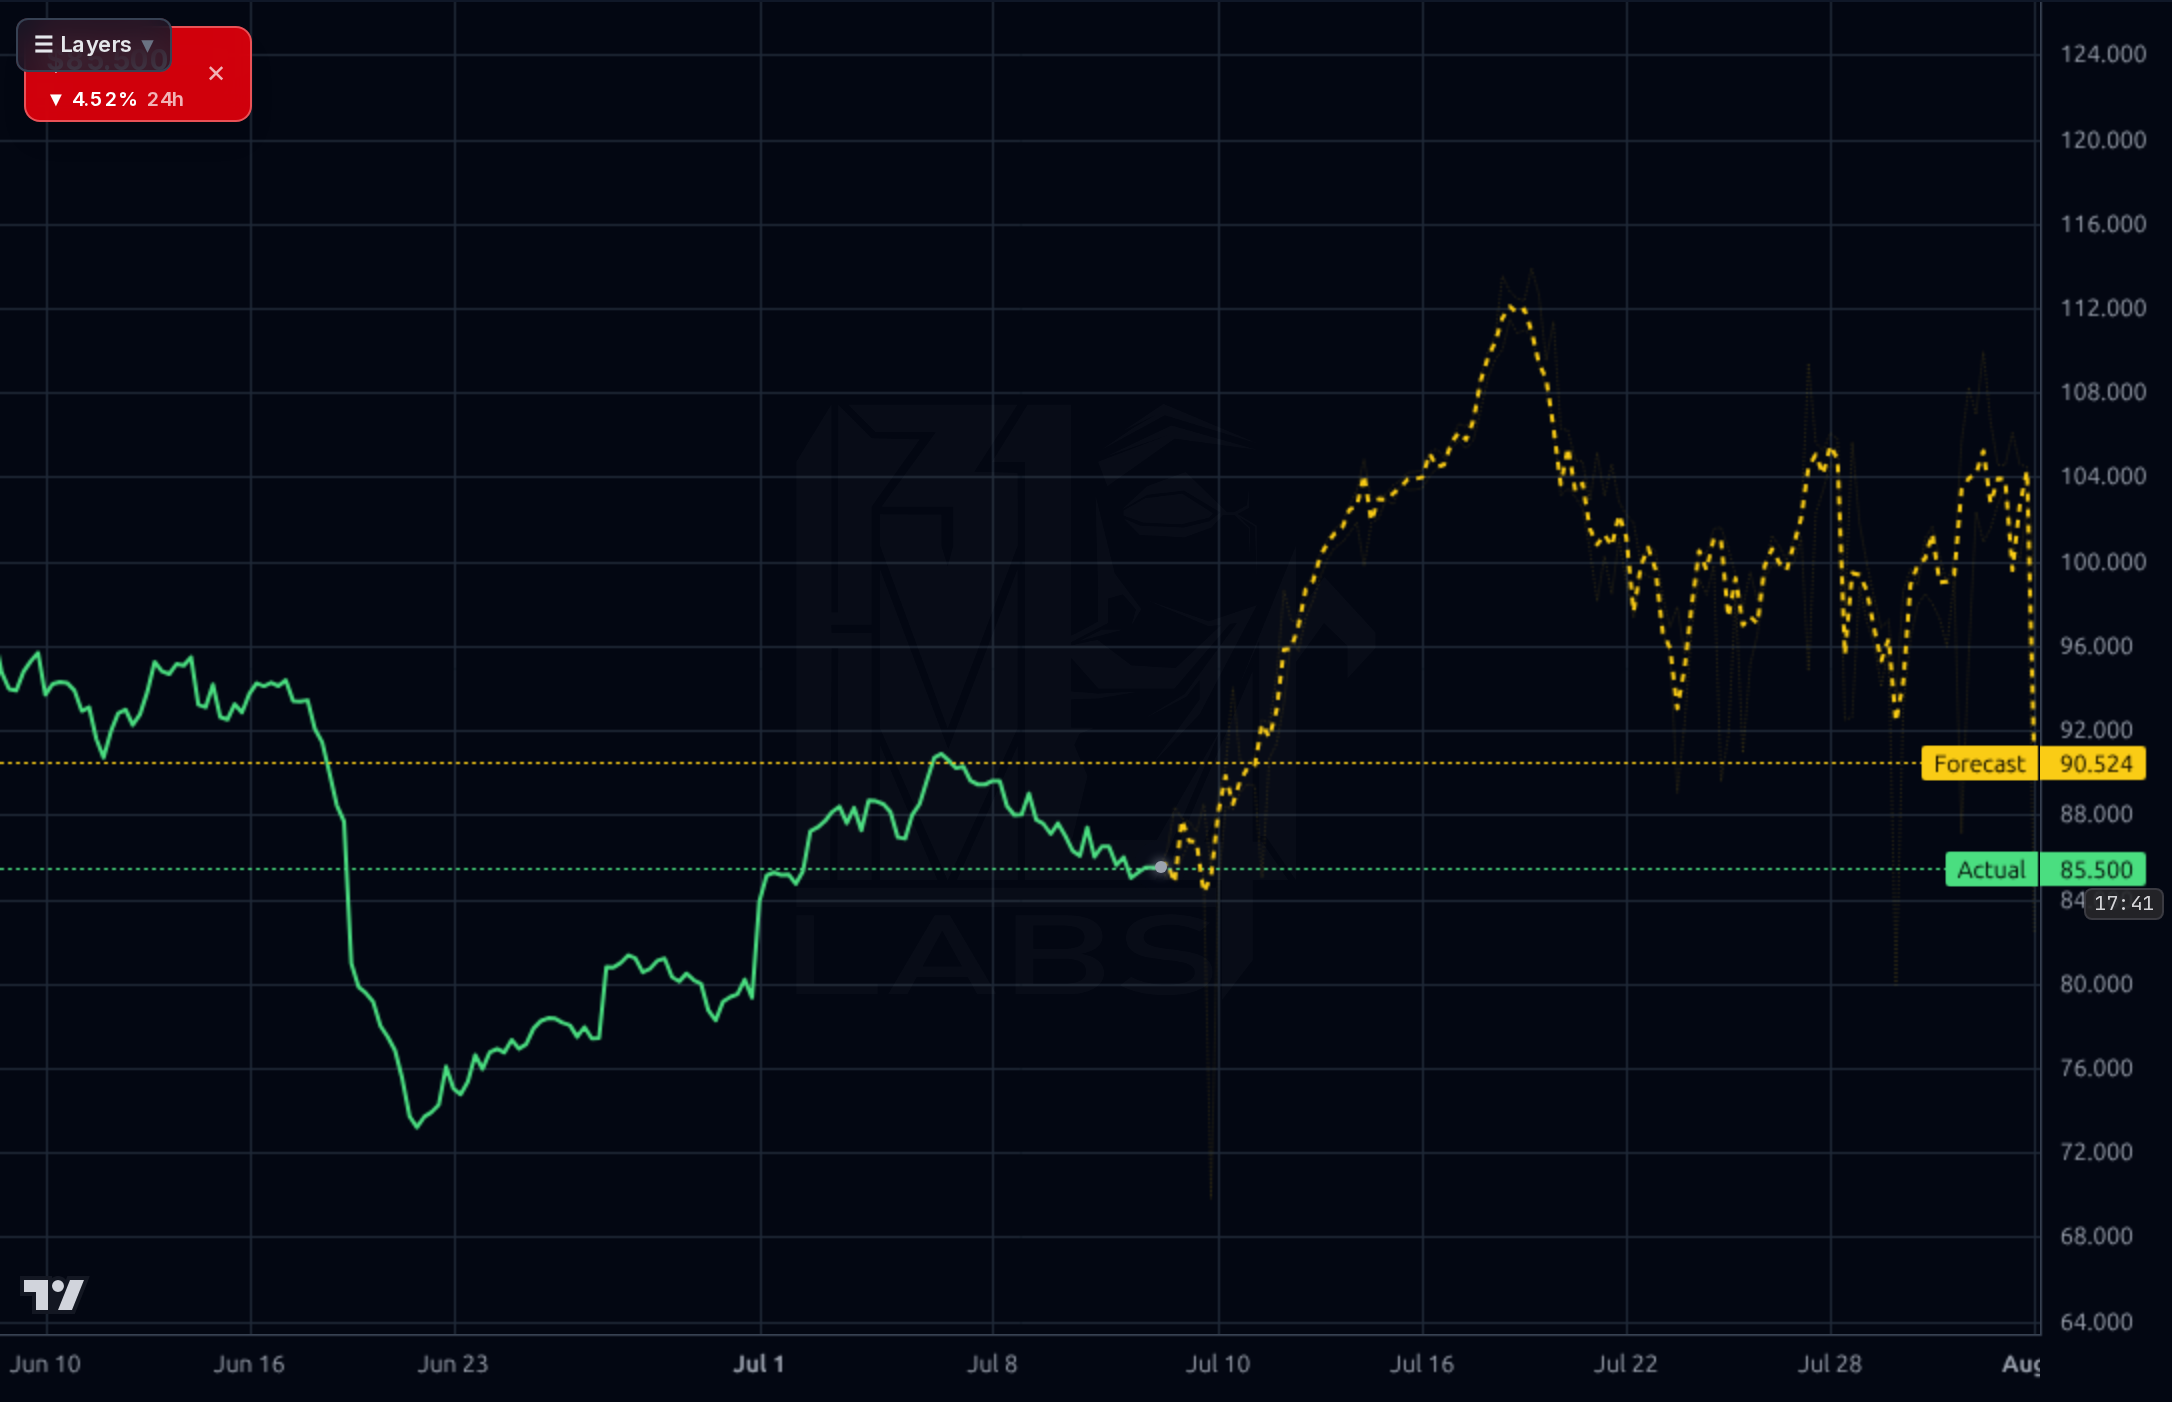
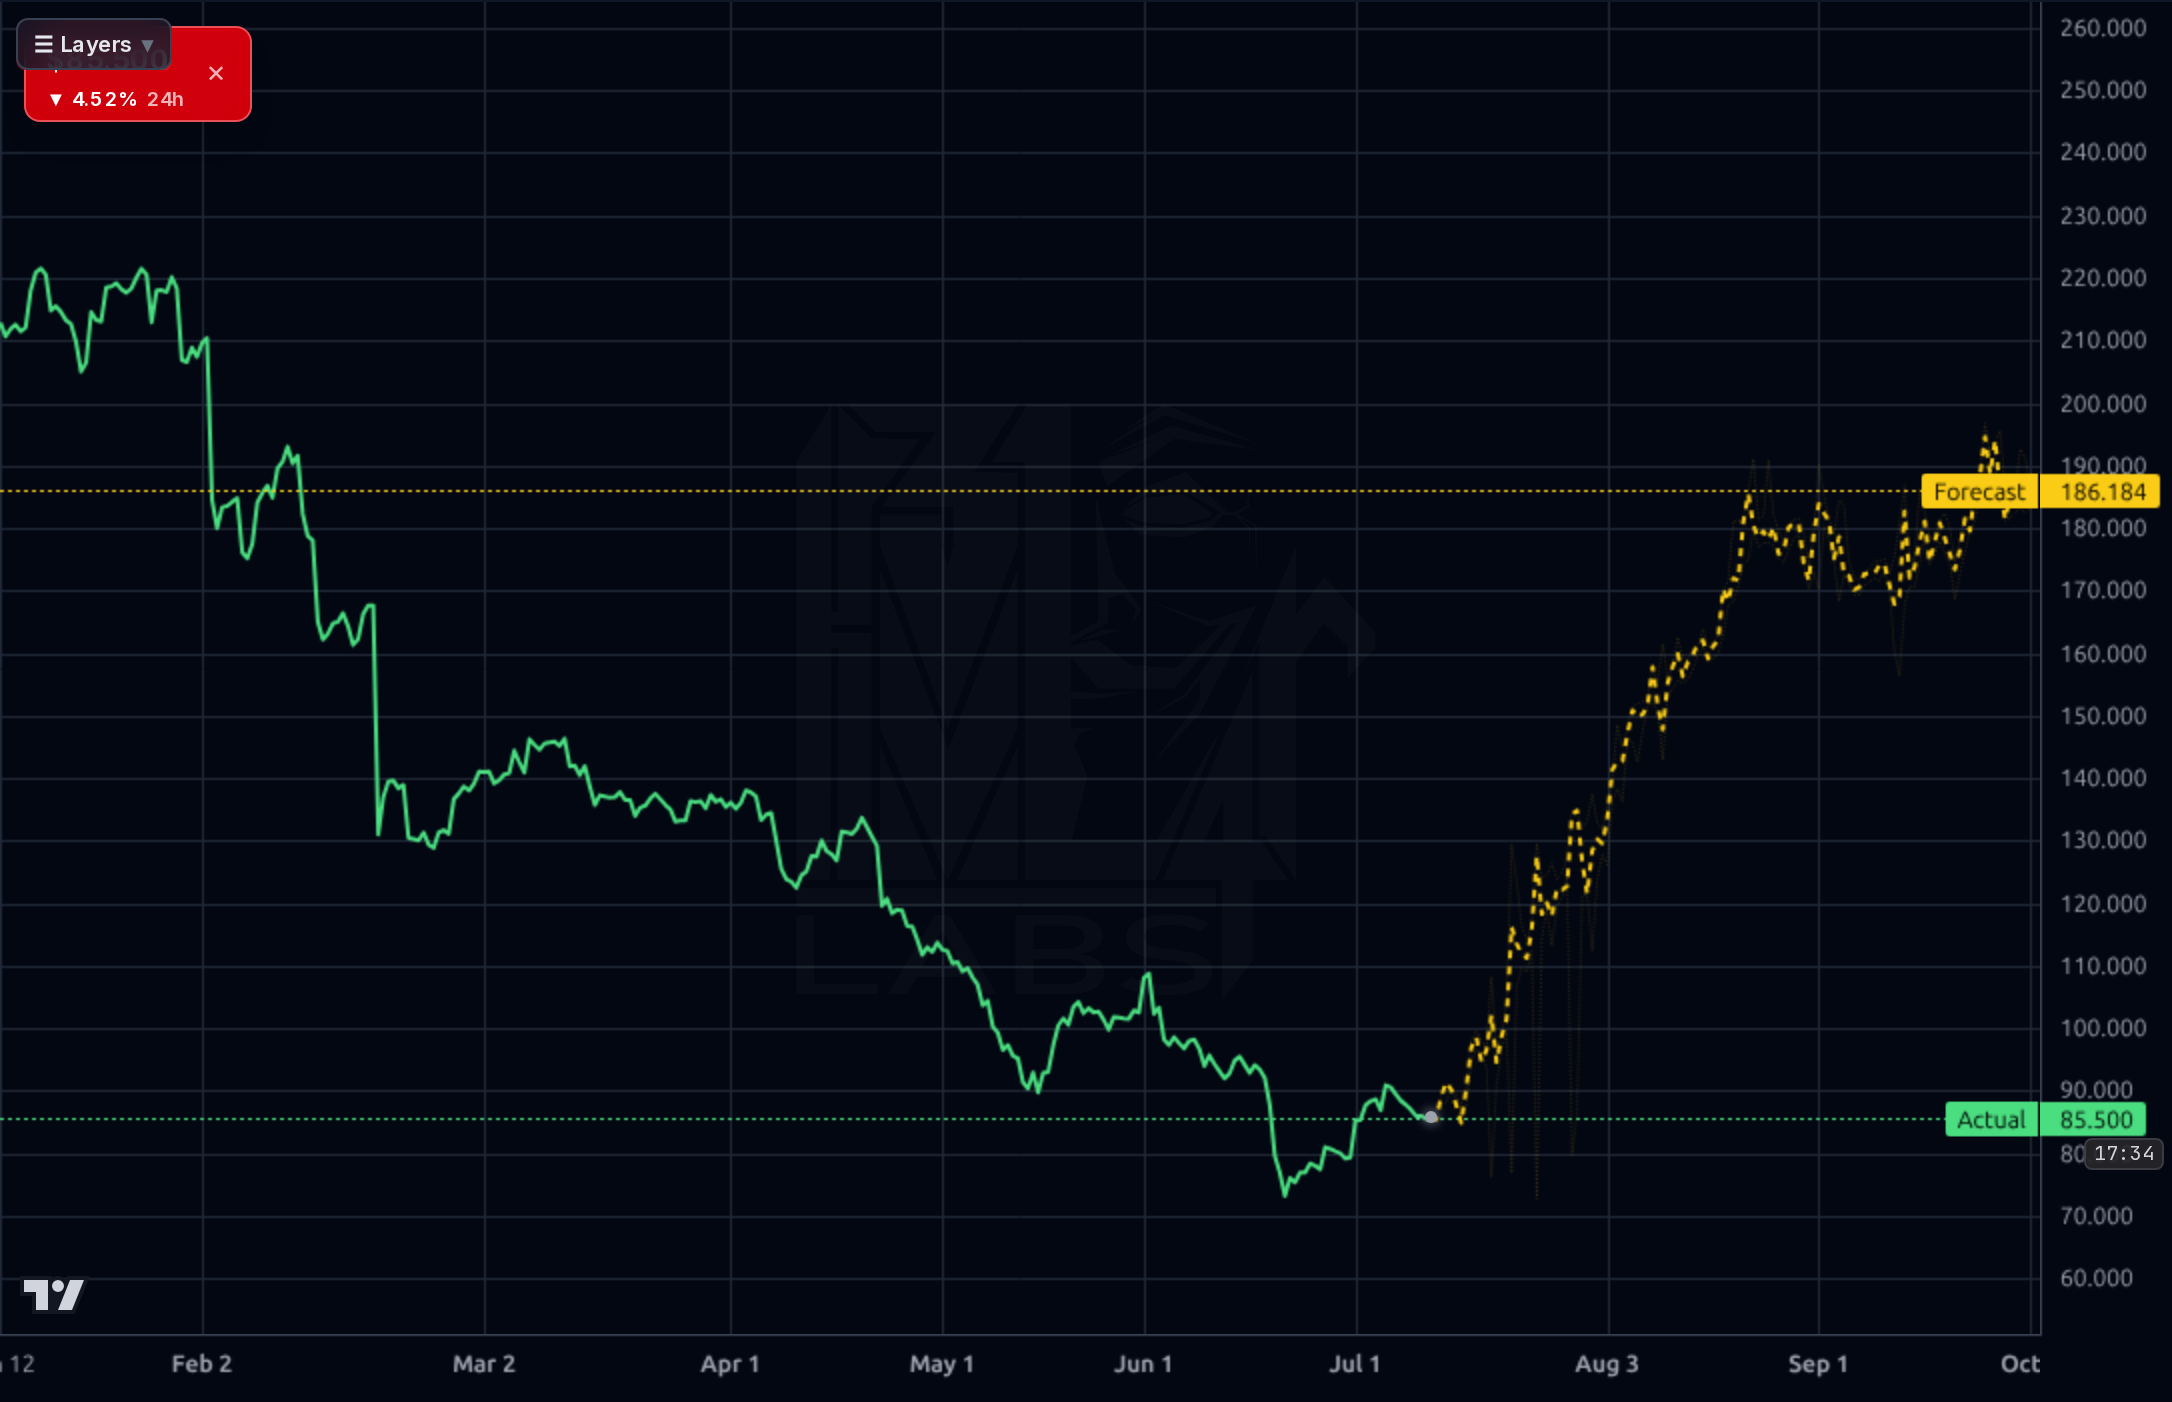
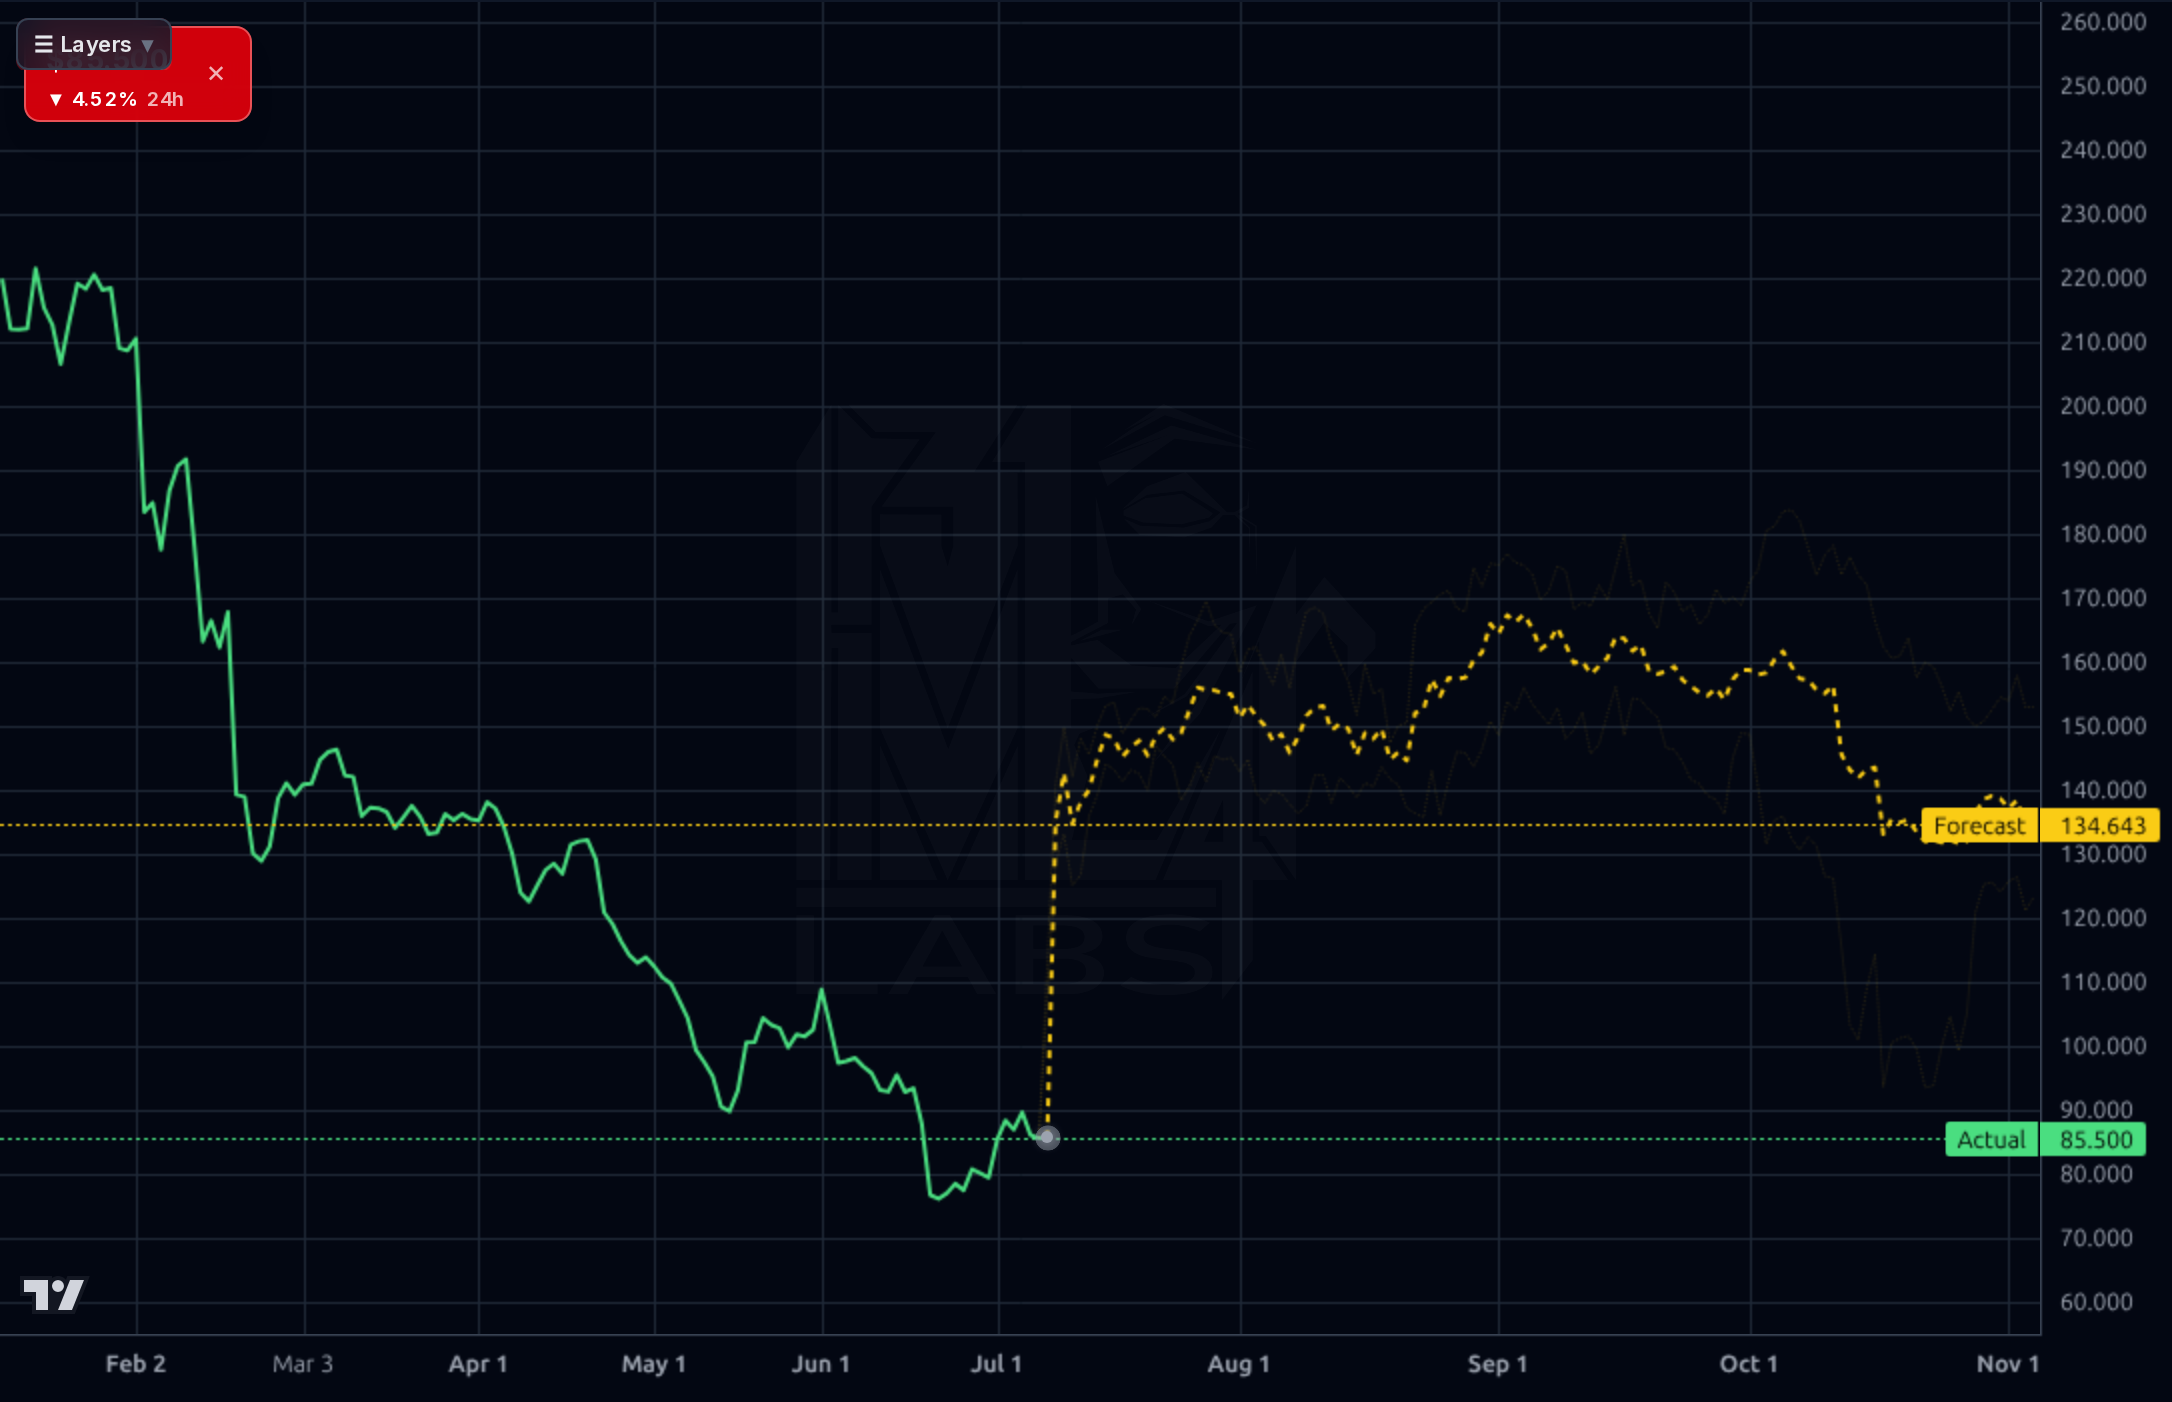
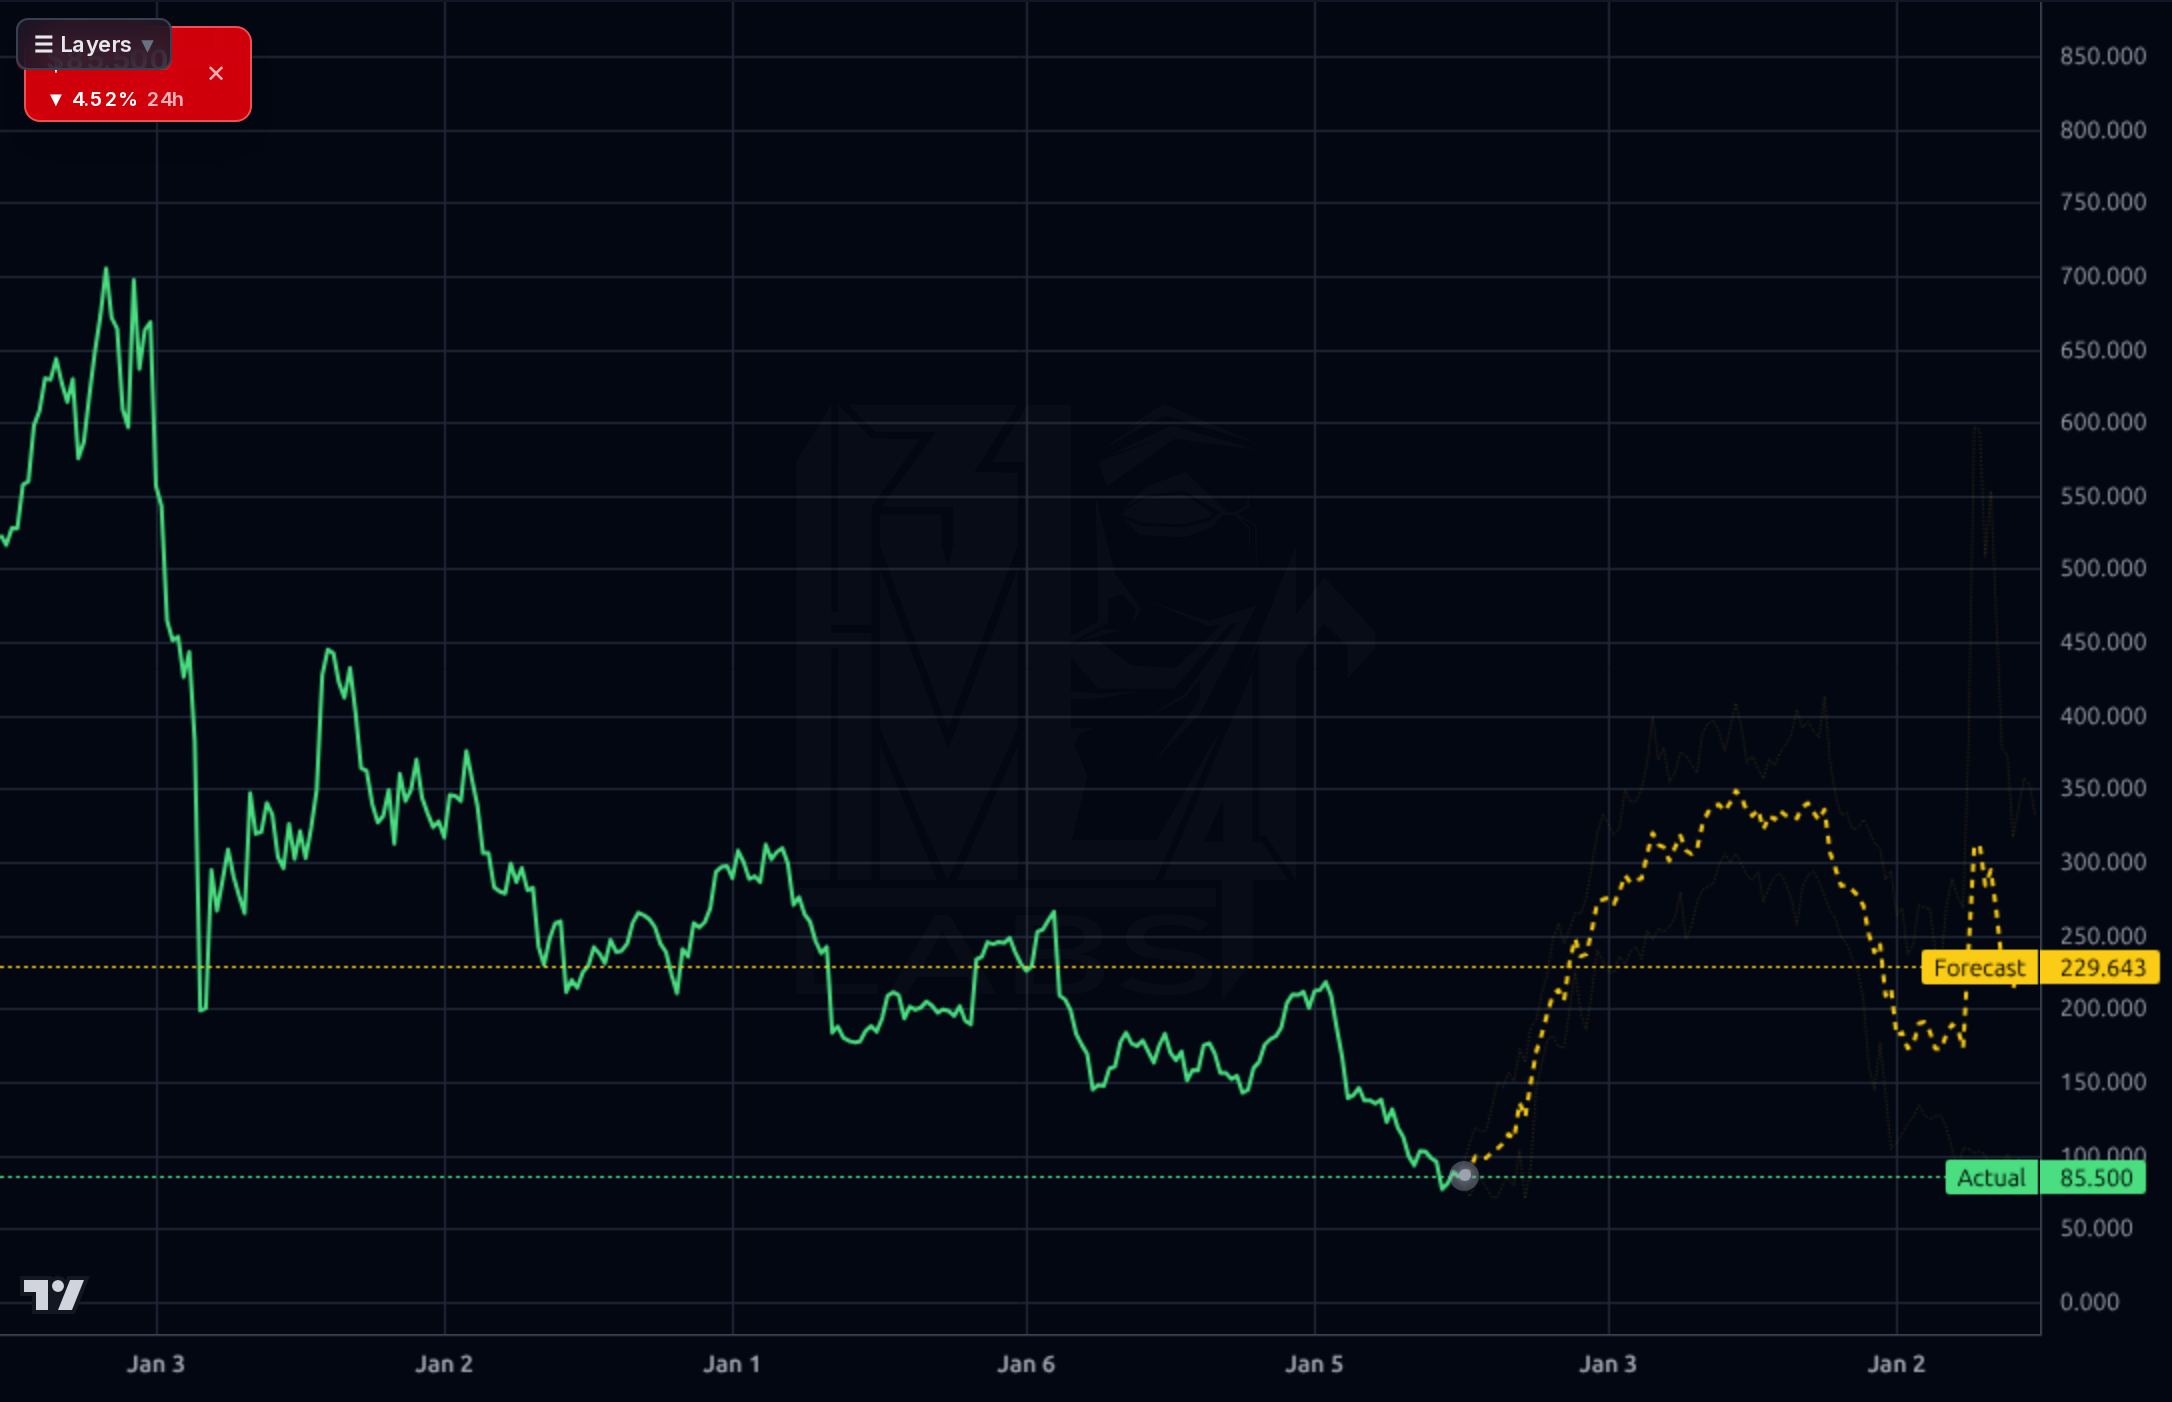
The tape is broken across all timeframes. On the weekly, EPAM has collapsed from ~$700 to ~$86 over the multi-year window, sitting near multi-year lows with no confirmed base. The daily chart shows a decline from $220 in February to a $73 low in late June, followed by a tentative bounce to the mid-$80s — RSI at 45 is neutral, price is +0.5% above the 20-day SMA but -10.4% below the 50-day and a staggering -42.8% below the 200-day, confirming a deep primary downtrend. The 1h and 4h charts show constructive short-term action off the $73 low with a rally back to $85-90. The model's forecast band is aggressively bullish on shorter horizons — 1h projects $90.5, 4h projects $186, 1d projects $135, 1wk projects $230 — but the realized 1d accuracy is 55% vs 56% naive baseline and 1d MAPE is 67%, so the model is unreliable in this regime and the upside targets should be heavily discounted. Overhead resistance sits at the $95-100 psychological zone, then the pre-collapse $130-140 shelf. Downside invalidation is a break below the $73 low. Short interest at 20.4% of float with a 5.2 days-to-cover ratio is a meaningful squeeze fuel if earnings surprises positively.
The recent news flow is mixed-to-supportive of the deep-value thesis but has not produced a catalyst. Positive items include recognition as Databricks' 2026 Consulting & Systems Integrator AI Partner of the Year and an expanded AWS-based AI collaboration with TGS in the energy vertical — both directly supporting management's pivot narrative from legacy services to higher-margin AI/cloud integration work. Zacks and Simply Wall St pieces highlight the valuation dislocation, with one analyst note reiterating a $135 price target and framing EPAM as mispricing a complex AI engineering moat. The negative development is removal from the Russell 1000 Value-Defensive and Defensive indexes in late June, which likely contributed to forced selling pressure and helps explain the June low. Net-net: the news validates the AI-transition narrative in the abstract but offers no revenue-level proof point ahead of the August 6th print, which remains the sole meaningful catalyst.
- Databricks 2026 Consulting & Systems Integrator AI Partner of the Year — direct pipeline into the highest-margin AI data platform integration work
- TGS AWS-based AI collaboration migrating Imaging AnyWare to cloud-native infrastructure — proof point for AI monetization in the energy vertical
- $1.04B cash + $693M TTM FCF supports aggressive buyback pace at 6x forward EPS — each 10% reduction in float adds ~$1.40 to EPS
- TTM revenue growth +14.2% Y/Y demonstrates underlying operational demand despite margin pressure and North American softness
- Forward EPS of $14.17 implies management/consensus expects meaningful margin recovery from current 8.3% operating margin base
- August 6th earnings binary risk — Q1 gross margin already compressed 240bps Q/Q; a second consecutive miss confirms structural, not cyclical, erosion
- Q1 2026 operating cash flow of -$36M breaks the balance sheet narrative if Q2 does not sharply reverse
- Structural AI disruption risk — clients insourcing engineering functions may permanently shrink the IT services TAM by 20-30%
- Russell 1000 Value-Defensive index removal signals institutional allocation loss and could accelerate forced selling
- 20.4% short float is fuel both ways — a bad print accelerates the decline as squeeze players unwind
- Multi-year tape damage (-83% five-year, -58% YTD) means technical support levels are unreliable; there is no established base
- North American demand weakness is the primary earnings headwind and has not shown clear inflection in publicly available data
- Prior bull-case targets on this name have systematically failed to print — historic $145-180 targets remain 60-100% away from live price
Get AI analysis on any stock
This is one of hundreds of Kronos AI reports — scored fundamentals & technicals, bull/base/bear price targets, a multi-horizon plan, and continuously-updated forecasts across the market. Create a free account to explore them all.
Create your free account →Already a member? Sign in · Join our Discord