EPAM— AI Stock Forecast & Price Targets
Published 7/1/2026 · A free sample of K3vl4r’s AI-powered analysis.
Kronos price forecasts, scored fundamentals & technicals, and a multi-horizon plan.
View the live EPAM price forecast →
EPAM has been crushed in 2026 (-61% YTD, -55% YoY) on North American demand weakness and AI-driven services disruption fears, now trading at 5.6x forward EPS with $1.04B net cash and a 20% short interest — a classic deep-value setup with real secular risk. Fundamentals remain intact (Q1 2026 revenue +7.5% Q/Q, 27.7% gross margin, positive FCF TTM ~$693M) but Q1 operating cash flow turned negative on working capital swings and margins are compressing. Recommendation is ACCUMULATE with medium conviction — the risk/reward at $80 is favorable but the August 6 earnings print is a binary catalyst that could re-rate the name either direction.
1-4 week view: Cautious constructive but respect the earnings binary on August 6 (~5 weeks out). Small starter position at $79-80 with adds on any test of $73-75 support. Immediate upside is a mean-reversion bounce toward $88-92 (breakdown zone) driven by oversold RSI, 20% short interest squeeze potential, and the recent Databricks/AWS wins. Stop / invalidation: close below $72 on a weekly basis (breach of 52-week low). Do NOT size a full position into the print — keep any pre-earnings exposure to 1/3 of intended size. Earnings stance: neutral-to-cautious; guidance was cut in May so the bar is lower, but the sector-wide services slowdown creates real miss risk.
1-6 month view: The base case is a re-rating from ~5.6x forward EPS toward 8-10x as either (a) demand stabilizes and Q3/Q4 guidance improves, or (b) AI-related wins (Databricks, AWS/TGS-type deals) show up in bookings. Expected return range: +25% to +50% to $100-120 over six months if the August print does not deliver another guide-down. Catalysts: August 6 earnings, any new large AI-engineering contract announcements, evidence of North America stabilization. What would change my mind: another cut to full-year revenue guidance below $5.4B, gross margin compression below 26%, or evidence that existing clients are internalizing engineering work with AI tooling.
1-3 year view: EPAM's terminal thesis depends on whether complex platform engineering remains a differentiated, high-value service or gets commoditized by AI code generation. The bull case: EPAM's 62.7K engineers become AI-augmented platform architects, revenue re-accelerates to teens, margins recover to 12-15% operating, and the stock re-rates to 15-18x on normalized earnings — a path to $180-220. The bear case: services demand structurally impaired, revenue flat-to-down for years, margins stuck at 8-10%, and the multiple stays at 6-8x — $60-80 range persists. Biggest structural risk is that generative AI reduces the labor content of software delivery faster than EPAM can move up the value stack. The fortress balance sheet ($1B net cash, $693M FCF) buys significant time to adapt.
EPAM's financial profile is stronger than the price action suggests. TTM revenue is $5.56B with Sales Y/Y TTM of +14.2% and Q1 2026 revenue of $1.40B (+7.6% Q/Q). Gross margins have compressed from ~30% in Q4 2025 to 27.7% in Q1 2026 and operating margin fell to 8.3% from 10.6% — a real deterioration reflecting pricing pressure and utilization issues. Net income of $82.5M in Q1 is down from $109M in Q4. Balance sheet is a fortress: $1.04B cash, only $288M debt, D/E of 0.08, current ratio 2.67, book value $65/share versus $79 price (P/B 1.22). TTM FCF of $693M against a $4.15B market cap gives a P/FCF of 7.6x — cheap. The wart: Q1 2026 operating cash flow was -$36M (seasonal working capital, but worth watching). ROE at 10.9% and ROIC at 10.5% are mediocre for a tech services firm. Capital allocation has been buyback-focused (share count 52.2M, no dividend). Valuation at 5.6x forward EPS, 0.61x EV/Sales, 4.9x EV/EBITDA, PEG 0.53 is deeply discounted versus peers — the market is pricing in structural impairment, not just cyclical weakness.
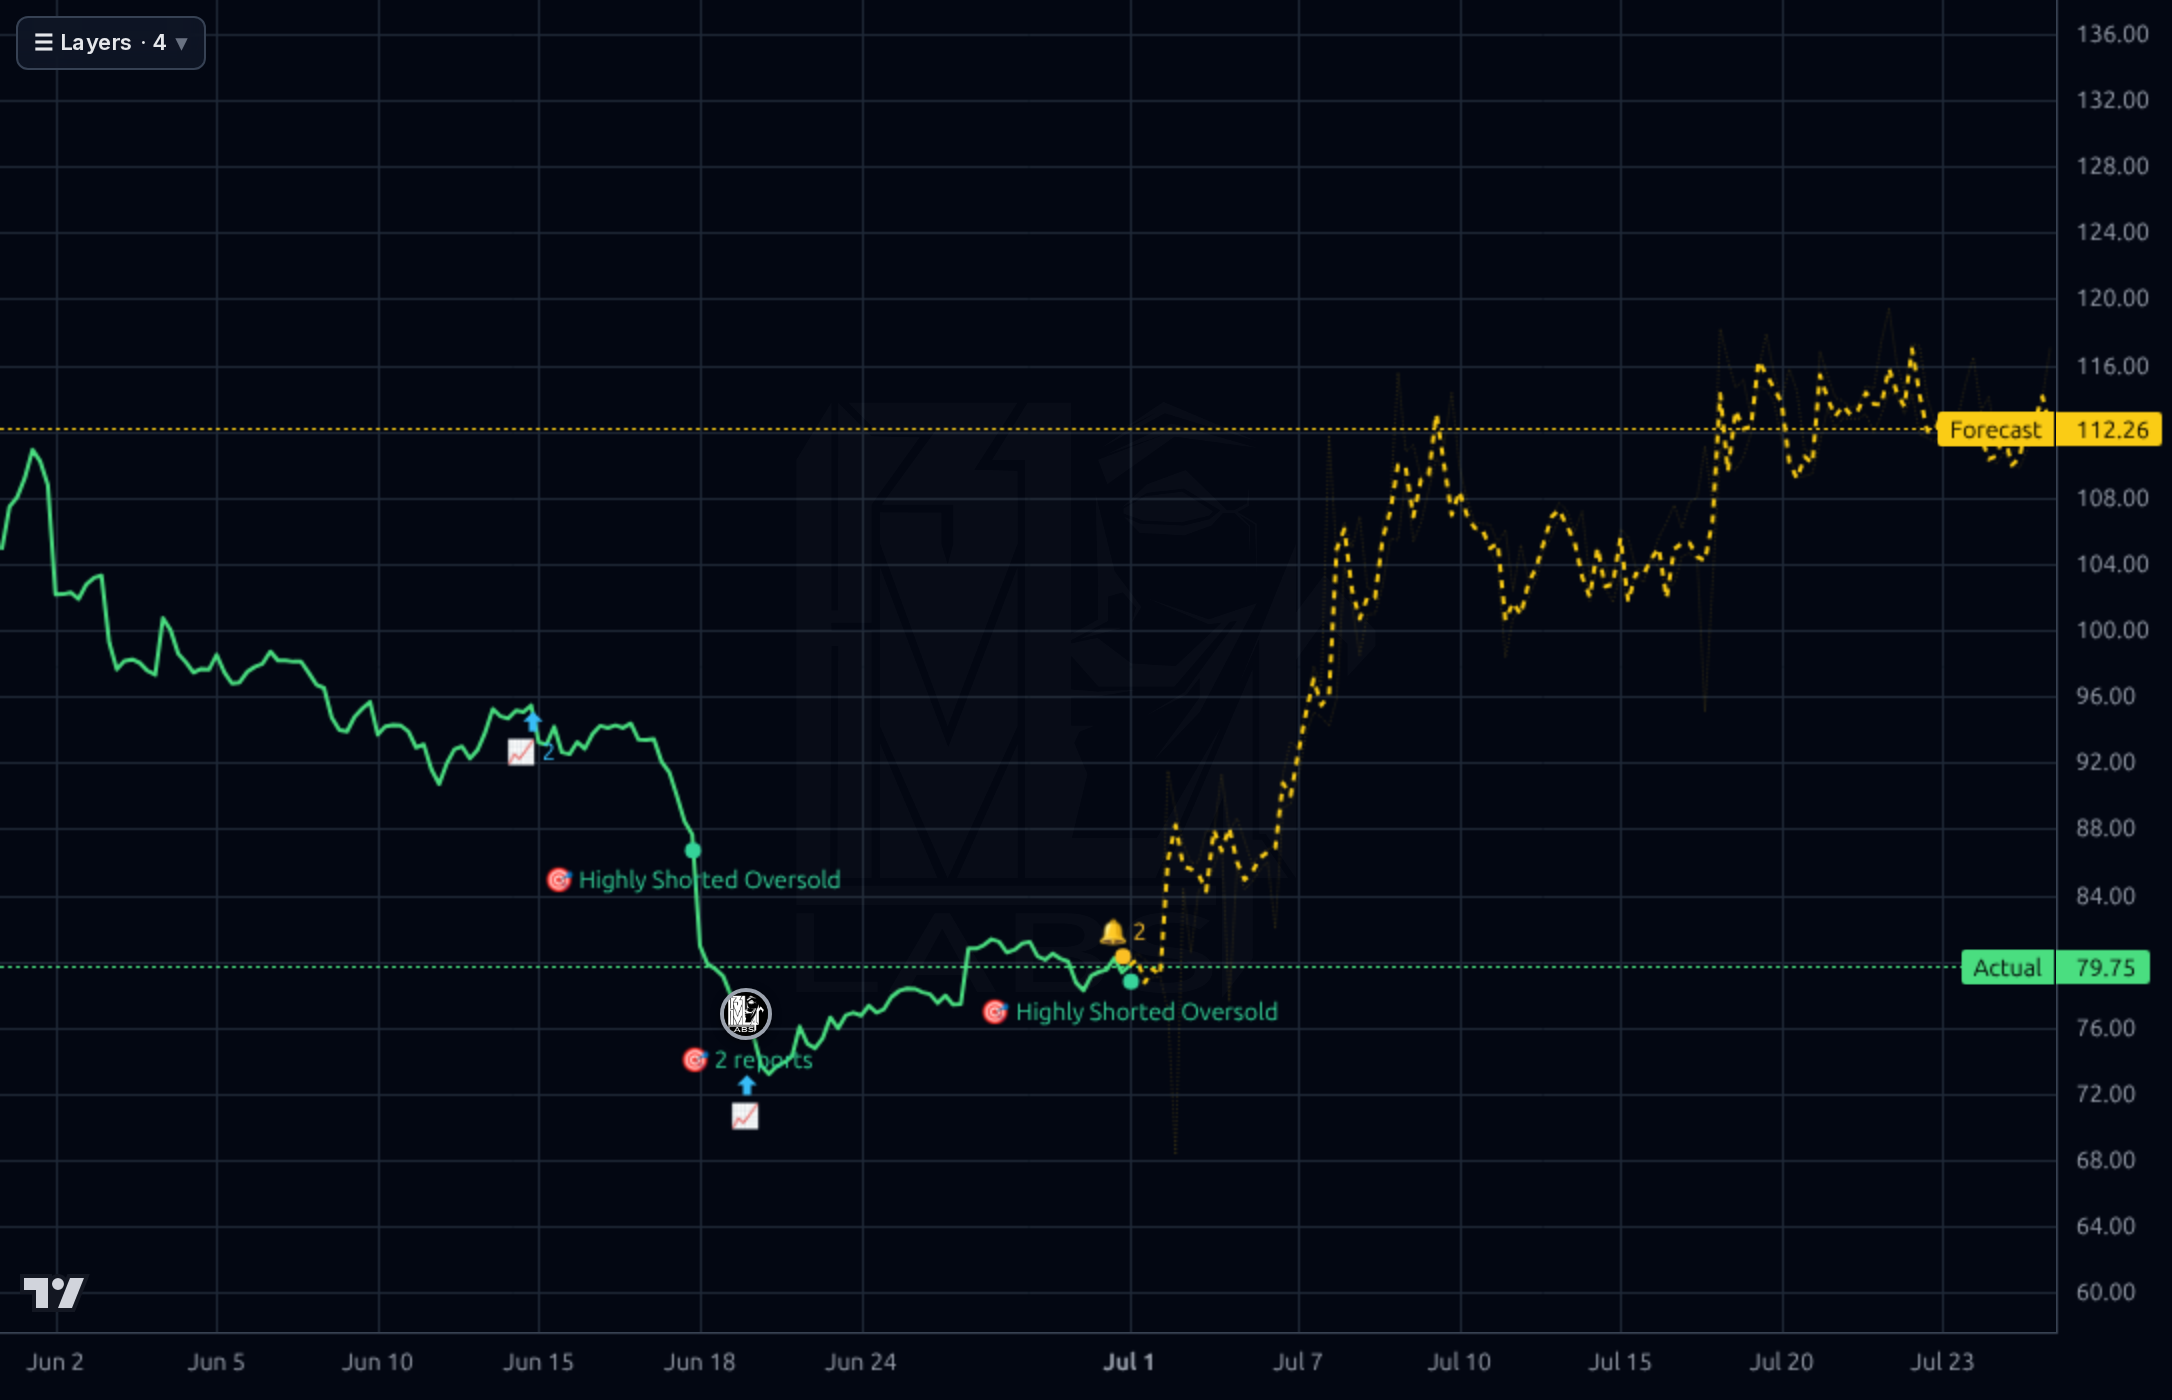
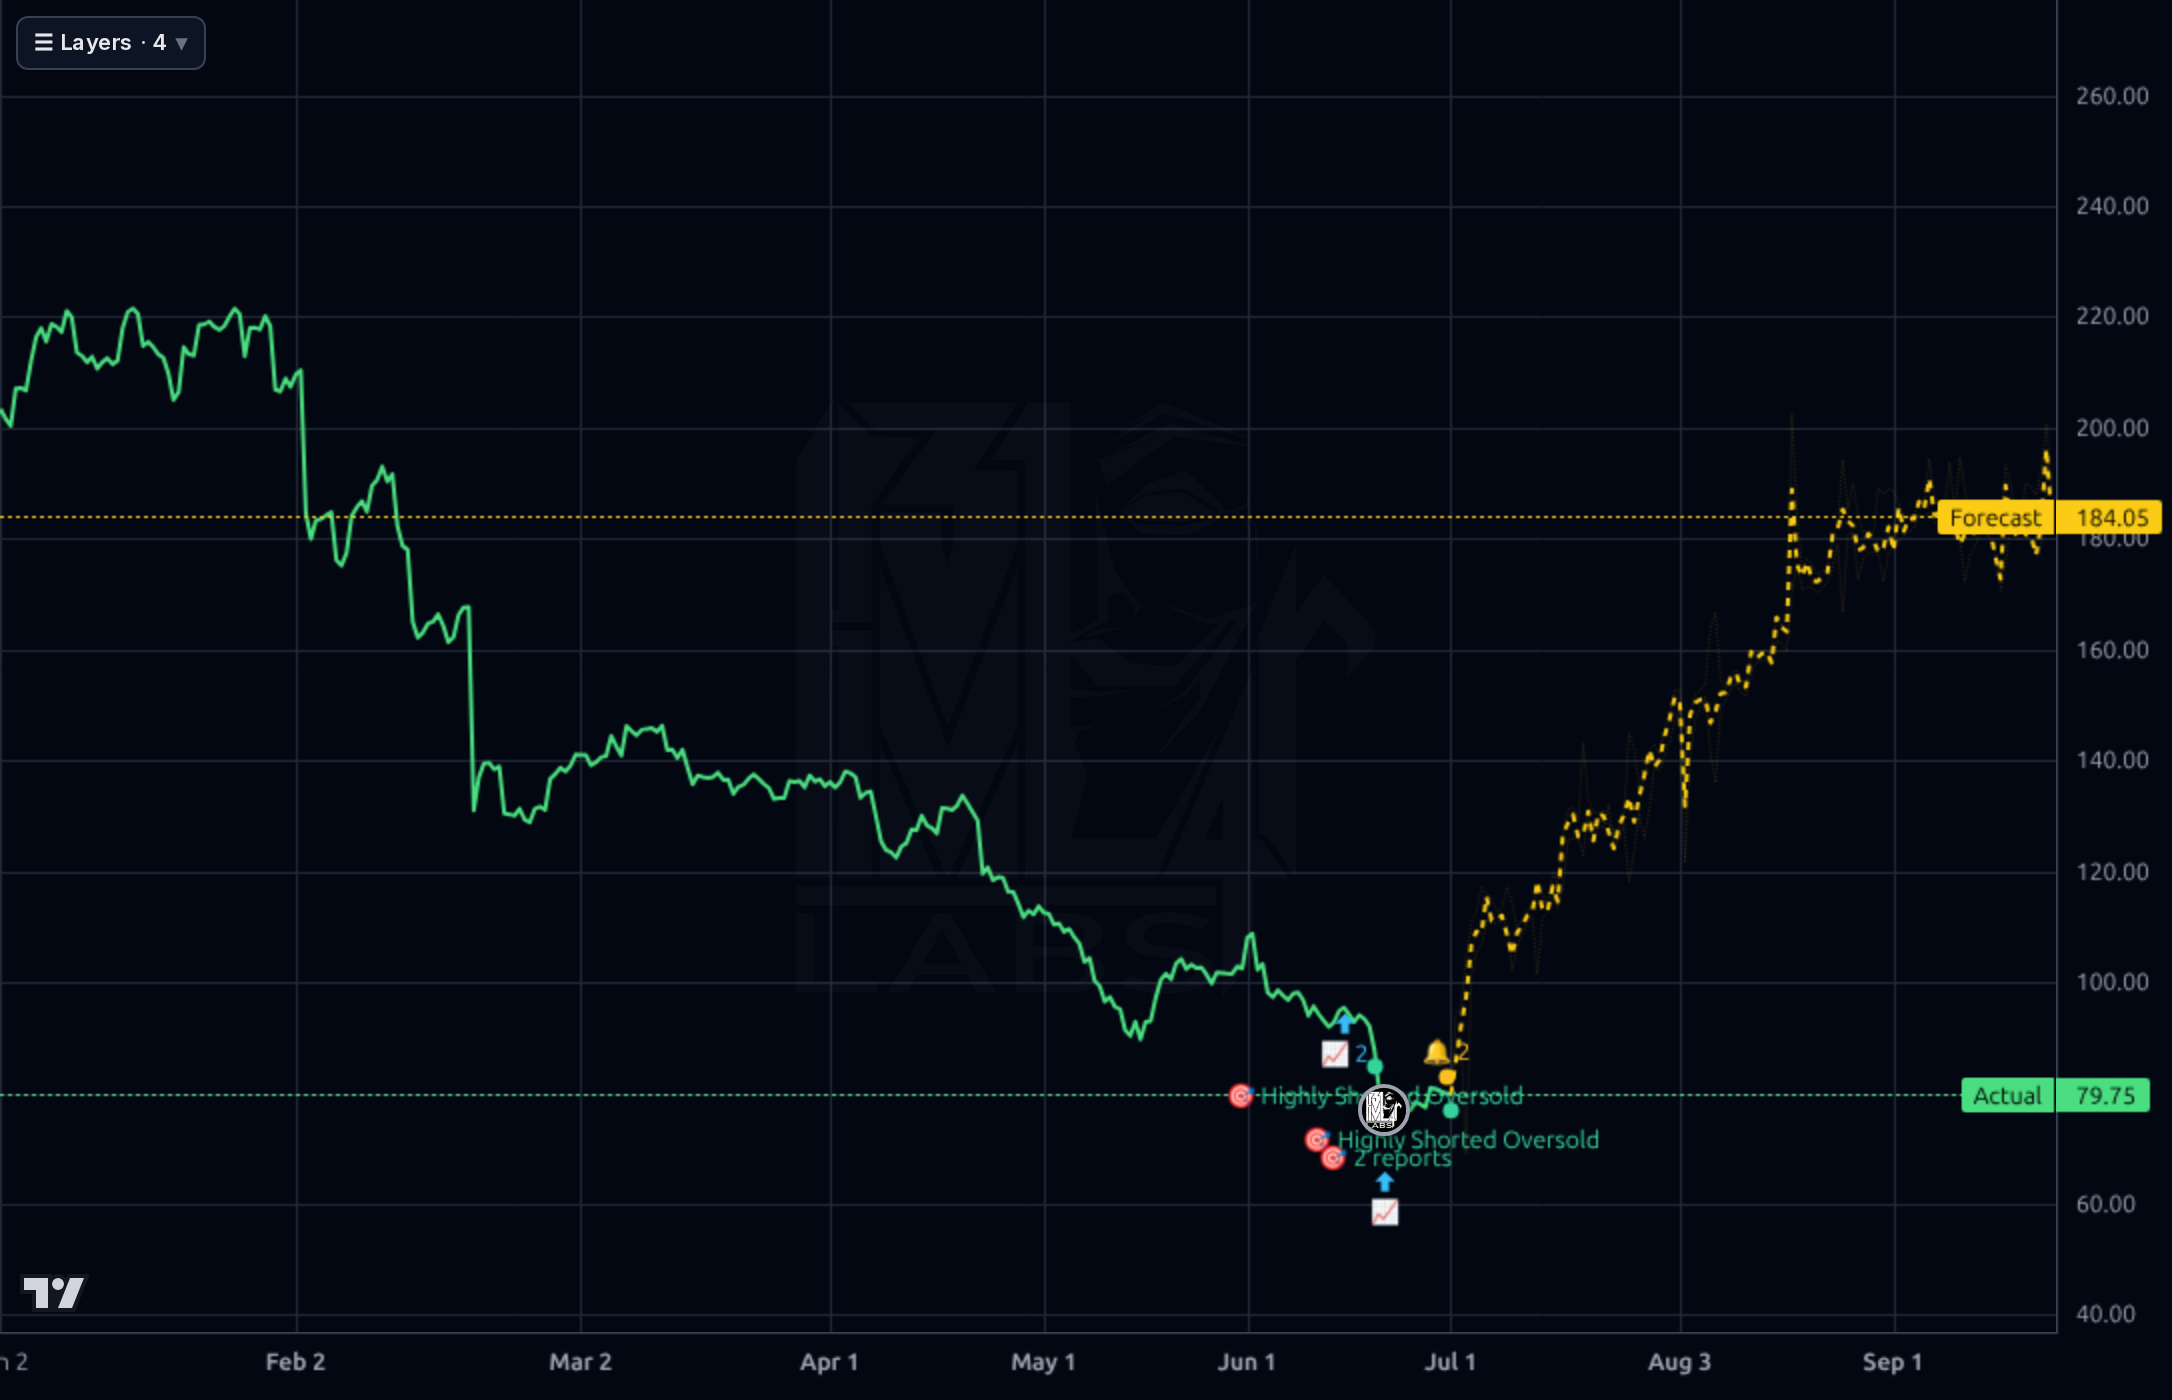
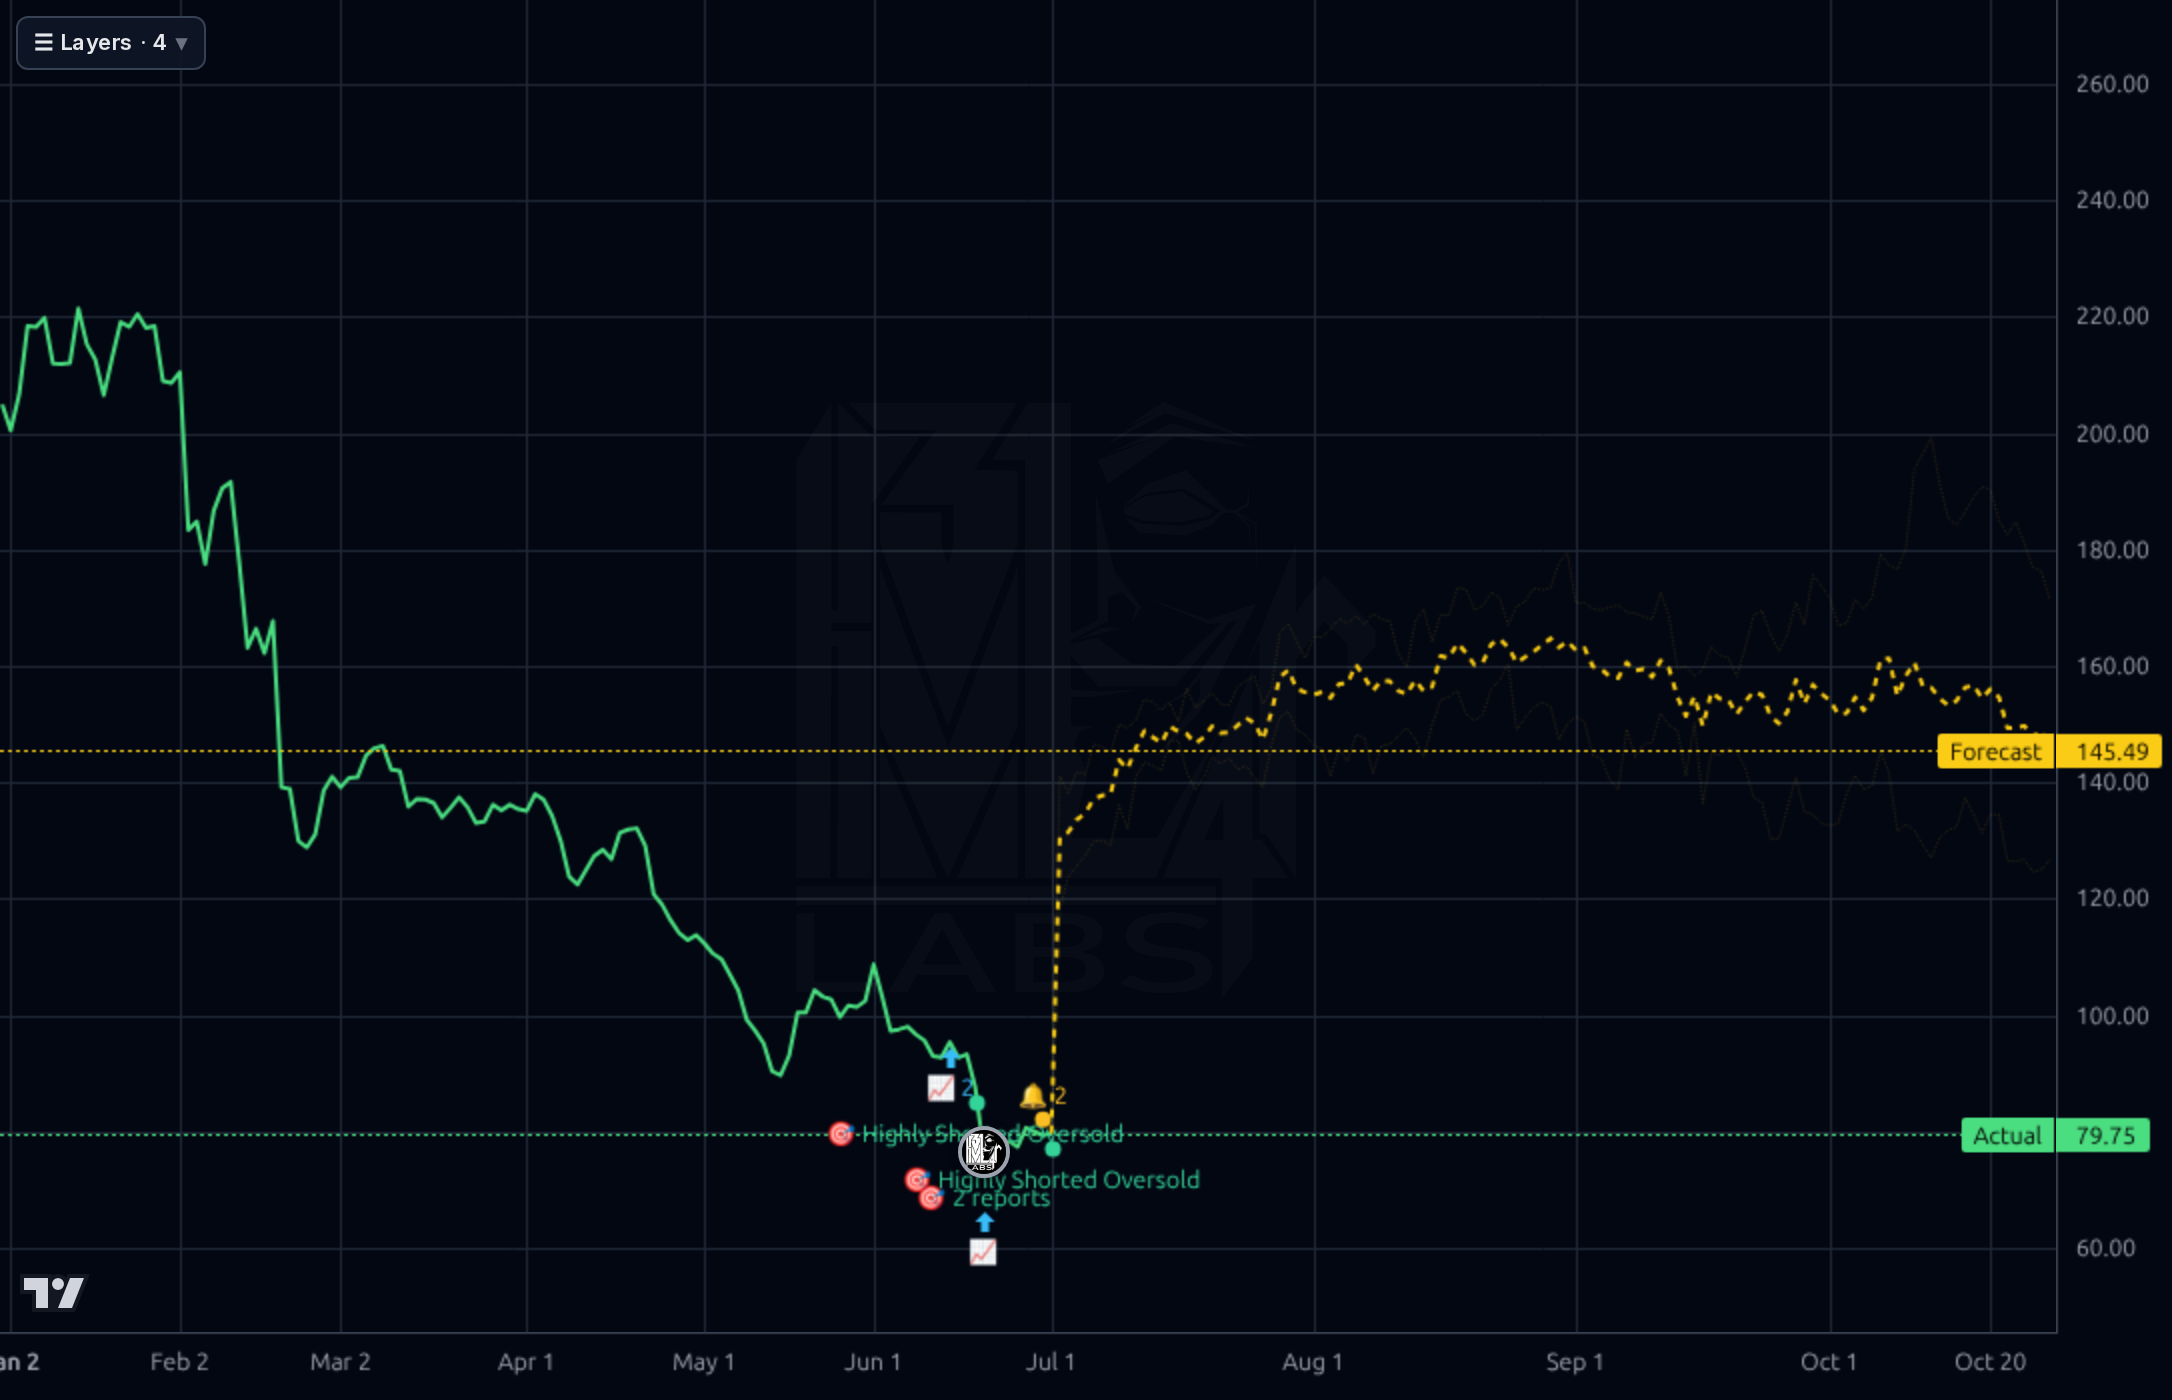
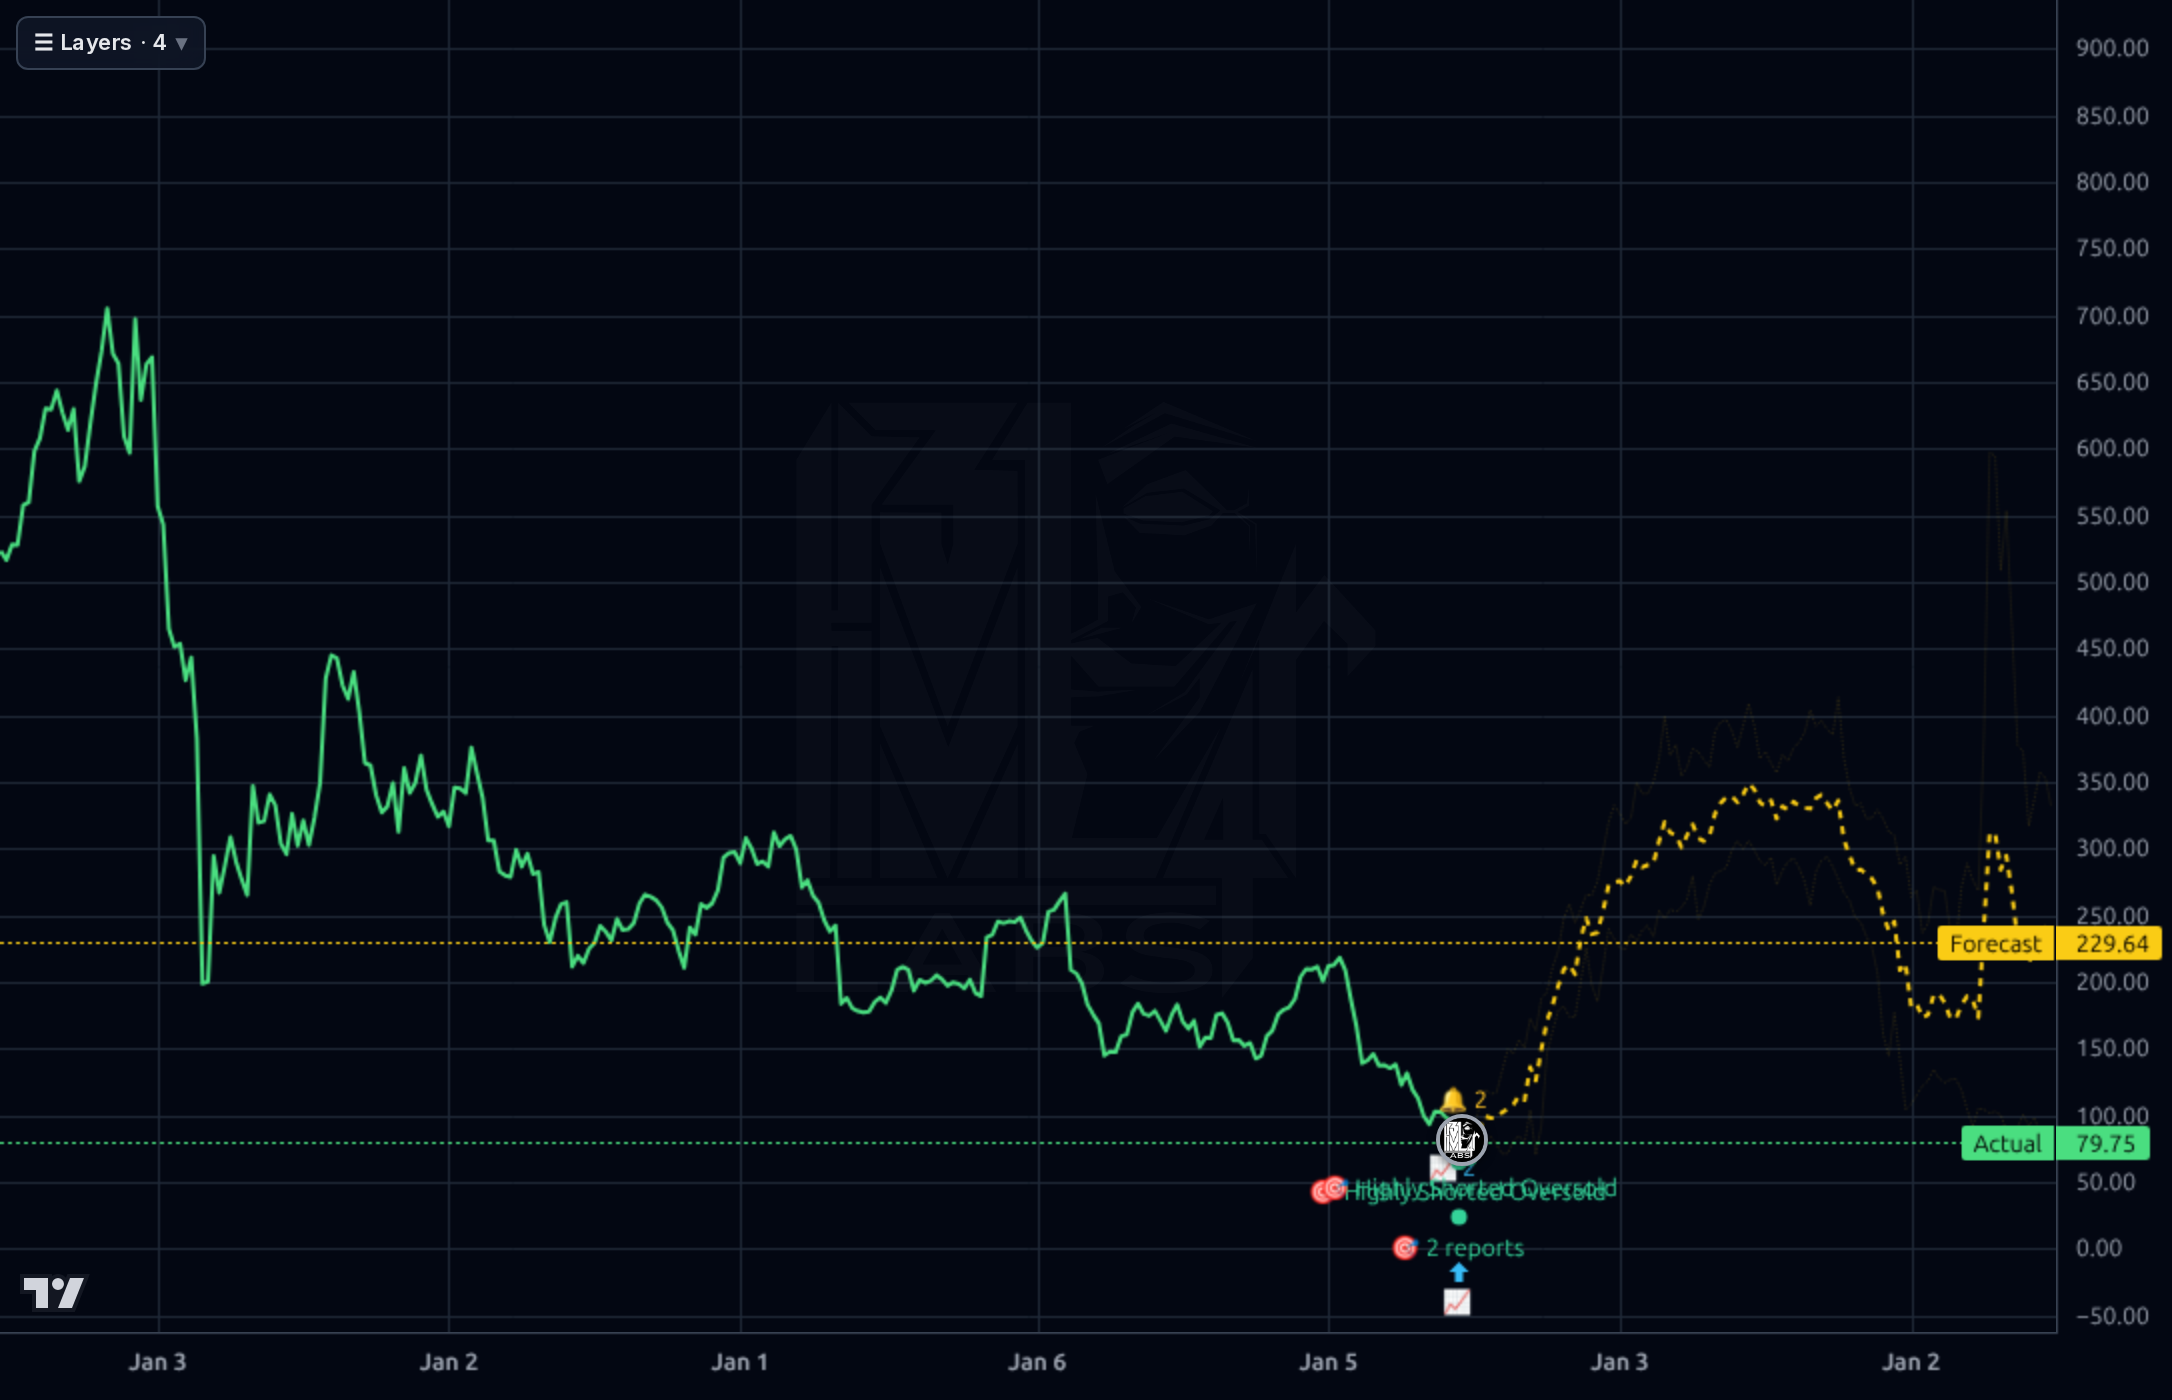
The multi-timeframe picture is broadly bearish but stretched to the downside. On the weekly chart, price has collapsed from ~$700 in 2022 to $79.75, sitting near multi-year lows. Daily chart shows a persistent downtrend from ~$220 in January 2026 with recent stabilization around $75-80 — the SMA200 is 47.8% above price and SMA50 is 20.5% above, confirming a strong downtrend with no reclaim in sight. RSI(14) at 32 is oversold but not extreme. The 4h chart shows a capitulation-like flush in mid-June from ~$95 to $73 (52-week low) followed by consolidation and a green dot marking oversold conditions. The 1h chart shows a modest bounce off the low with a 'Highly Shorted Oversold' signal — 20.4% short float is notable and creates squeeze potential. The forecast model shows sharp bullish reversal to $112 (1h) / $184 (4h) / $145 (1d), but the model's realized directional accuracy at 33% (1d) and 50% (1wk) is below the 67% naive baseline with a 73% MAPE — the model is unreliable in this regime and its aggressive upside forecast should be heavily discounted. Key levels: support $73 (52w low), $75-77 recent consolidation floor; resistance $88-92 (mid-June breakdown zone), $96-100 (SMA50 area), $115-120 (major supply).
The news flow is mixed but tilting cautiously constructive. Positives: EPAM was named Databricks 2026 AI Partner of the Year and expanded an AWS-based AI collaboration with TGS in energy — evidence the company is winning meaningful AI engineering mandates rather than being displaced by AI. A sell-side note argues EPAM has a 'mispriced complex AI engineering moat' with a $135 price target, echoing the deep-value case. Negatives: EPAM was removed from Russell 1000 Value-Defensive and Defensive indexes in late June, which mechanically pressures passive flows. Another piece downgraded the name to Hold, noting EPAM lowered 2026 guidance in May reflecting sector-wide slowdown and calling AI threat 'becoming real.' Long-term underperformance (-84.7% over five years) is now widely acknowledged. Net signal: the AI narrative is bifurcated — EPAM is both a beneficiary (partnerships, engineering complexity moat) and a potential victim (commoditization of code output). Guidance cut in May is the key overhang into the August print.
- AI engineering partnerships materializing: Databricks 2026 AI Partner of the Year and TGS/AWS seismic data platform migration signal wins in complex AI systems integration
- Deep-value re-rating optionality — at 5.6x forward EPS and 0.61x EV/Sales with $1.04B net cash, any stabilization in guidance could drive a 30-50% multiple expansion
- Short squeeze setup: 20.4% short float with short ratio of 5.4x days-to-cover on any positive earnings surprise August 6
- Q1 2026 revenue +7.6% Q/Q shows demand is not falling off a cliff despite the May guide-down
- $693M TTM free cash flow enables aggressive buybacks at current $4.15B market cap (17% FCF yield) — a floor under the stock
- August 6 earnings is a binary event with elevated risk of another guidance cut following the May reduction
- Gross margin compressed from 30.1% (Q4 2025) to 27.7% (Q1 2026) — pricing pressure is real and could persist
- AI-driven services disruption is the core bear thesis: if clients internalize engineering with AI tooling, EPAM's revenue base structurally erodes
- Russell 1000 Value-Defensive/Defensive index removals create ongoing passive selling pressure
- North American demand weakness remains the primary macro headwind; recovery timing unclear
- Stock has lost 85% over 5 years and 61% YTD — trend is deeply negative and value traps can persist for years
- Q1 2026 operating cash flow of -$36M (vs. +$283M in Q4) needs to reverse quickly or the FCF story weakens
- Forecast model directional accuracy of 33% (1d) and 50% (1wk) is below naive baseline — the aggressive bullish forecasts to $112-$184 should be heavily discounted
Get AI analysis on any stock
This is one of hundreds of Kronos AI reports — scored fundamentals & technicals, bull/base/bear price targets, a multi-horizon plan, and continuously-updated forecasts across the market. Create a free account to explore them all.
Create your free account →Already a member? Sign in · Join our Discord