GPI — AI Stock Forecast & Price Targets
Published 7/8/2026 · A free sample of K3vl4r’s AI-powered analysis.
Kronos price forecasts, scored fundamentals & technicals, and a multi-horizon plan.
View the live GPI price forecast →
GPI presents a classic high-risk, event-driven investment profile, trading at a headline-cheap 6.3x Forward P/E but underpinned by severe fundamental deterioration, most notably collapsing Free Cash Flow (FCF) from $180M to $8.4M. The near-term thesis is entirely binary, hinging on the July 23rd earnings report for any credible guidance on cash stabilization and debt management. Until FCF trajectory improves, valuation metrics are secondary to balance sheet health.
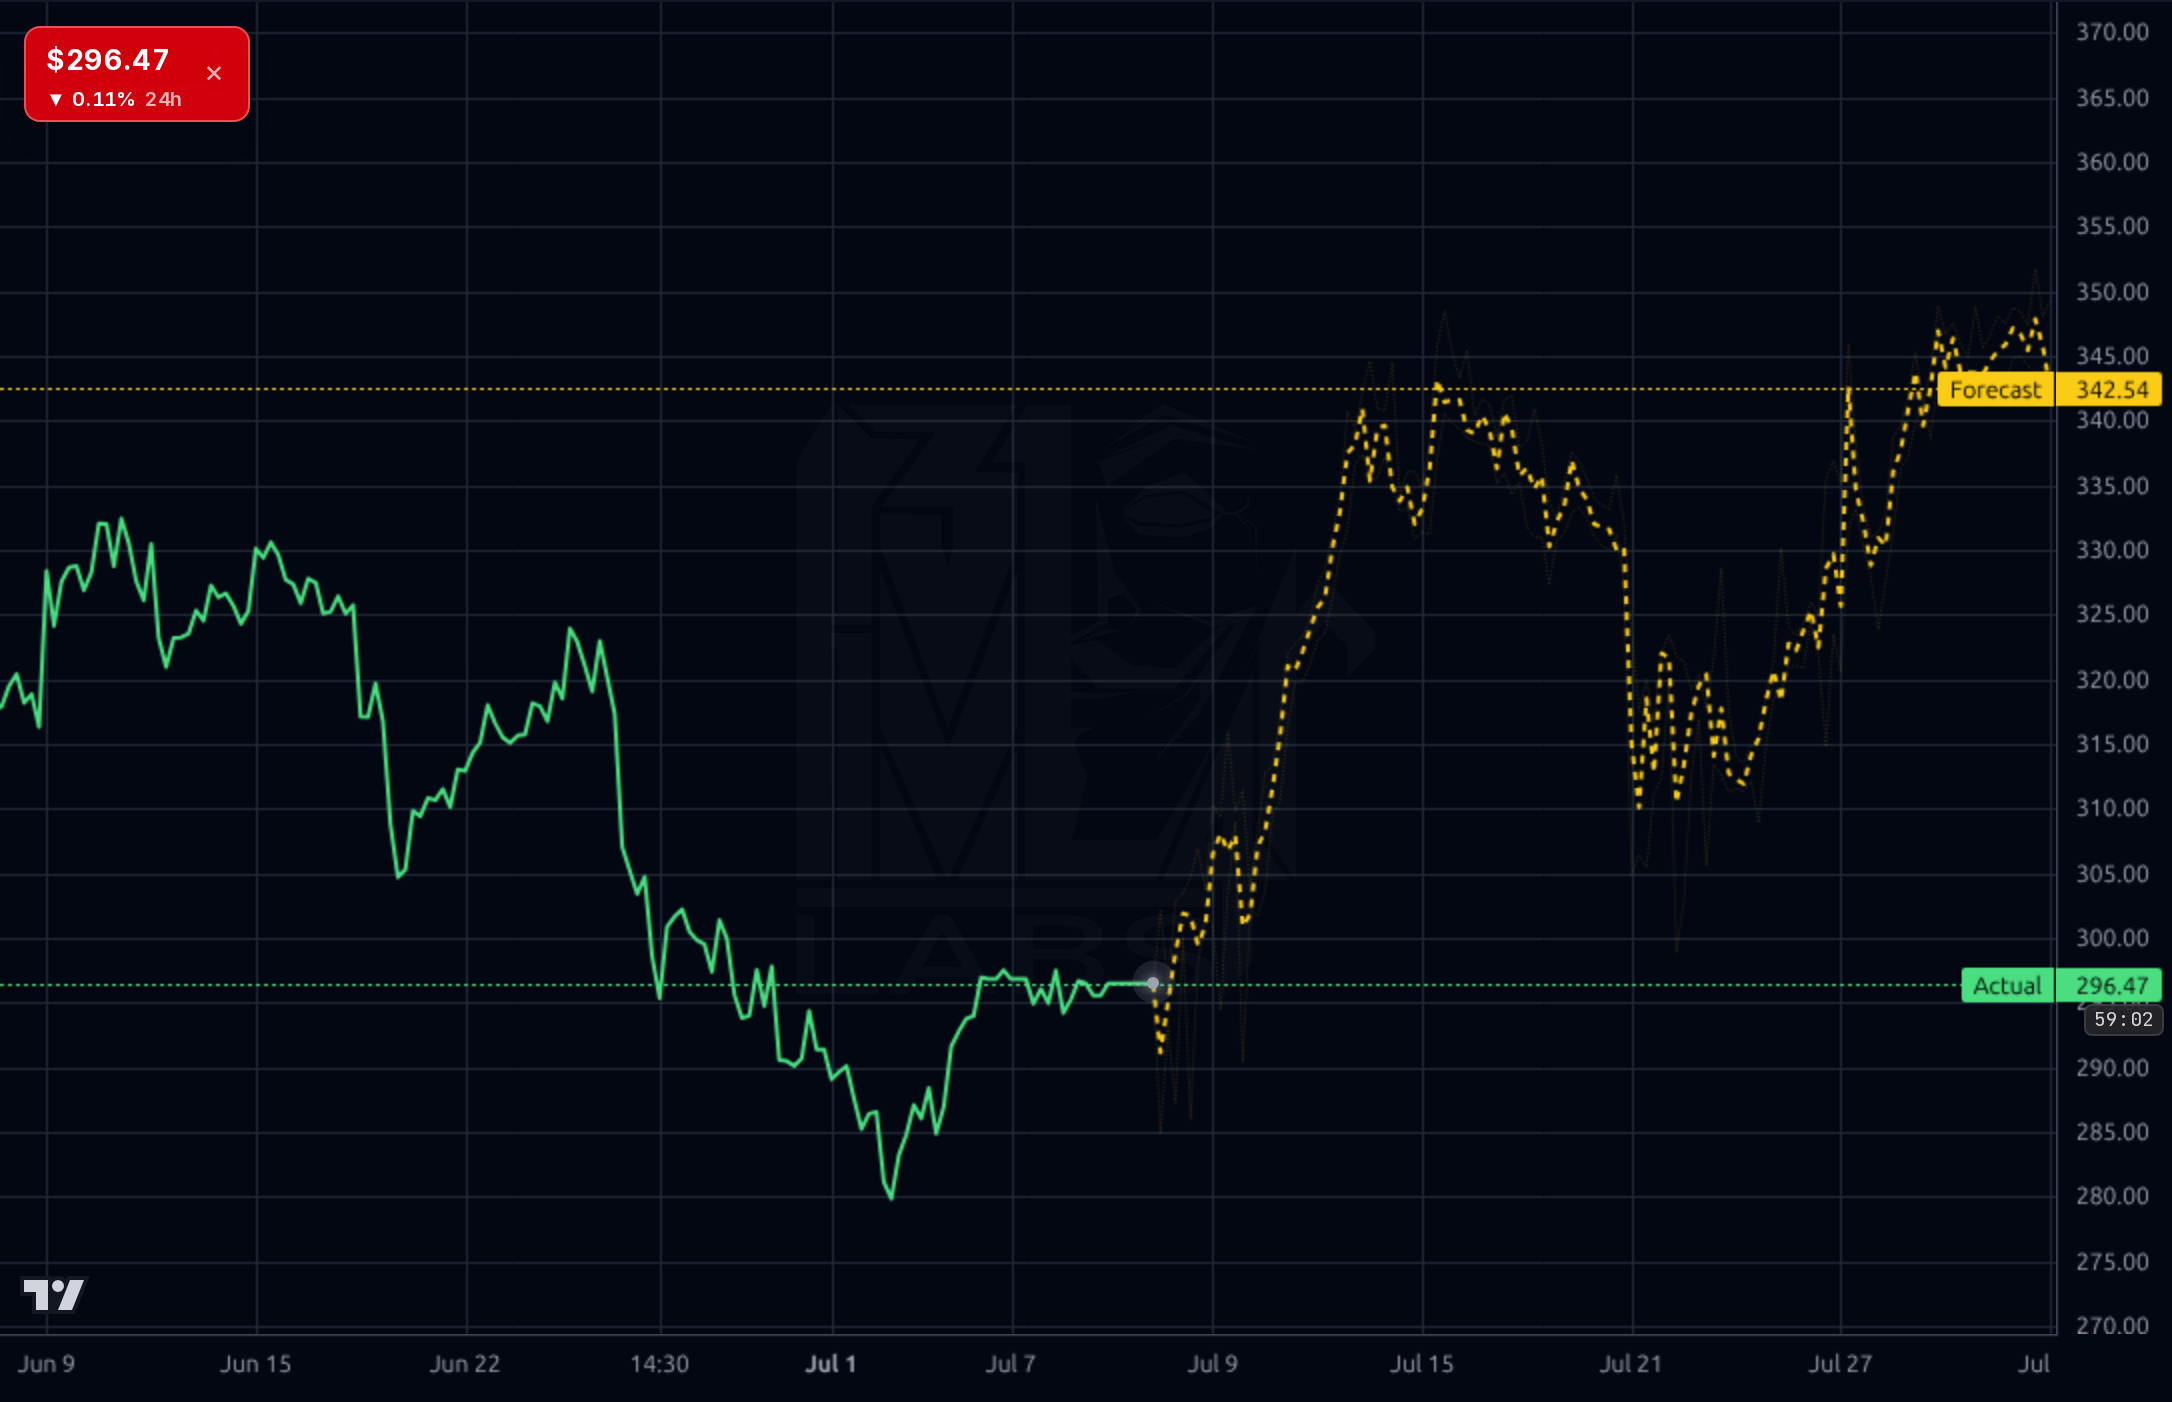
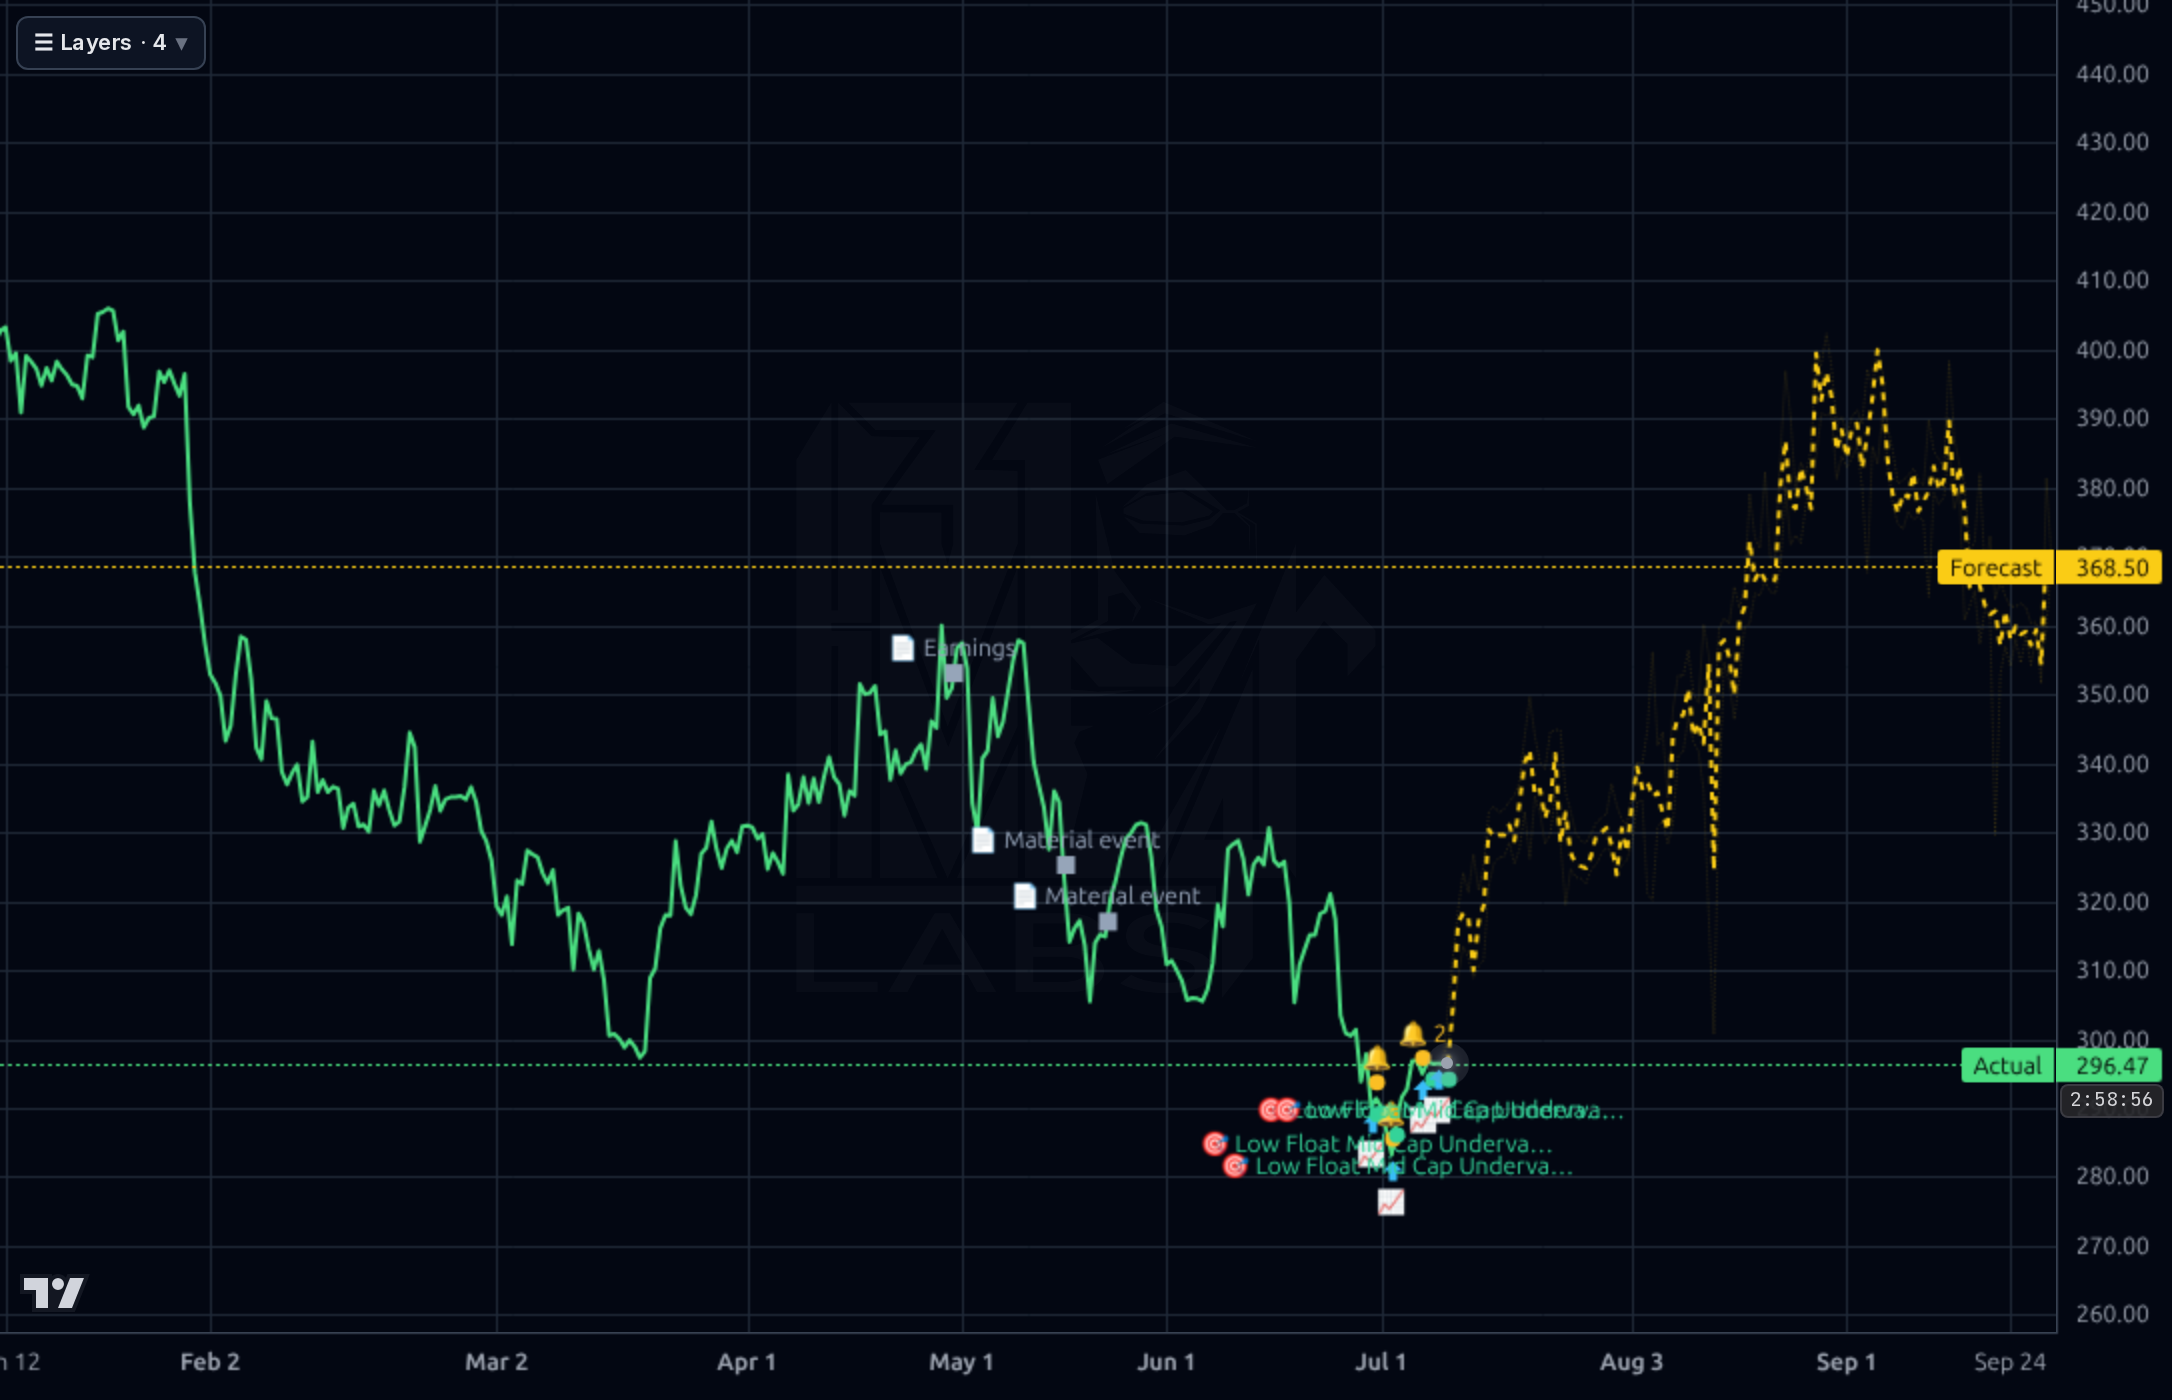
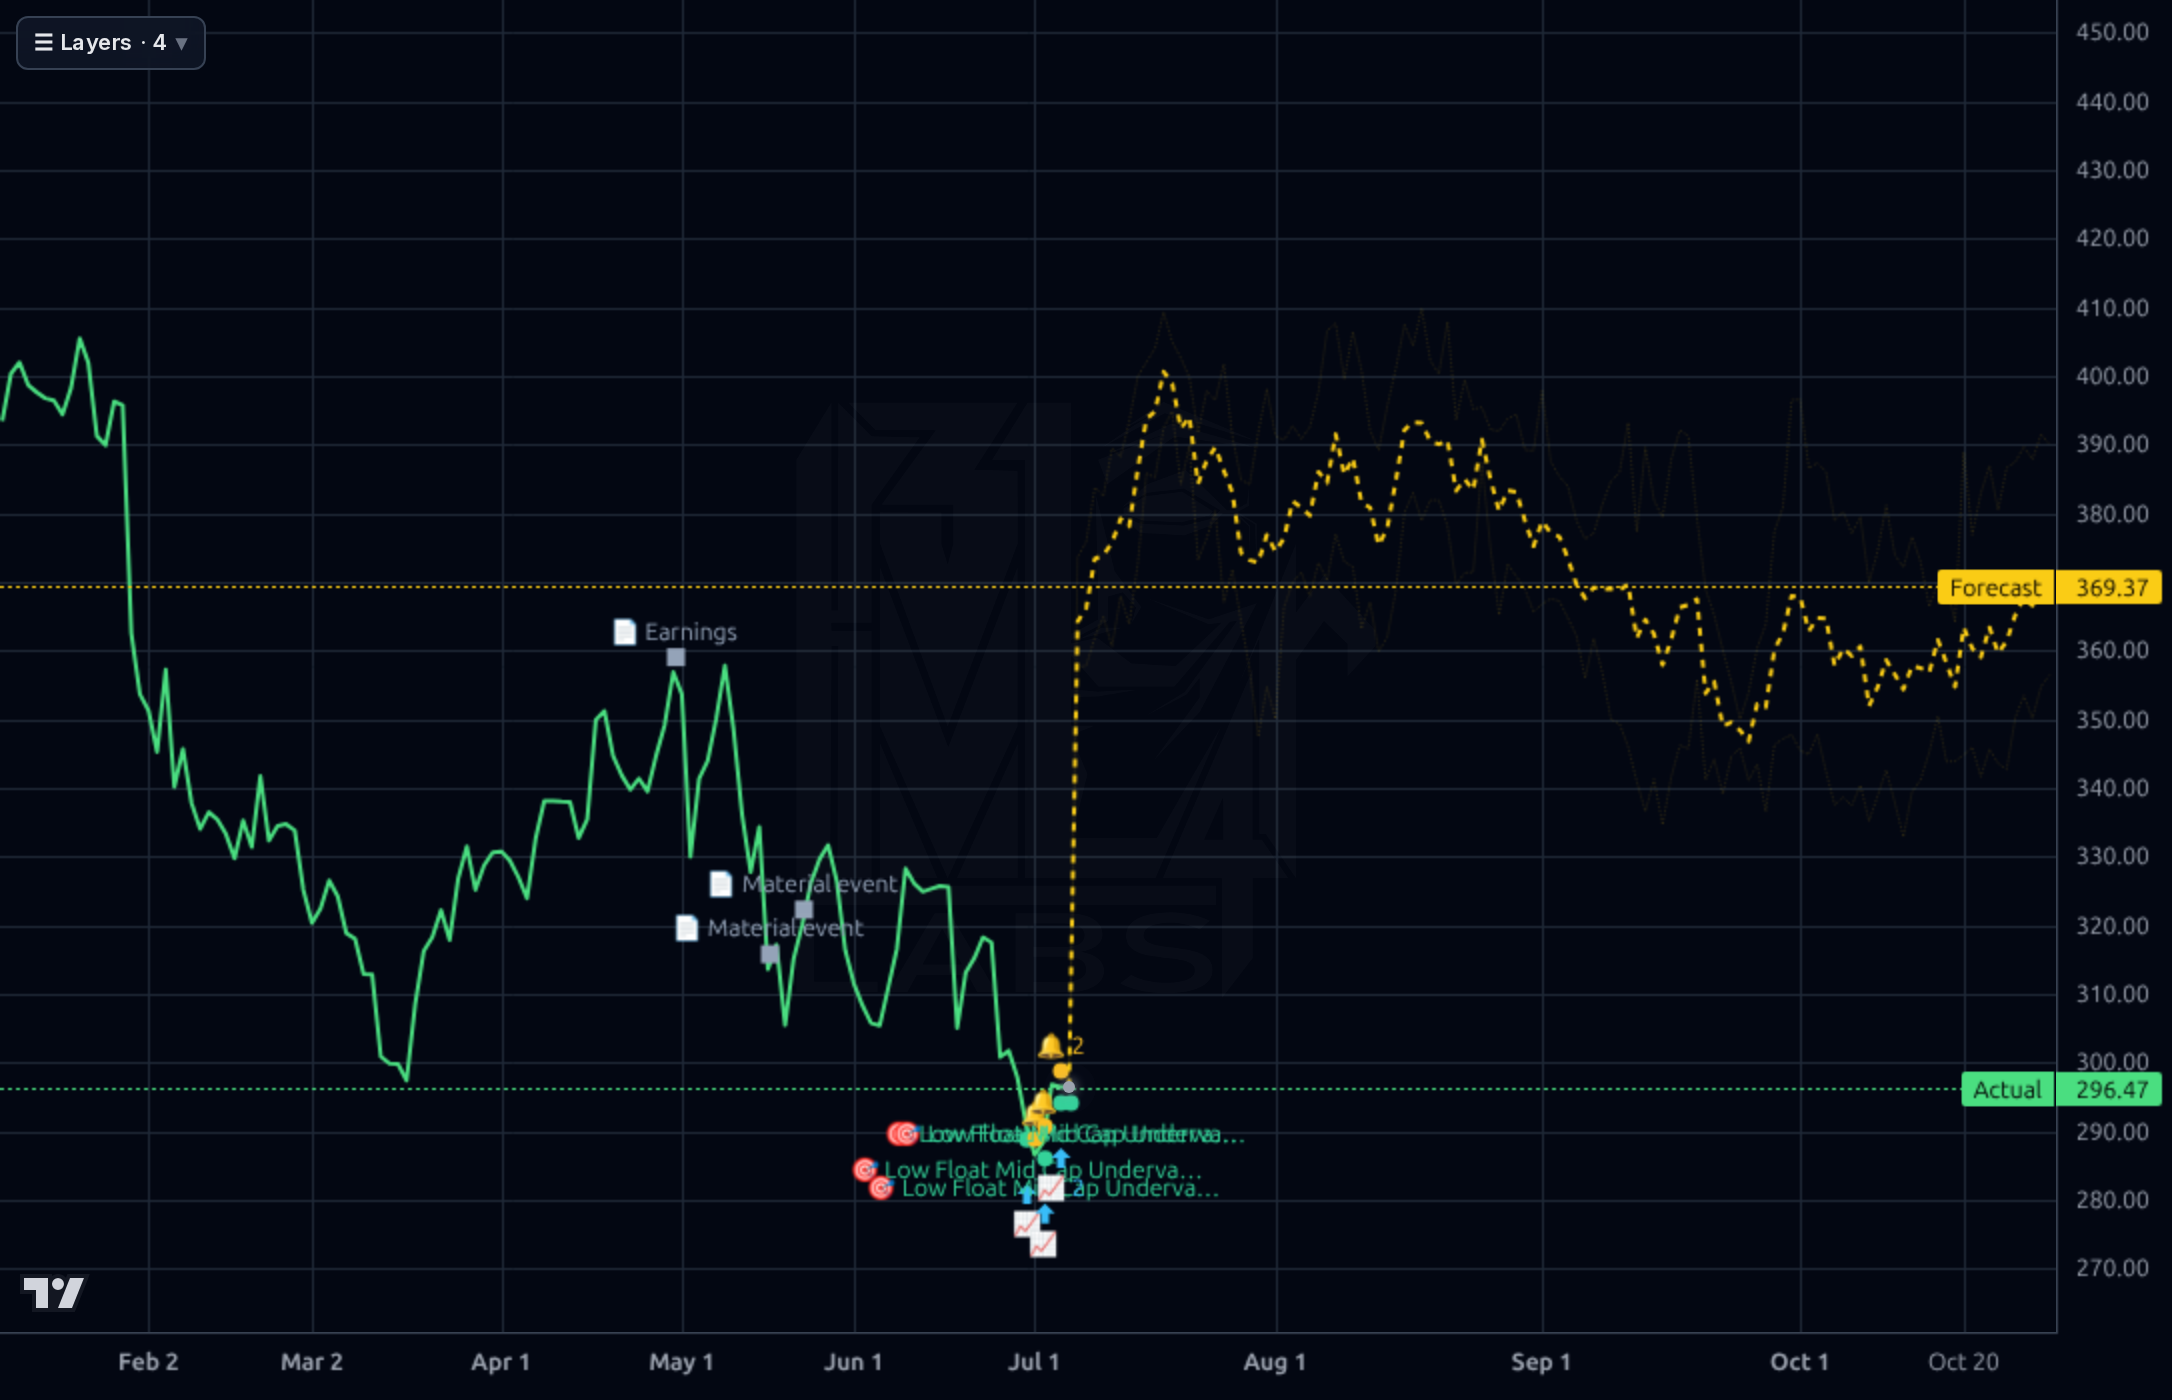
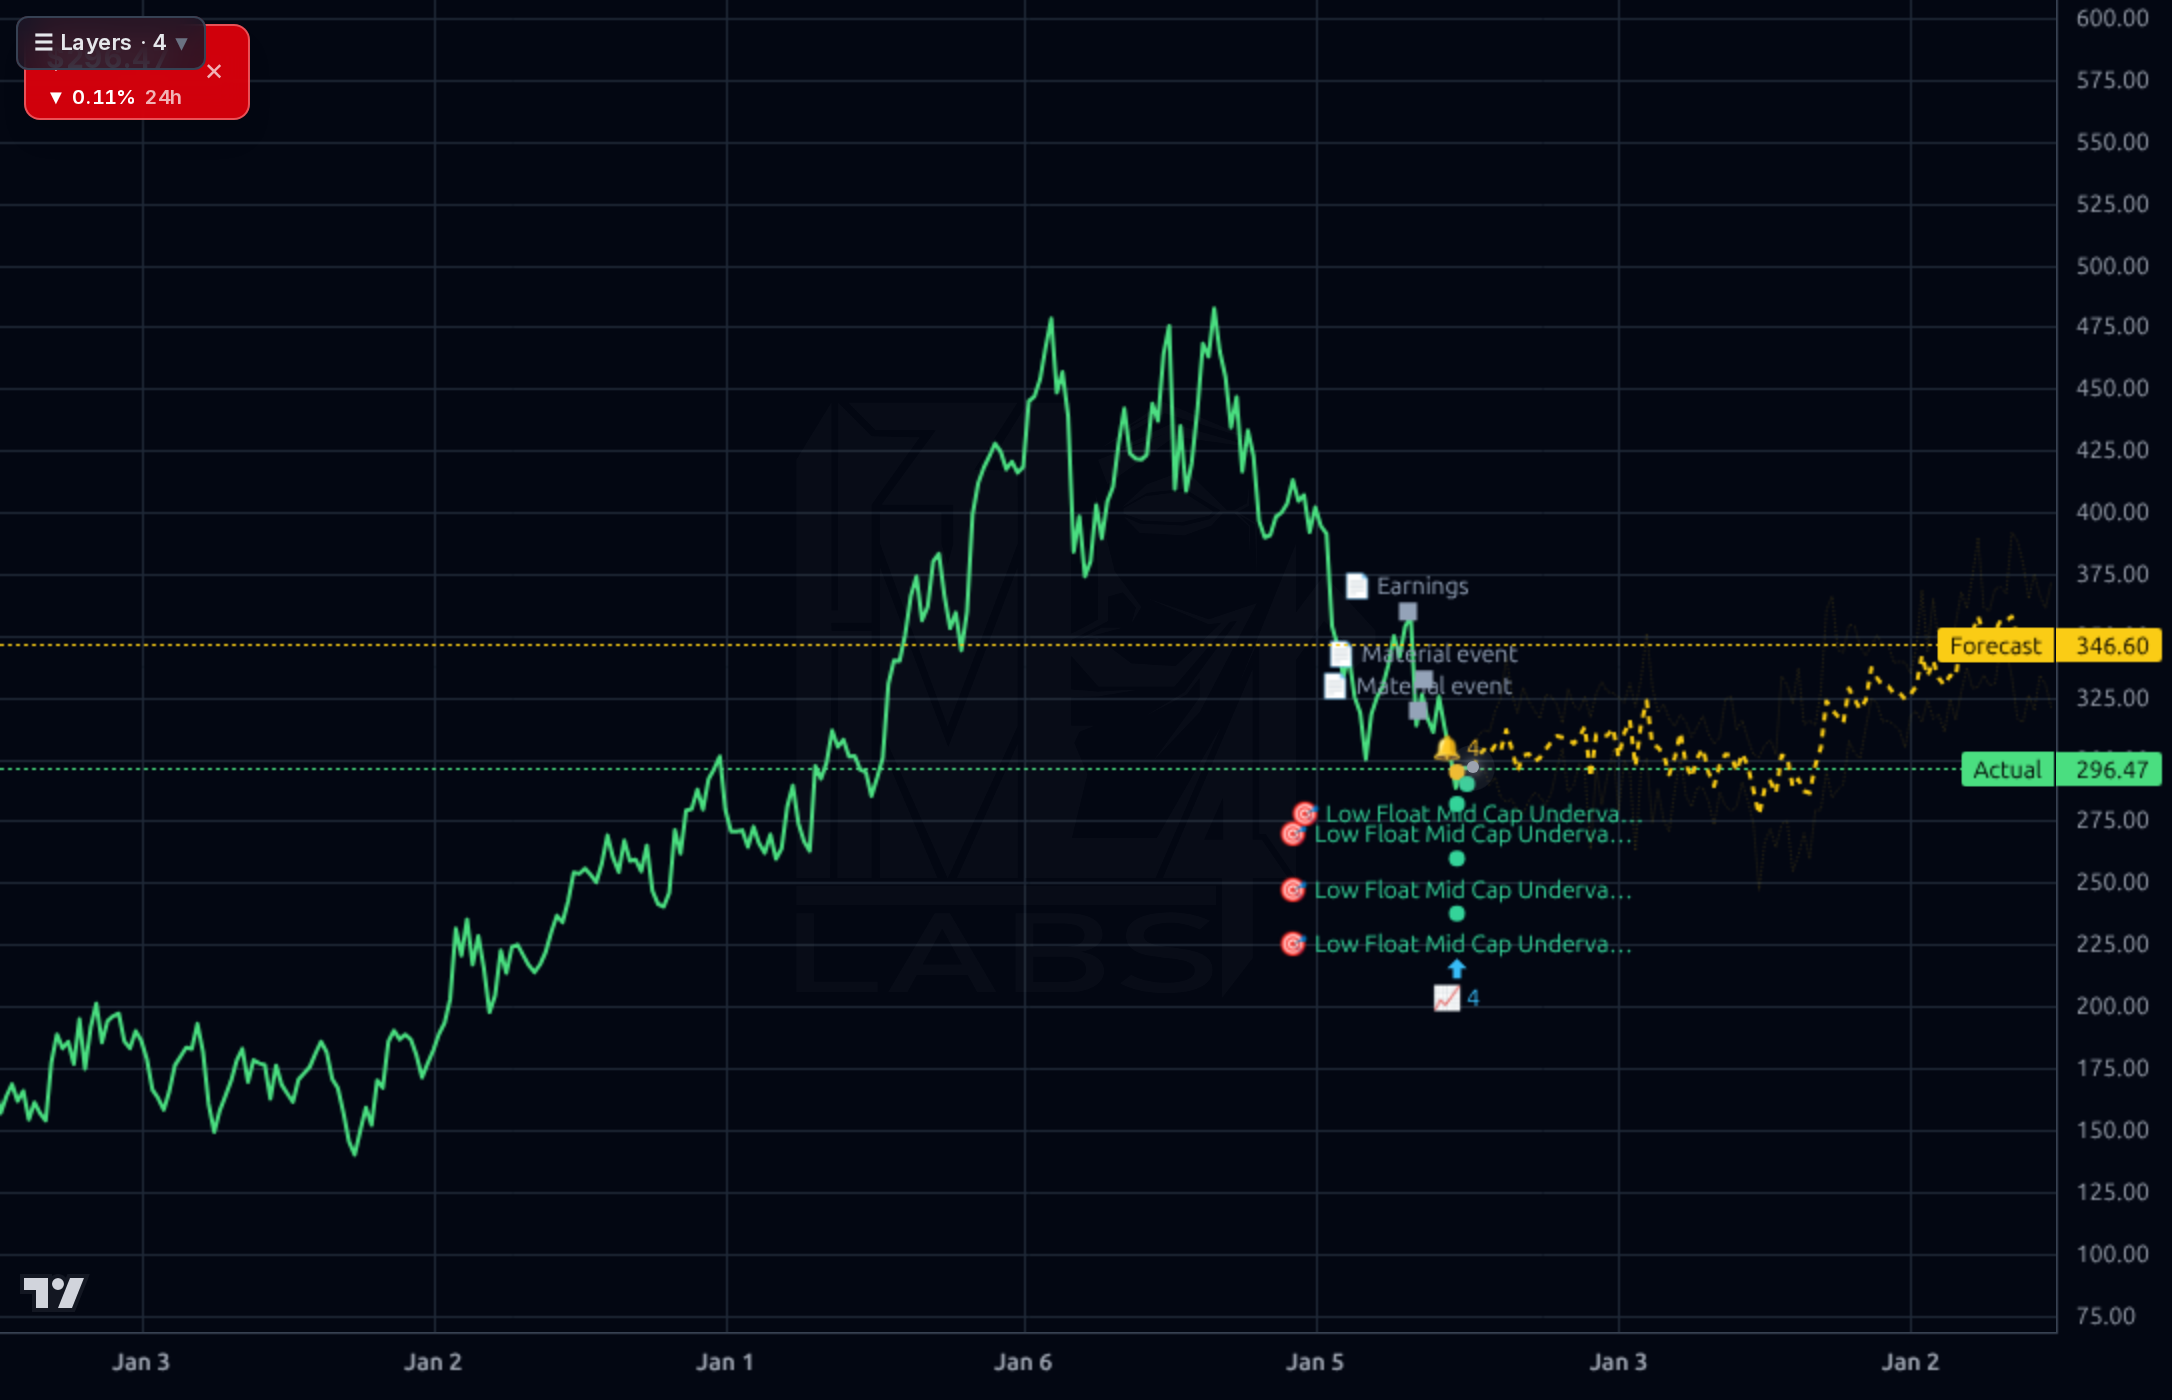
Avoid initiating new long positions until post-earnings guidance confirms a clear path to stabilizing FCF above $50M. Key immediate support/resistance levels are near the 12-month lows, but these are unreliable without news confirmation. Invalidation would be any negative commentary on working capital or debt structure.
The thesis remains highly speculative: if management can demonstrate a credible turnaround in FCF and operational efficiency (e.g., through successful rebranding execution), the valuation discount could play out over 6-12 months, targeting the higher end of analyst estimates ($375-$426). If cash flow guidance disappoints, expect continued downside pressure.
The long-term viability depends on successfully executing the nationwide rebranding and leveraging its large revenue base ($22.47B) to improve margins sustainably. The biggest structural risk is the inability to service existing debt load with improving operational cash flows.
The fundamental picture is deeply concerning despite the low Forward P/E of 6.3x. The most alarming metric is the Free Cash Flow collapse from $180M (Q2'25) to just $8.4M (Q1'26), signaling severe operational stress and poor working capital management, evidenced by a Current Ratio of 0.95. While revenue shows some positive momentum with Sales Y/Y TTM at 7.17%, the profitability metrics are weak, reflected in a Profit Margin of only 1.43%. The balance sheet is strained with high debt ($5.6B) relative to cash flow generation. Capital allocation visibility is low without management guidance.
Technically, the stock has been under significant pressure, trading near recent lows and showing negative momentum across multiple timeframes (e.g., SMA20 at -4.39%, Perf Year at -35.81%). The model's own directional accuracy for the 1-day horizon is very low (18% vs 82% baseline), suggesting caution regarding immediate technical bounces. Support appears to be forming near recent lows, but the primary driver remains fundamental news flow rather than momentum continuation.
The key narrative revolves around valuation arbitrage versus operational risk. While analysts note the stock is 'discounted' (e.g., 6.3x Fwd P/E) and has long-term historical returns (97.0% over 5 years), this ignores current structural issues. The removal from major Russell growth indexes adds a layer of index fund risk. Crucially, the market is awaiting the July 23rd earnings report to determine if management can credibly address the FCF collapse and high leverage.
- Successful execution of the nationwide Group 1 brand unification, which management expects will improve SG&A leverage.
- Capitalizing on pre-owned operations through strategic expansion and improved inventory flow.
- Severe deterioration of Free Cash Flow (FCF) from $180M to $8.4M, indicating immediate liquidity stress.
- High debt load ($5.6B) relative to current cash generation capacity.
- Binary risk associated with the upcoming earnings report; negative guidance will likely override any valuation discount.
Get AI analysis on any stock
This is one of hundreds of Kronos AI reports — scored fundamentals & technicals, bull/base/bear price targets, a multi-horizon plan, and continuously-updated forecasts across the market. Create a free account to explore them all.
Create your free account →Already a member? Sign in · Join our Discord