HURN— AI Stock Forecast & Price Targets
Published 7/6/2026 · A free sample of K3vl4r’s AI-powered analysis.
Kronos price forecasts, scored fundamentals & technicals, and a multi-horizon plan.
View the live HURN price forecast →
Huron trades at $97 (8.8x forward P/E, -48% YTD) with a stark disconnect between strong operational metrics (11.8% revenue growth, 23% ROE, analyst target $184) and a deteriorating balance sheet (D/E 2.24x, Q1 FCF swung to -$174M). The setup offers asymmetric mean-reversion potential but requires patience—technicals remain broken below the $100/$108 shelf, and prior calls have systematically over-shot on upside targets, so keep base expectations modest.
1-4 weeks: Neutral-to-constructive but no rush. Stock is basing at $95-97 with the $100 round number as the first hurdle. A close above $100 on volume opens $108 (prior shelf); failure at $100 likely retests $88-90. Wait for confirmation of the base with a reclaim of $100 before adding materially, or scale in tranches at $92-88 support. Invalidation: daily close below $84.80 (52w low) — that would signal the base is failing and open $75-78.
1-6 months: ACCUMULATE on weakness. The critical catalyst is the Q2'26 earnings print (early Aug) — the market needs to see the source of the Q1 debt jump (M&A vs. working capital), confirmation FCF reverses back positive, and gross margin recovers above 30%. If those box-checks hit, an 8.8x forward P/E on $10.22 forward EPS is unsustainably cheap for a 23% ROE consulting franchise — mean reversion to 11-12x is a reasonable 6-month target ($112-$122). Expected return range: -10% to +25%. What changes my mind: another quarter of debt build without clear M&A explanation, or gross margin failing to recover to 31%+.
1-3 years: The bull thesis rests on RelateCare integration (targeting $75M annual healthcare AI managed services revenue by 2027), recurring managed-services mix shift stabilizing cash flow, and continued double-digit growth in digital transformation consulting. If leverage normalizes to sub-1.5x D/E by 2028 and FCF re-accelerates to $150M+, the stock can re-rate to a mid-teens P/E on ~$14 EPS = $200+. Biggest structural risk is consulting cyclicality — if enterprise IT spending contracts materially in the next recession, the debt load becomes acutely problematic and dilutive equity raises become possible.
Top-line remains genuinely strong: TTM revenue $1.71B with Q1'26 at $452M (+11.8% Y/Y), Q/Q sales growth 11.78%, and consistent double-digit growth across the last four quarters. Profitability metrics look healthy on paper — ROE 23.3%, ROA 8.7%, trailing operating margin 9.3% — but there is real slippage: Q1'26 gross margin compressed to 30.0% from 33.0% in Q4'25, operating margin fell to 8.2% from 12.2%, and net income dropped to $23.2M from $30.7M sequentially. The balance sheet is the primary bear case: total debt jumped from $548M in Q4'25 to $887M in Q1'26 (+62% Q/Q), stockholders' equity fell from $529M to $397M, and D/E now sits at 2.24x. Q1'26 operating cash flow was -$162M and FCF -$174M — a sharp reversal from +$118M FCF in Q4'25, likely reflecting working capital seasonality plus the RelateCare deal, but the magnitude needs confirmation next print. Trailing FCF is still $97M, so the annual picture isn't broken, but leverage remediation is now the single most important variable for a multiple re-rate.
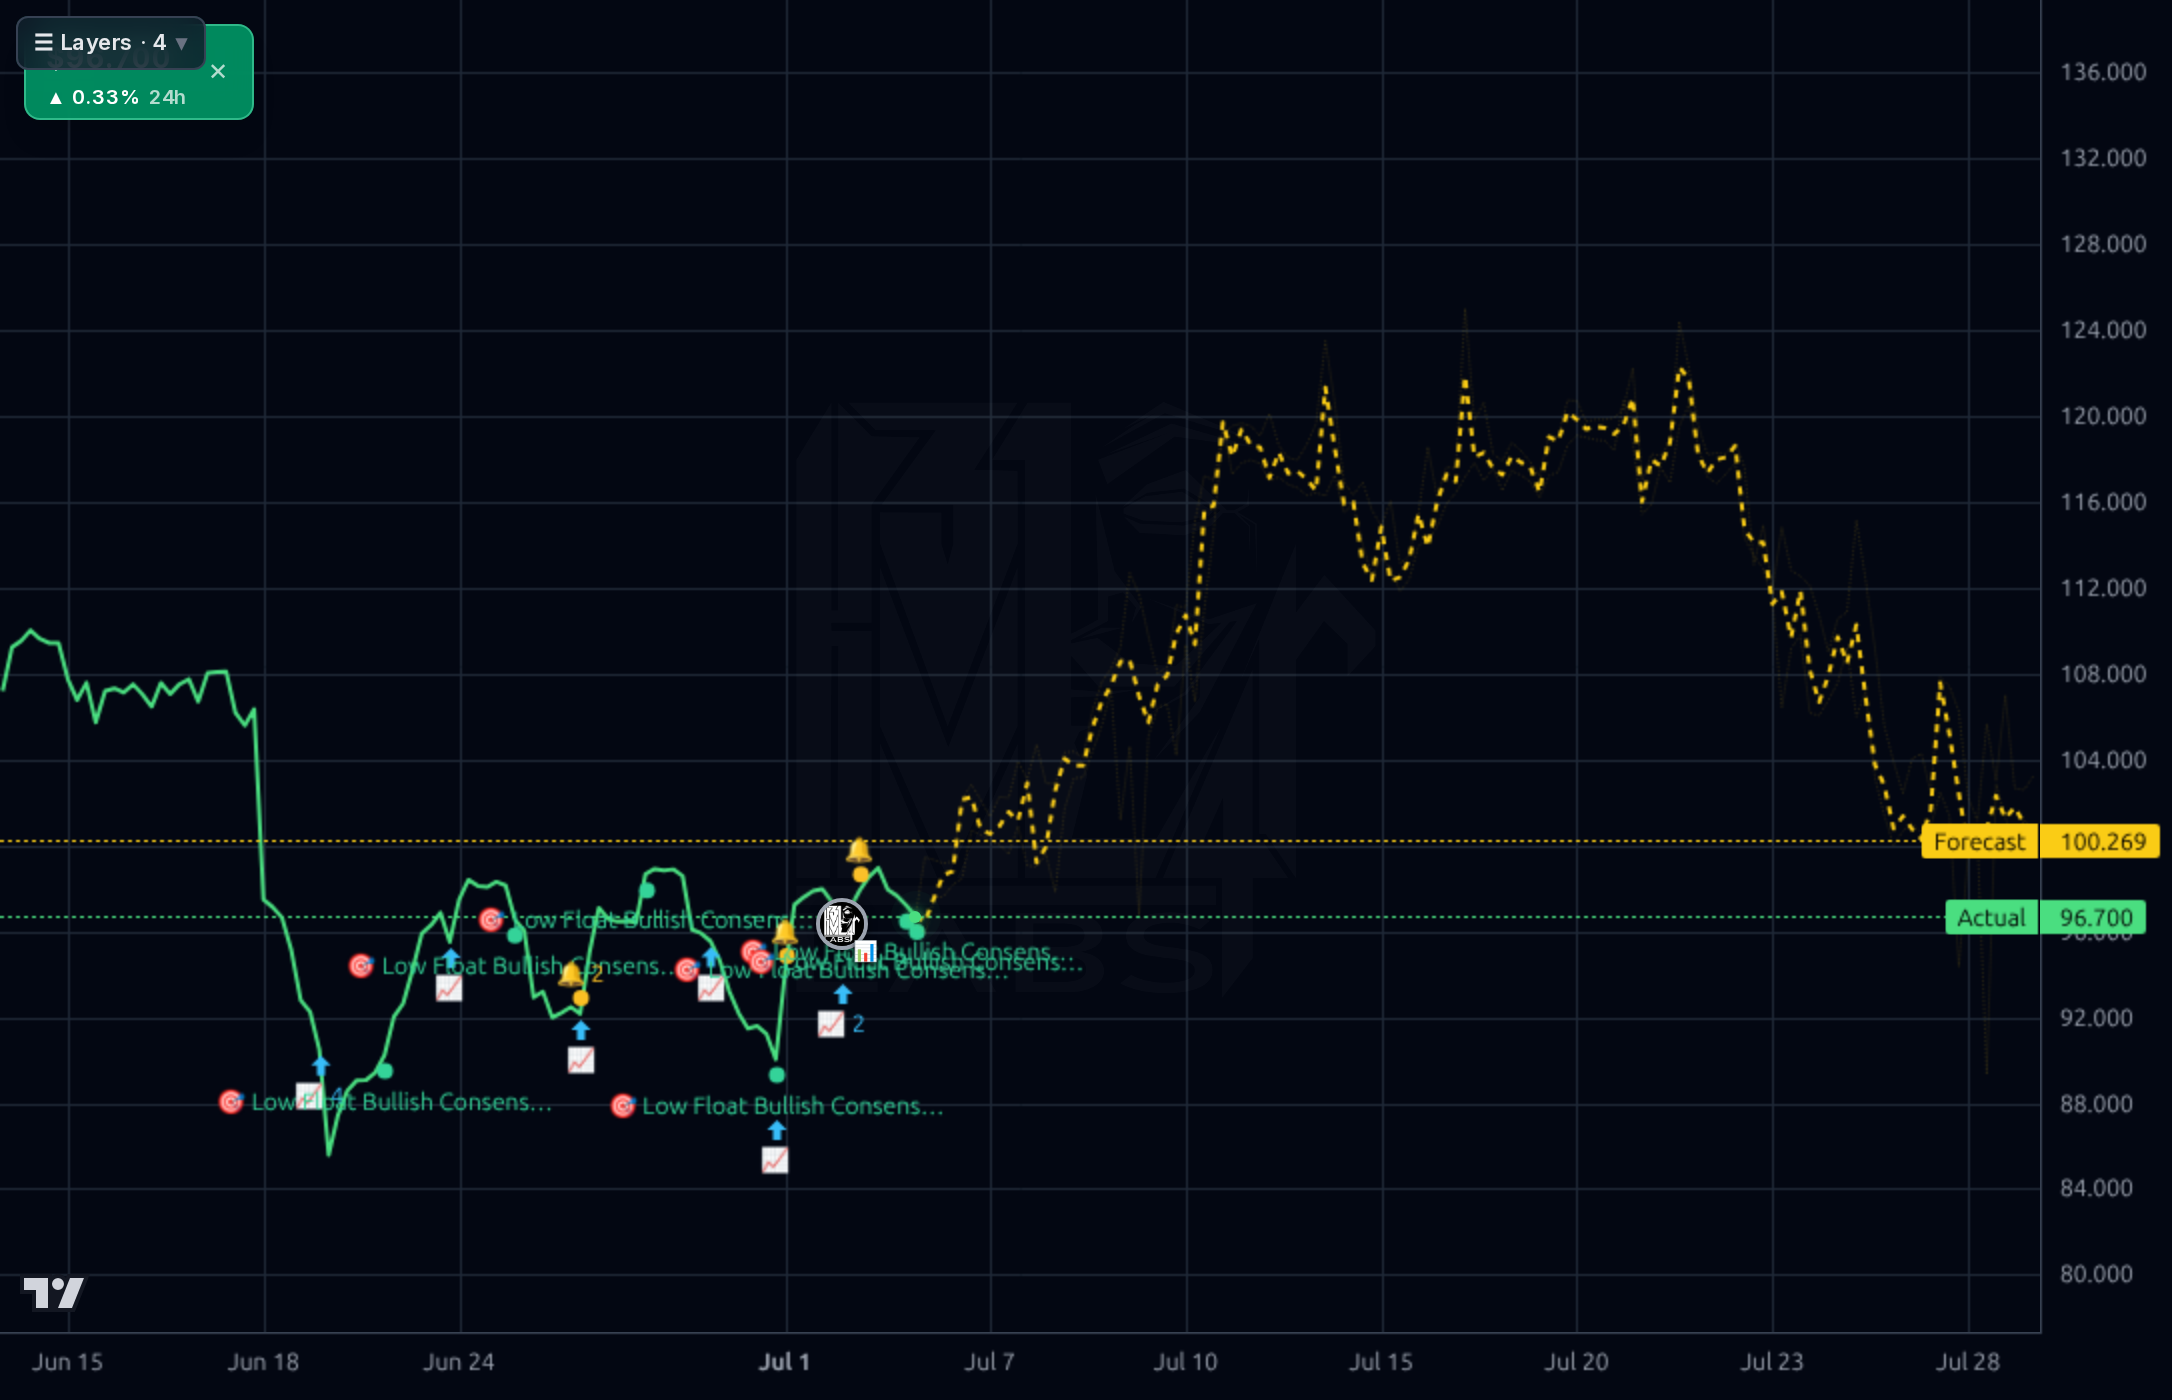
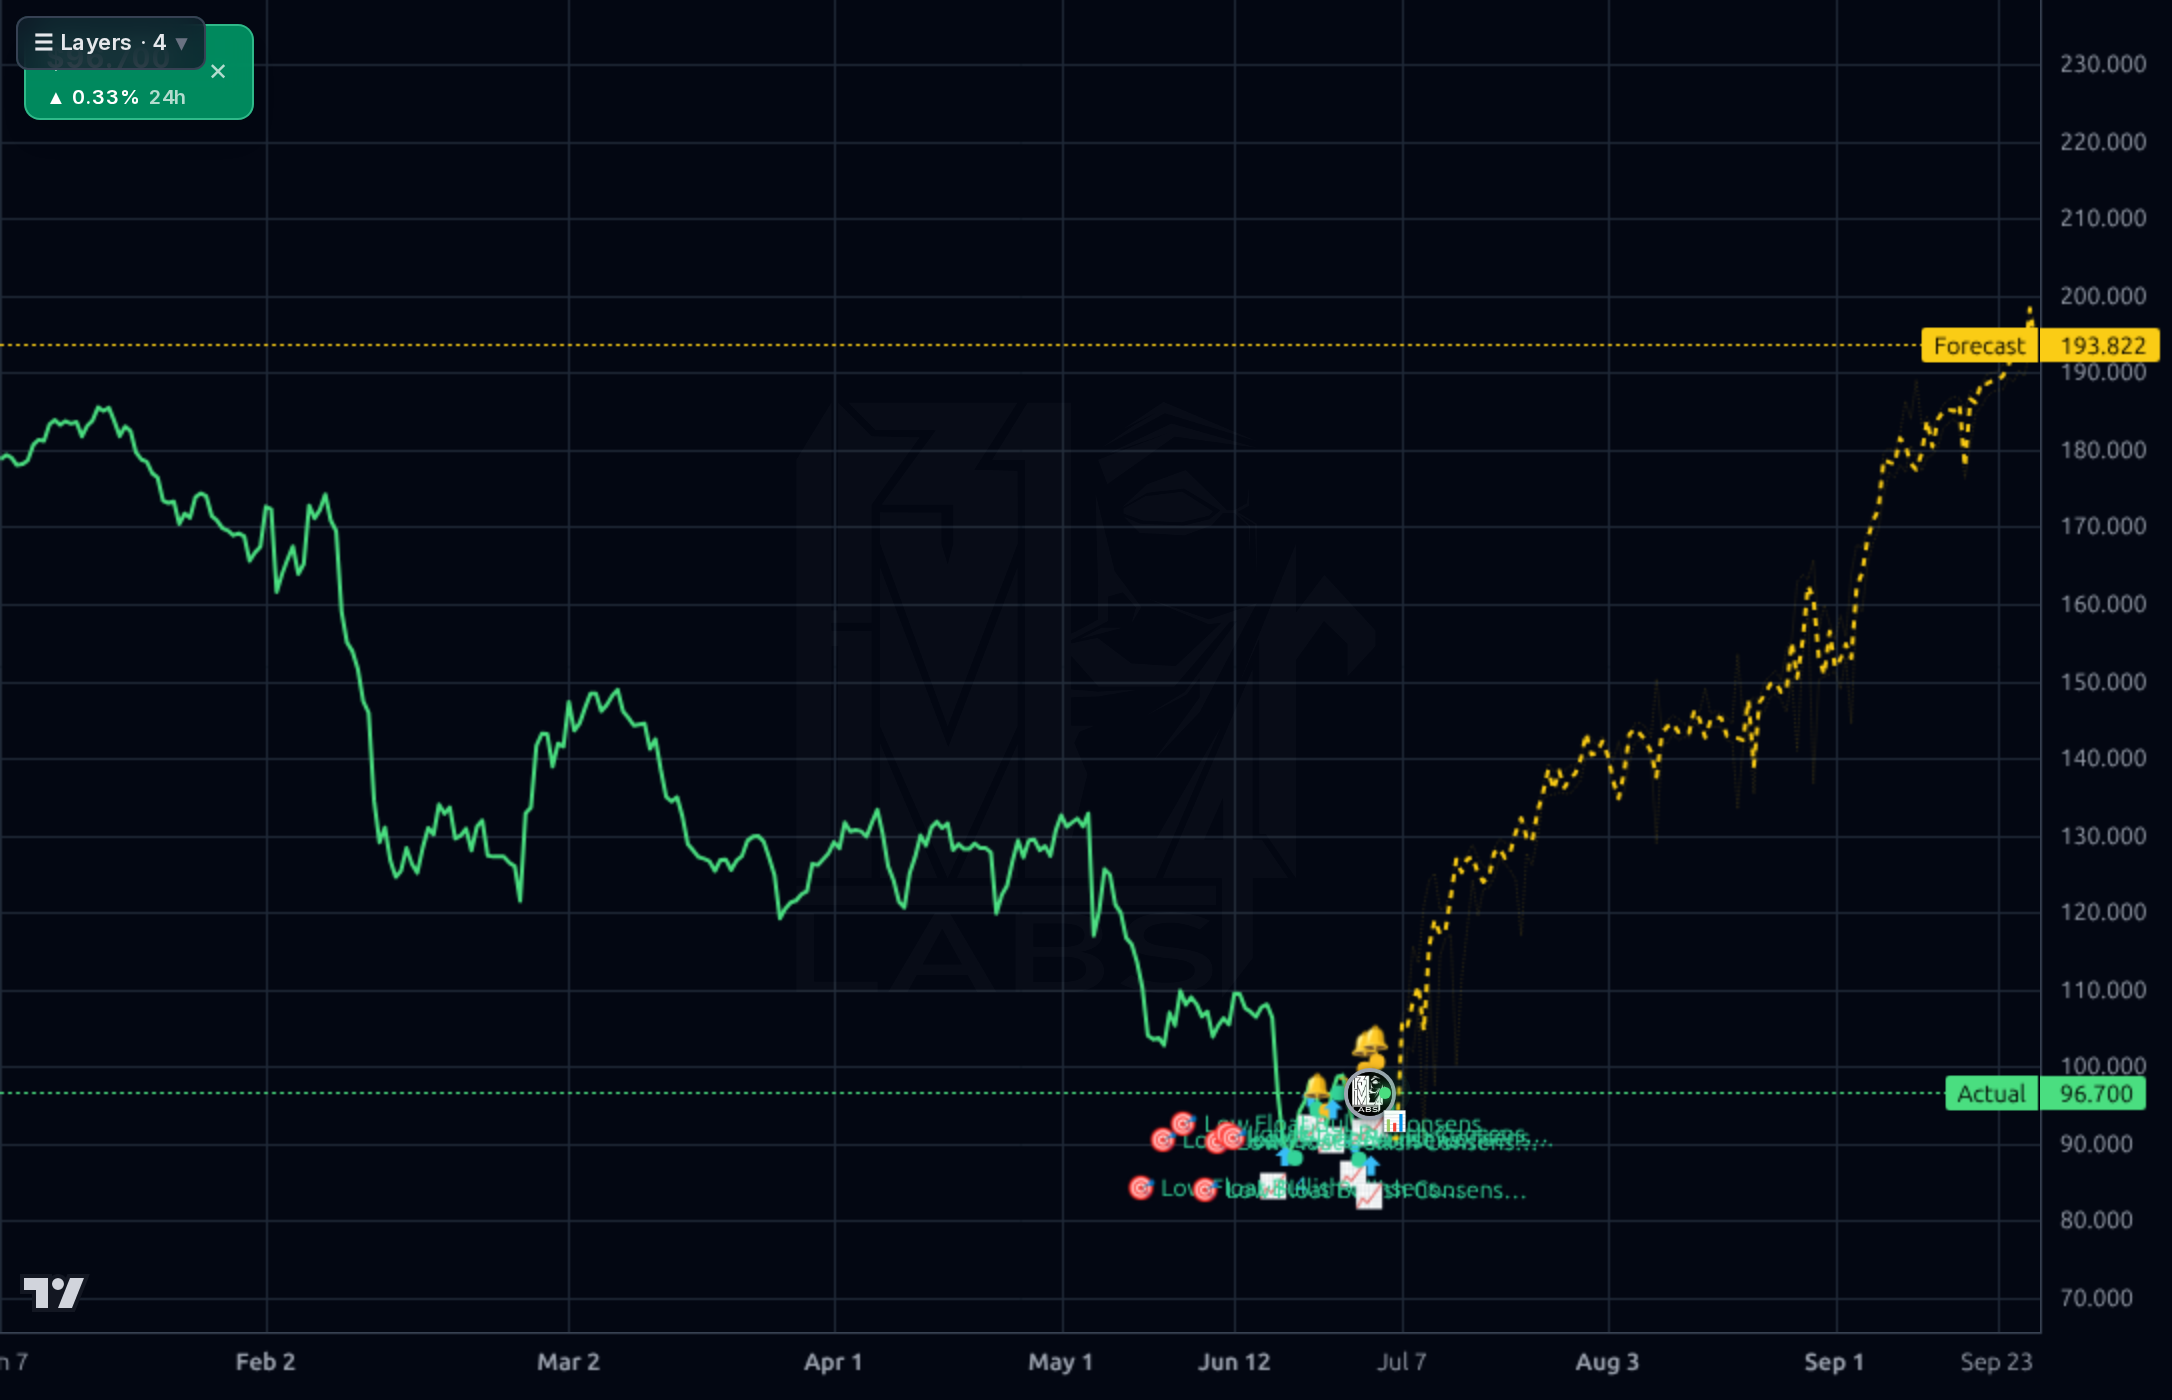
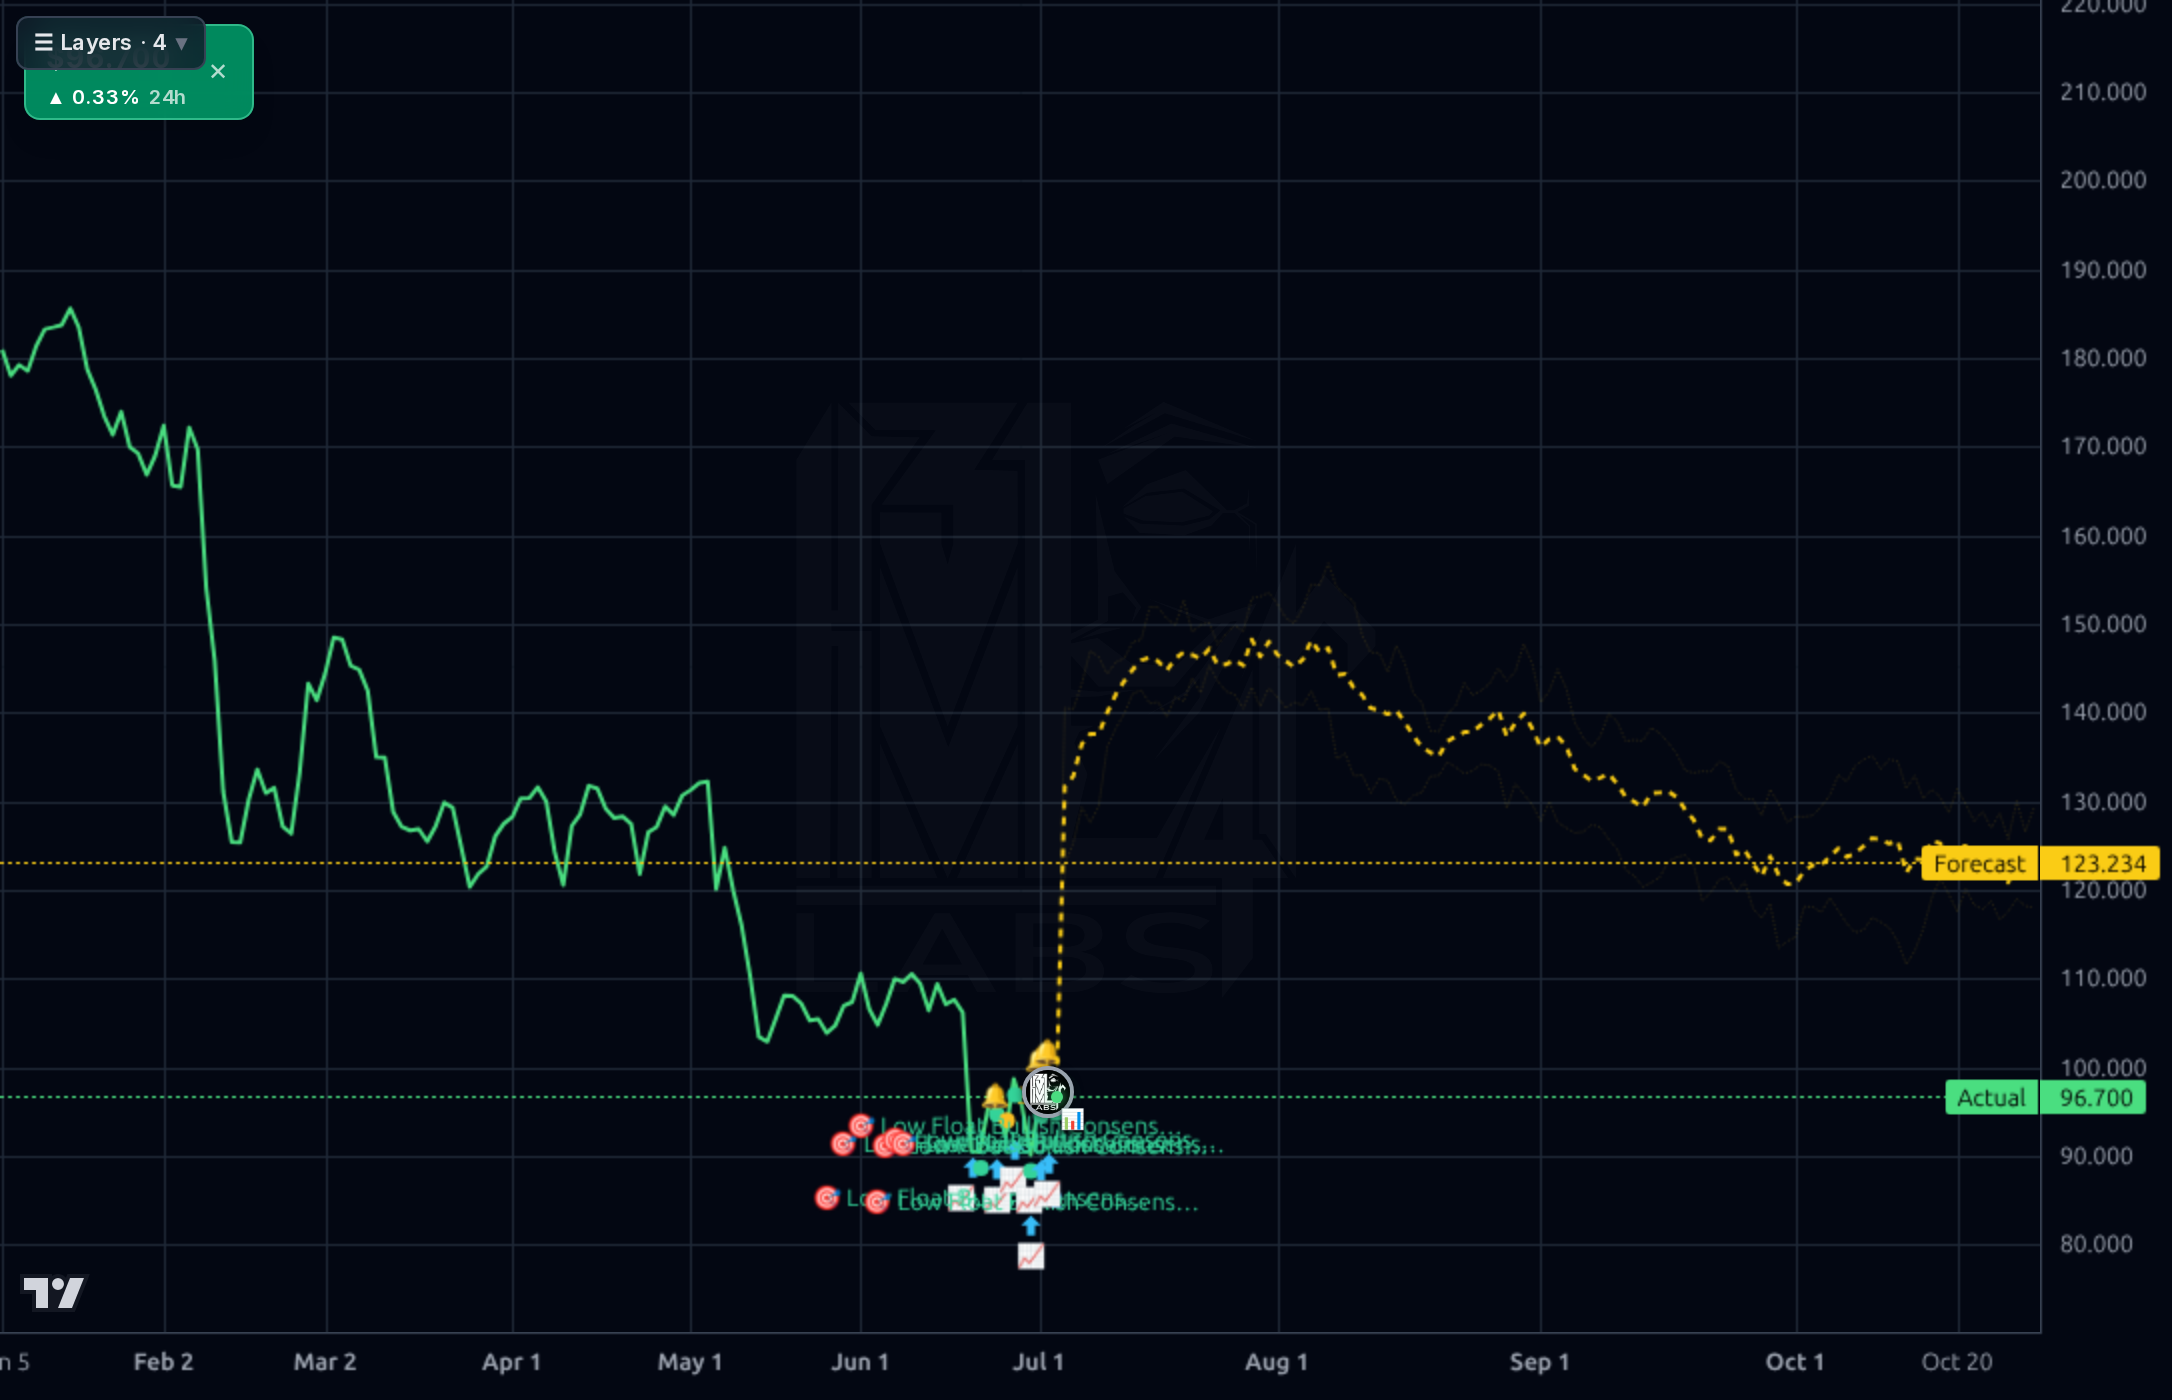
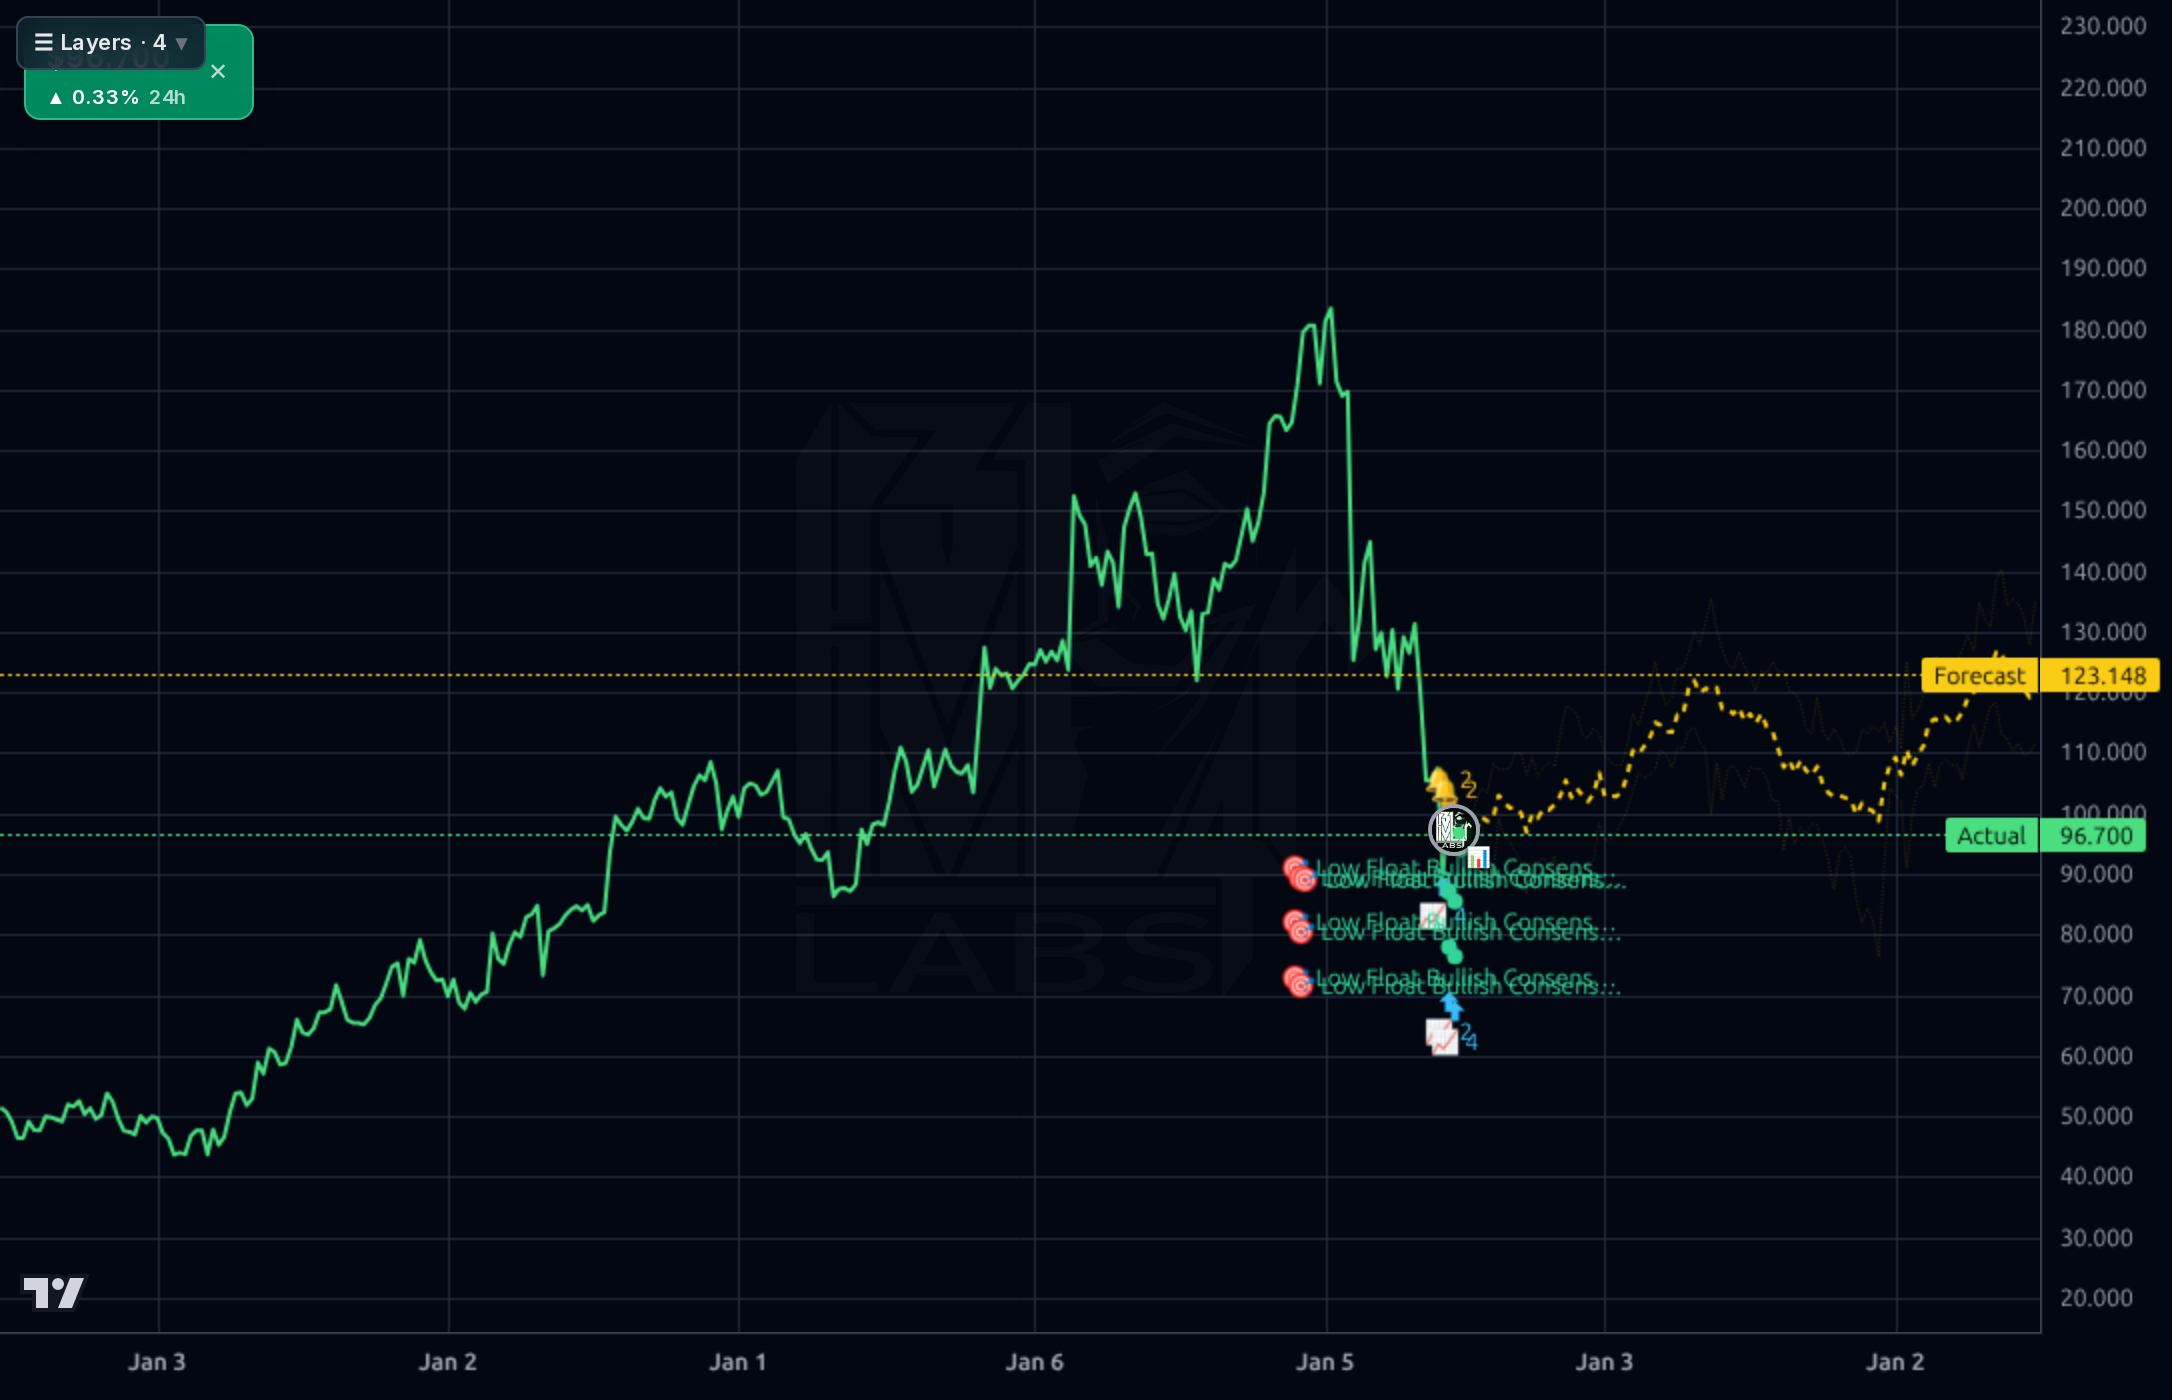
The stock is in a confirmed downtrend across all timeframes. Weekly chart shows a peak near $186 (early 2026) with a violent break down to the $85-97 zone — a ~48% drawdown. Daily and 4h charts show the stock trying to base between $85-$100 for the past 6 weeks; the 1h chart shows a modest recovery from $86 lows to $96.70, but momentum is weak (RSI 44.3, SMA20 -4.1%, SMA50 -11.6%, SMA200 -31.9%). The forecast band on 1h and 4h projects a move into the $115-120 zone, but the model's realized 1d directional accuracy is only 35% vs a 65% naive baseline — this forecast should be heavily discounted. Only the 1wk model has beat baseline (100% vs 67%), and it targets a much more modest $123 over the intermediate horizon. Structural resistance sits at $100 (round number + forecast line), then $108-$115 (prior consolidation shelf), then $130 (gap fill). Support is $85-88 (recent double-bottom); a break below $84.88 (52w low) opens $75-78.
News flow is mixed but net incrementally constructive. The 6/22 SEC 8-K flags an executive change (Item 5.02) — governance risk to monitor, but no material detail yet. StockStory (6/22) explicitly frames HURN as having 'explosive upside potential' at the 52-week low, and Zacks (6/29) noted a 7.1% single-day jump on above-average volume, suggesting the tape is starting to attract dip-buyers. Offsetting that, an insider sale of 1,800+ shares by a director (6/30) and Truist cutting its price target from $240 to $155 (though maintaining Buy) confirm that sell-side is resetting expectations lower even while staying constructive. Consensus analyst target is $184.25 (Recom 1.00 = strong buy) — a 90% implied upside that looks aspirational given calibration data showing bull targets have systematically failed to print on this name.
- RelateCare integration targeting ~$75M annual healthcare AI-enabled managed services revenue by 2027
- Q/Q revenue growth of 11.78% sustained across four consecutive quarters — top-line momentum intact
- Digital services expansion into EHR, ERP, and AI/automation for research-intensive institutions (proprietary Huron Research software suite)
- Managed services / outsourcing mix shift toward recurring revenue that should stabilize the cash flow profile over 2-3 years
- Forward EPS growth: $10.22 forward vs $5.85 trailing implies management/street expects 75%+ EPS acceleration
- Total debt jumped 62% Q/Q to $887M in Q1'26 with stockholders' equity contracting — leverage now 2.24x D/E
- Q1'26 free cash flow of -$174M is a sharp reversal from +$118M in Q4'25 — needs immediate confirmation of reversion
- Gross margin compressed 300bps sequentially (33.0% → 30.0%) — signals mix or cost pressure
- Executive change disclosed 6/22 8-K adds governance uncertainty at a critical operational moment
- Sell-side price target cuts (Truist $240 → $155) show even bulls are resetting — consensus $184 target has calibration risk
- Consulting cyclicality — enterprise IT spending slowdown would compound the balance sheet stress
- Prior bull targets on this name have systematically failed to print; upside expectations must be moderated
Get AI analysis on any stock
This is one of hundreds of Kronos AI reports — scored fundamentals & technicals, bull/base/bear price targets, a multi-horizon plan, and continuously-updated forecasts across the market. Create a free account to explore them all.
Create your free account →Already a member? Sign in · Join our Discord