HURN— AI Stock Forecast & Price Targets
Published 7/1/2026 · A free sample of K3vl4r’s AI-powered analysis.
Kronos price forecasts, scored fundamentals & technicals, and a multi-horizon plan.
View the live HURN price forecast →
Huron has been cut in half from its early-2026 peak of ~$186 to $90, trading at 8.8x forward EPS despite double-digit revenue growth and 23% ROE — a valuation reset that reflects genuine concerns (debt/equity 2.24x, Q1 FCF swung to -$174M, YTD -48%) rather than mispricing alone. The setup offers asymmetric mean-reversion potential given depressed multiple and $184 sell-side target, but the trend is broken (price -37% vs 200SMA, RSI 35, fresh 52-week lows) and the forecast model has been unreliable, so this is a patient accumulation, not a chase.
Trend is down and 52-week low was just violated intraday (price -5.6% today on 1.97x relative volume). Do not chase. If already long, hold with a stop below $84 (52w low). For new entries, wait for either (a) a reclaim of $95-97 on volume to confirm short-term bottom, or (b) a capitulation flush to $80-82 where risk/reward improves. Small starter positions (25% of intended size) acceptable at $88-90 given oversold RSI and depressed forward multiple. Invalidation: weekly close below $82.
Over 3-6 months, base case is a grind-back to $105-115 as tax-loss selling exhausts and Q2 earnings (August) either confirm the growth story or crystallize the bear case. The 8.8x forward P/E is genuinely cheap for a 12% top-line grower with 23% ROE if leverage stabilizes. Catalysts: Q2 print, evidence FCF normalizes in Q2/Q3 after the Q1 -$174M drain, any debt paydown commentary. Change my mind: another quarter of margin compression, further debt increase, or organic growth decelerating below 8%.
1-3 year thesis is that Huron's positioning in healthcare consulting + AI-enabled managed services (RelateCare, digital) is genuinely differentiated in a fragmented consulting market, and normalized earnings power of $10-12/share supports a $130-160 valuation at a reasonable 13-15x multiple. Structural risk is the balance sheet: at 2.24x D/E with rates elevated, one recession or client-spending downturn could force dilutive capital raises. Consulting is cyclical and back-loaded to enterprise budgets — a 2027 corporate spending pullback is the biggest terminal risk.
Revenue growth remains healthy — Q1 2026 revenue of $451.8M was +11.8% YoY and quarterly revenue has climbed steadily from $411.8M (Q2'25) to $451.8M, with TTM sales of $1.71B. However, margin trajectory is deteriorating: Q1'26 gross margin compressed to 30.0% from 32.5–33.0% in prior quarters, operating margin fell to 8.2% from ~12% in H2'25, and net income of $23.2M was the weakest print in the trailing four quarters. The balance sheet is the real problem: total debt jumped to $887M in Q1'26 from $548M at year-end 2025, driving debt/equity to 2.24x, while stockholders' equity fell from $529M to $397M — suggesting aggressive buybacks or acquisition-funded leverage. Q1 operating cash flow was -$162M vs +$126M in Q4'25, likely seasonal working capital but severe in magnitude. TTM FCF is still positive at $97M and ROE remains a respectable 23%, but with 15.4x trailing P/E collapsing to 8.8x forward, the market is pricing in either earnings risk or refusing to underwrite the leverage.
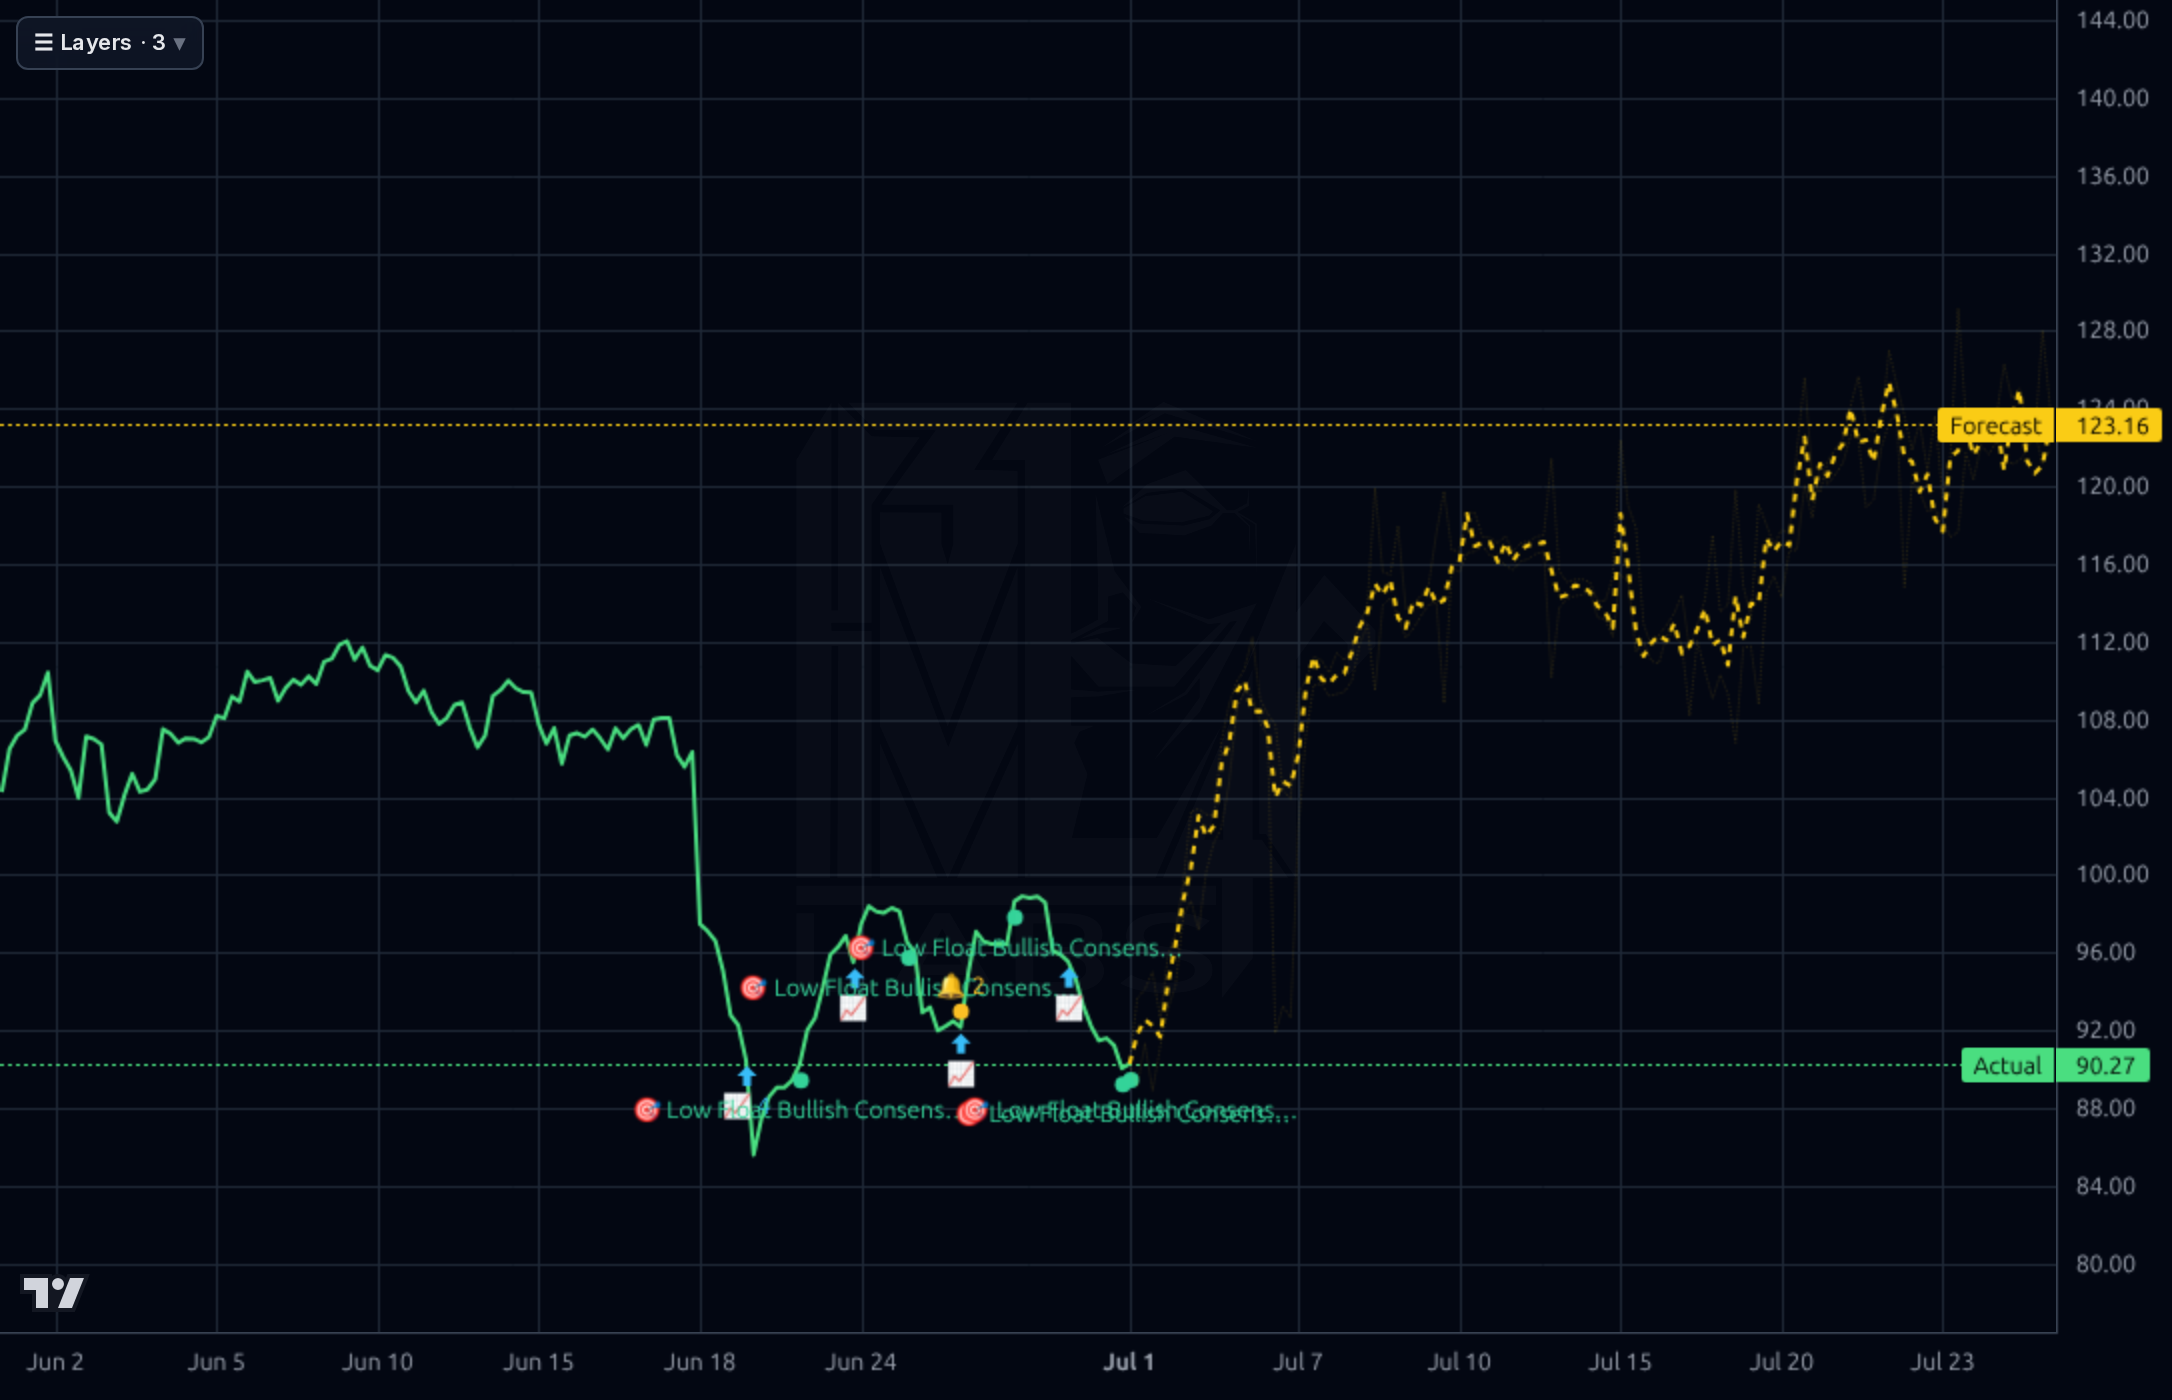
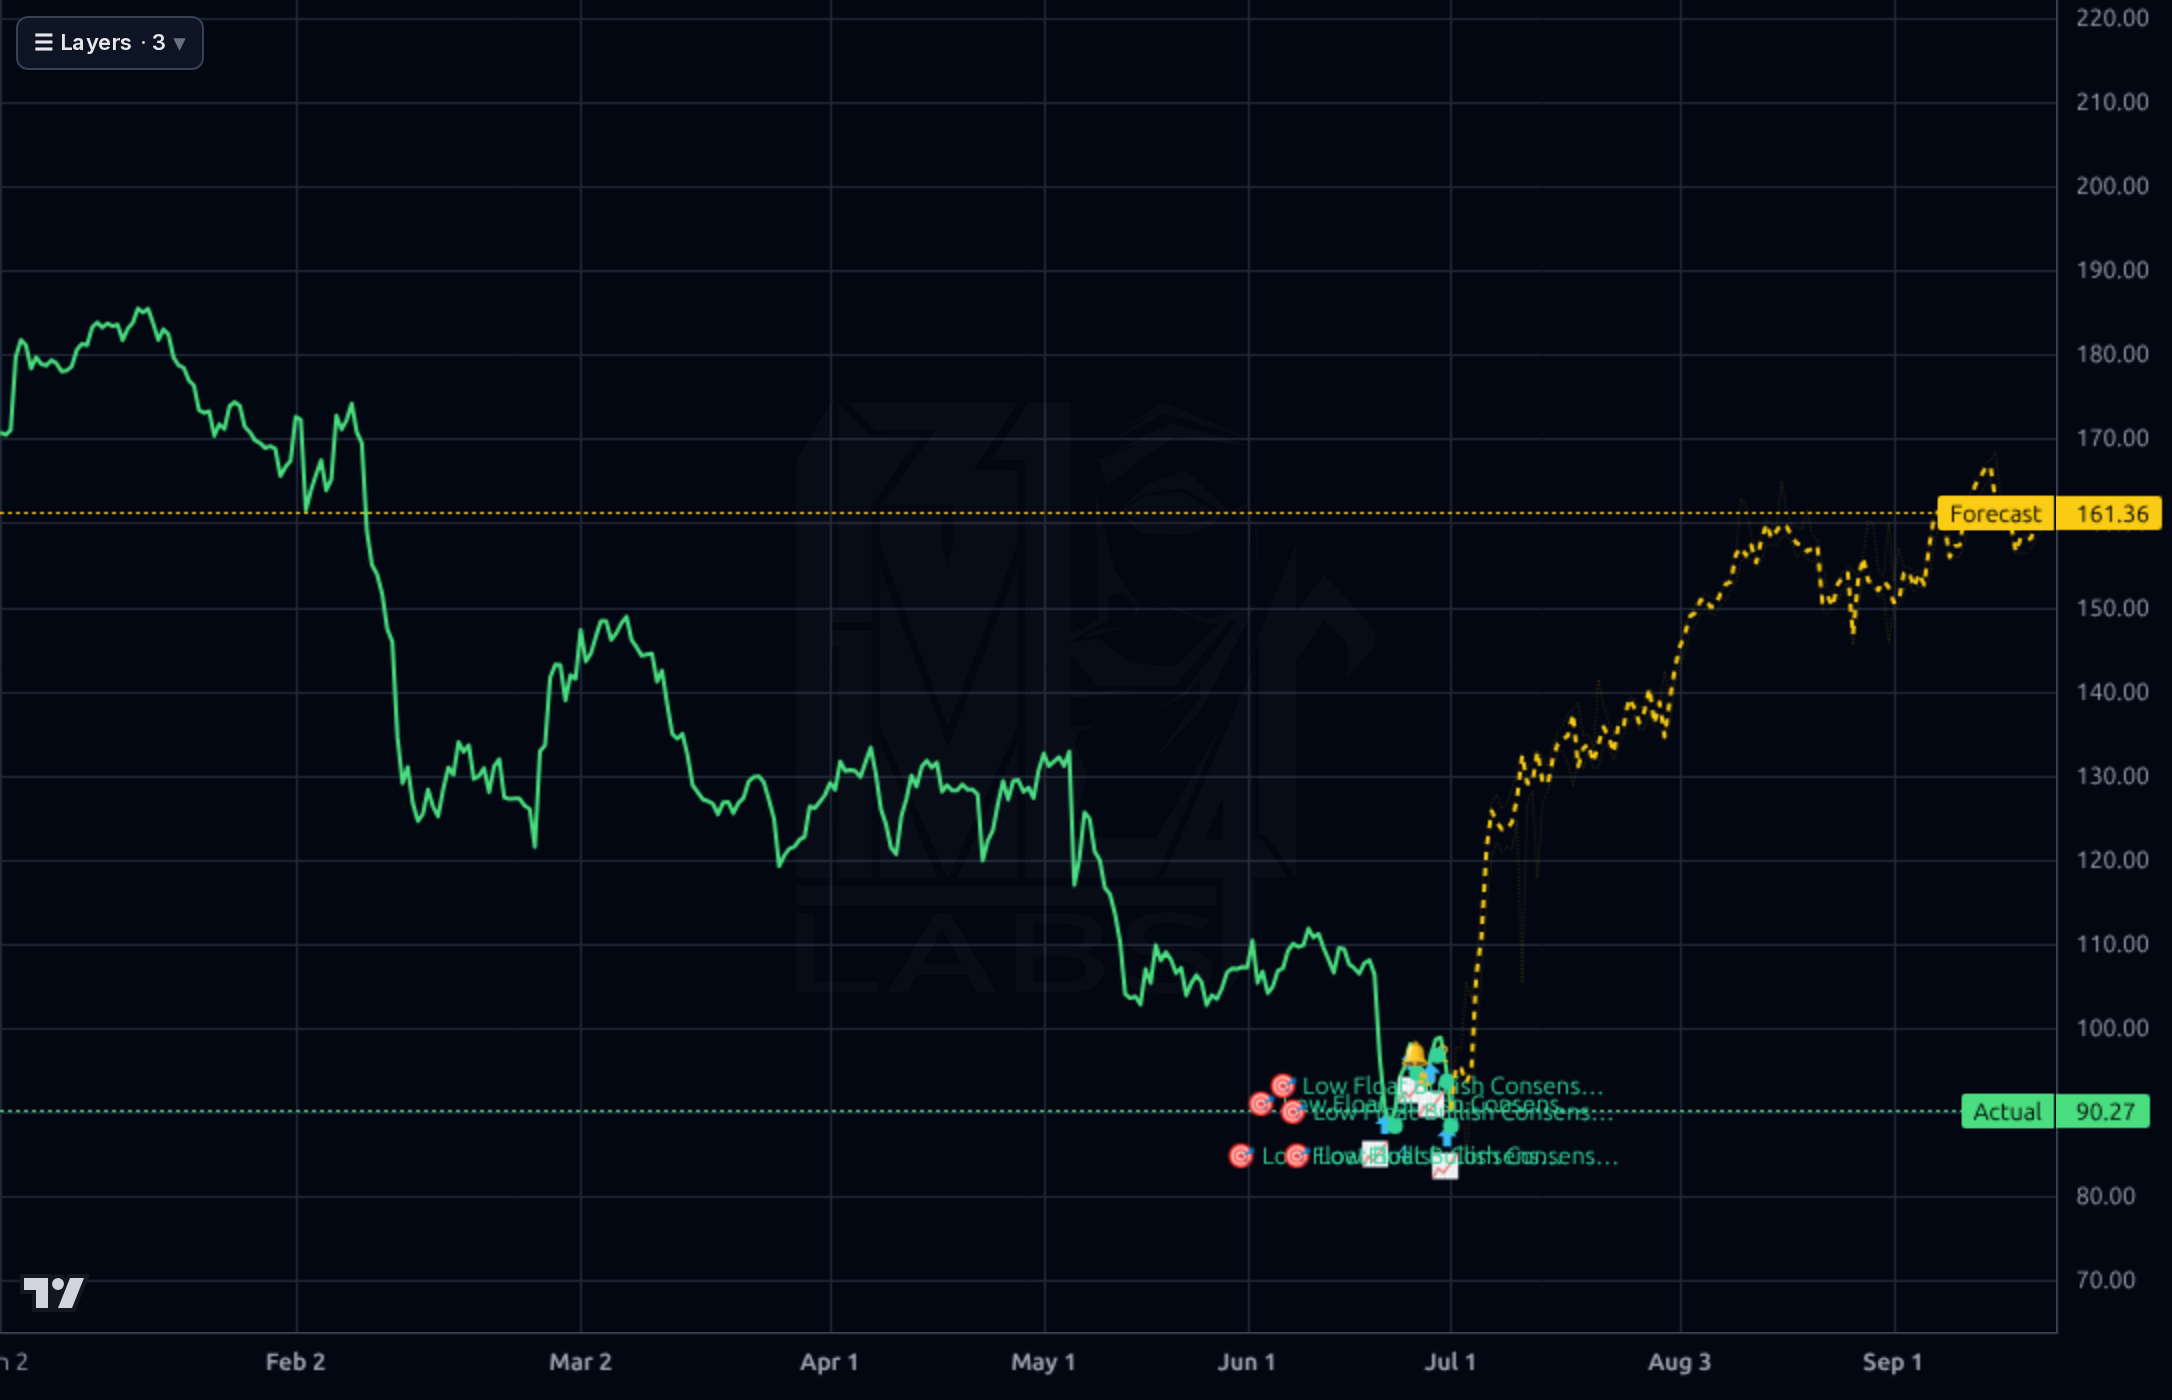
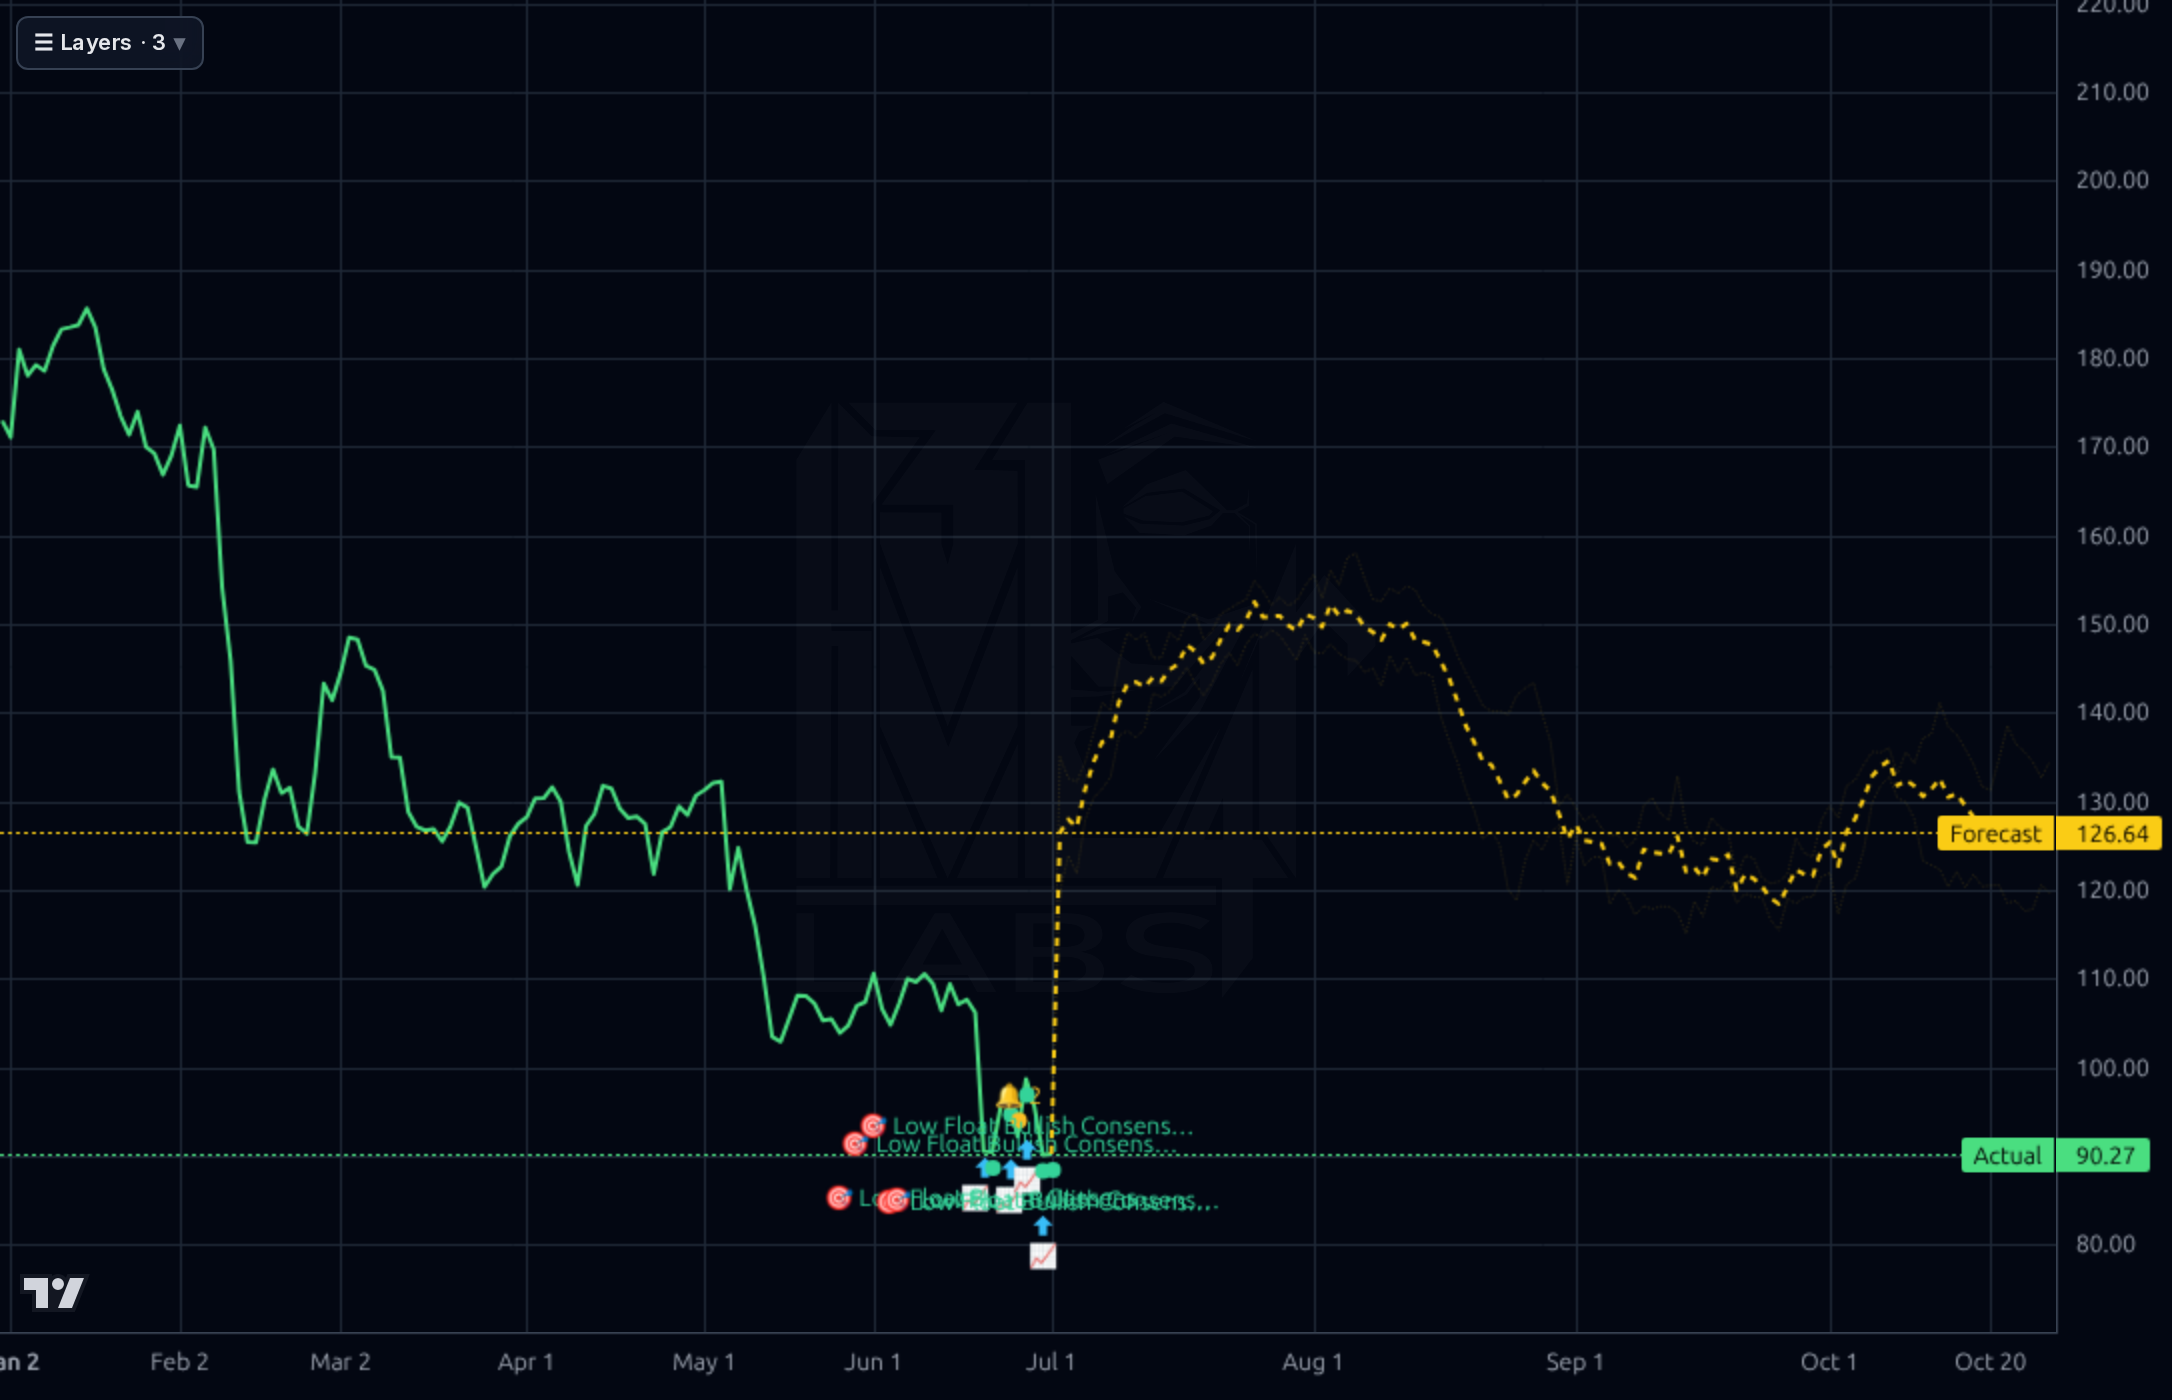
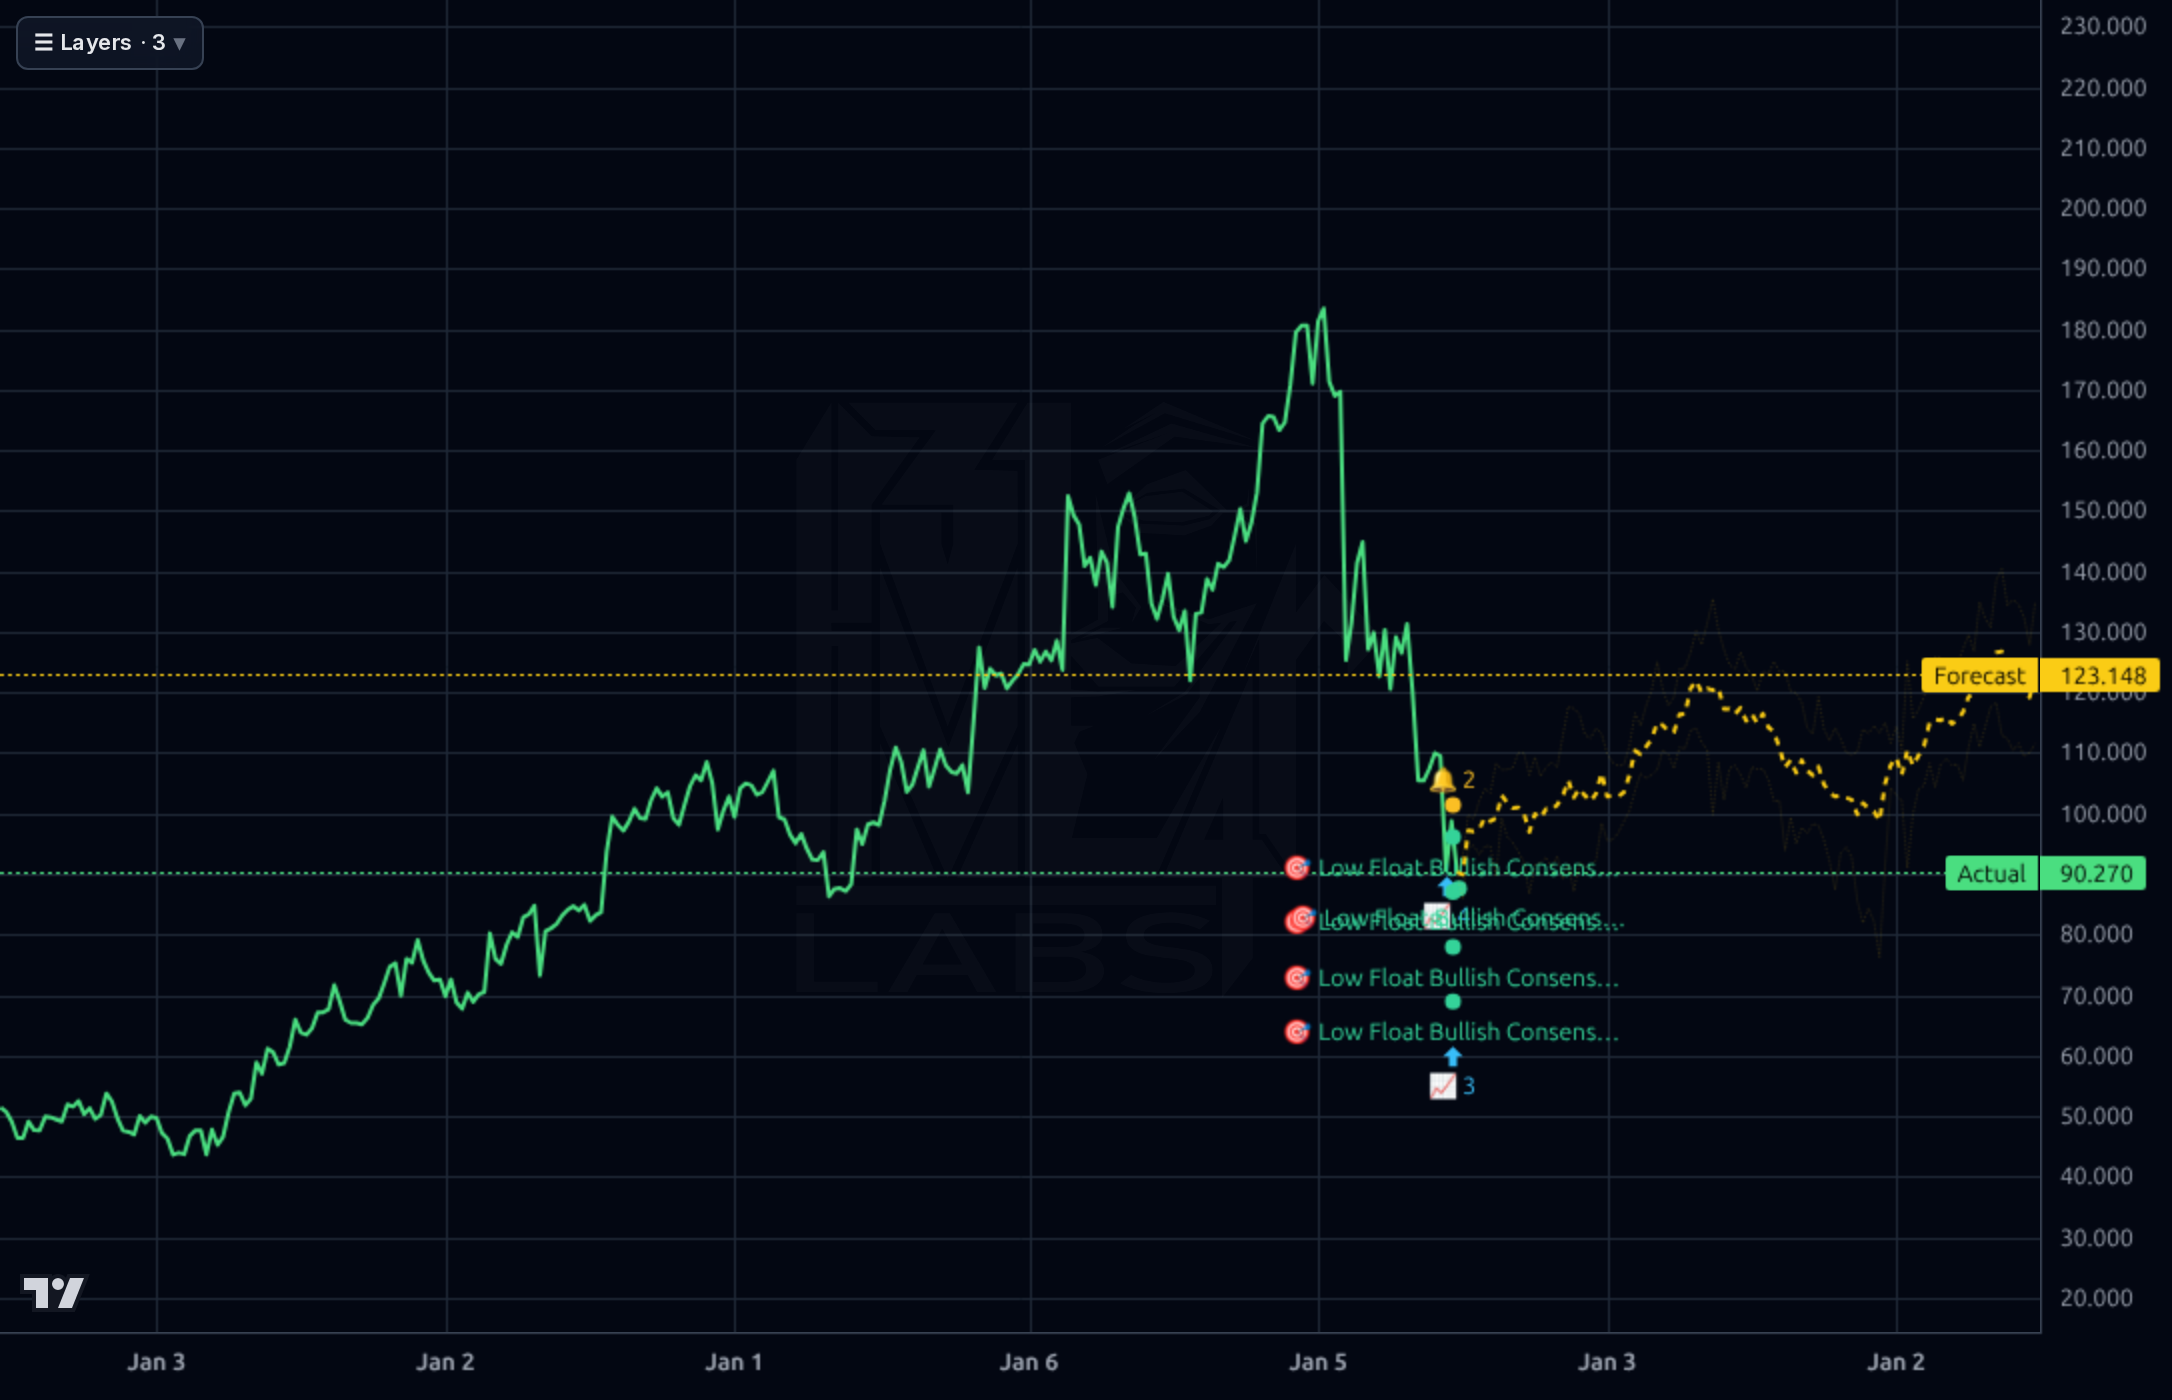
The tape is decisively broken across every timeframe. On the weekly, HURN peaked near $186 in early 2026 and has plunged in an accelerating cascade to $90, printing fresh 52-week lows. Daily and 4h charts show the June cliff-drop from ~$130 to ~$88, with only a shallow bounce and now renewed weakness — price sits -12% below the 20SMA, -19% below 50SMA, and -37% below 200SMA. RSI at 35 is oversold but not yet washed out. The 1h chart shows repeated bullish-consensus signals near $88-90 support that failed to spark a meaningful rally. The forecast model projects $123 (1h/1wk) and $161 (4h) — but the daily model has been running 31% MAPE and lost to a naive baseline, and the prior senior call at $109 already lost 12.7% to date, so those upside projections deserve heavy discount. Immediate support is the $85 52-week low; a break there opens $75-80. Resistance stacks at $100, then $110-115 (the pre-crash consolidation shelf).
The narrative is bifurcated. Positive signals include the RelateCare acquisition adding AI-enabled healthcare managed services (consistent with the stated diversification thesis), record Q1'26 revenue of $443.7M+ (+12.1% YoY) with full-year guidance reaffirmed, and a Zacks note flagging 7.1% single-session strength. Analyst posture remains constructive on paper — average recom of 1.00 (strong buy) and $184 target implies 100%+ upside — but Truist just cut its price target from $240 to $155 on June 9, a meaningful reset even while maintaining Buy. StockStory's 'explosive upside' framing and insider selling coverage indicate the stock is now firmly a value/turnaround debate. The signal: operating fundamentals are intact and management is executing on strategy, but the sell-side is quietly walking down expectations while the price prices in something worse than the reported results.
- RelateCare acquisition (announced June 4) adds AI-enabled patient access and care coordination to the healthcare managed services stack — the highest-growth segment
- Q1'26 record revenue $443.7M with 2026 guidance reaffirmed; $86.2M of remaining performance obligations already booked for 2026 recognition
- Digital services (EHR, ERP, AI/automation, technology managed services) providing recurring revenue diversification vs. traditional project consulting
- Forward P/E of 8.8x vs trailing 15.4x implies management/consensus expects >70% EPS growth into next year — driven by Huron Research software suite scaling and healthcare margin expansion
- $26M cash / $138M TTM operating cash flow supports continued tuck-in M&A in healthcare tech
- Debt/equity of 2.24x (total debt $887M vs equity $397M) — Q1 debt jumped $340M in one quarter while equity fell $131M, an aggressive capital structure shift
- Q1'26 free cash flow of -$174M vs +$119M prior quarter — even accounting for seasonality this is a severe swing that pressures debt service math
- Operating margin compressed to 8.2% in Q1'26 from 12.1-12.2% in H2'25 — early sign of margin erosion, not just seasonal noise
- Truist cut price target from $240 to $155 (June 9) — sell-side is walking down expectations even while maintaining Buy ratings
- Stock -47.9% YTD, -50.1% over past 6 months, -36.97% below 200SMA — momentum and technical structure are severely broken; catching this could be catching a falling knife
- Consulting revenue is cyclical and tied to enterprise IT budgets; a 2026-2027 corporate spending slowdown would hit both revenue and margins
- The Kronos forecast model has been directionally beaten by a naive baseline (24% vs 76% on 1d) — its bullish signal here is unreliable
Get AI analysis on any stock
This is one of hundreds of Kronos AI reports — scored fundamentals & technicals, bull/base/bear price targets, a multi-horizon plan, and continuously-updated forecasts across the market. Create a free account to explore them all.
Create your free account →Already a member? Sign in · Join our Discord