MORN— AI Stock Forecast & Price Targets
Published 6/29/2026 · A free sample of K3vl4r’s AI-powered analysis.
Kronos price forecasts, scored fundamentals & technicals, and a multi-horizon plan.
View the live MORN price forecast →
Morningstar has been violently re-rated from $316 to $154 (-51% from 52w high, -28.8% YTD), creating a rare valuation reset in a high-quality data/analytics franchise that still posts 30.7% ROE, 62% gross margins and ~$450M FCF. The selloff appears overdone relative to fundamentals (fwd P/E 11.5, PEG 0.66, analyst PT $234 = ~51% upside), but a fresh analyst downgrade and a balance sheet that took on ~$645M of incremental debt in Q1 warrant caution; Kronos' near-term forecast is unreliable here (beaten by naive baseline) so we lean on fundamentals.
The +9% reversal on 2.24x relative volume at $141 support is a tradeable bounce setup, but the Kronos near-term forecast is statistically unreliable here so do not lean on it. Entry zone $150–158 with a hard stop below $141 (52w low); first target $172, stretch $180. Sizing should be ½ of a normal starter given the L2 analyst downgrade is still fresh and earnings sit ~30 days out. Invalidation: any daily close below $141 voids the reversal thesis.
Over 1–6 months the thesis is mean-reversion in a high-quality franchise trading at 11.5x fwd EPS and PEG 0.66 with a $234 consensus PT. Catalysts: Jul 29 Q2 print (consensus $2.82 EPS), clarity on what the $645M incremental debt was used for (M&A? buyback?), and ramp of the Microsoft Copilot and CLO index products. Expected return range $180–$215 (+16% to +39%) base case. What changes my mind: Q2 miss, further downgrades, or evidence the debt funded operating shortfalls rather than strategic investment.
Over 1–3 years Morningstar remains a wide-moat data/analytics compounder with five distinct segments (Direct, PitchBook, Credit, Wealth, Retirement), 30%+ ROE, recurring revenue, and pricing power. If margins re-rate back toward prior peaks and PitchBook/Credit keep compounding mid-teens, $250–$300 is reachable. The biggest structural risk is competitive disruption from AI-native research tools and free/low-cost data alternatives eroding the Direct/Advisor Workstation franchise — ironically the same Copilot integration that is a near-term positive could become a strategic dependency.
Revenue trend is steadily positive: quarterly revenue stepped from $605.1M (Q2'25) → $617.4M → $641.1M → $644.8M (Q1'26), with TTM sales of $2.51B (+8.4% Y/Y). Profitability is improving — operating margin expanded to 24.2% in Q1'26 from 20.7% in Q3'25, net margin 16.6%, and EPS Q/Q +49.6%. The business is genuinely high-quality: ROE 30.7%, ROIC 14.1%, gross margin 62% (Yahoo) / 54% (Finviz, methodology gap), and FCF of $452.8M TTM (P/FCF 13.5). Capital allocation is shareholder-friendly (1.24% yield, only 21% payout, 3/5Y dividend growth ~8.5%) and insider ownership is unusually high at 48.8%. The yellow flag is the balance sheet: total debt jumped from $1.04B (Sep '25) to $1.26B (Dec '25) to $1.91B (Mar '26) while stockholders' equity fell from $1.61B to $1.02B — debt/equity now 1.87 and EV/EBITDA 9.6. Cash of $493M and operating cash flow of $590M TTM make this serviceable, but the leverage step-up combined with Q1 capex of $37.9M and only $53.6M FCF (vs $161M in Q4) bears watching. Overall the franchise is intact and arguably cheaper than it has been in years; the question is what management did with the debt raise.
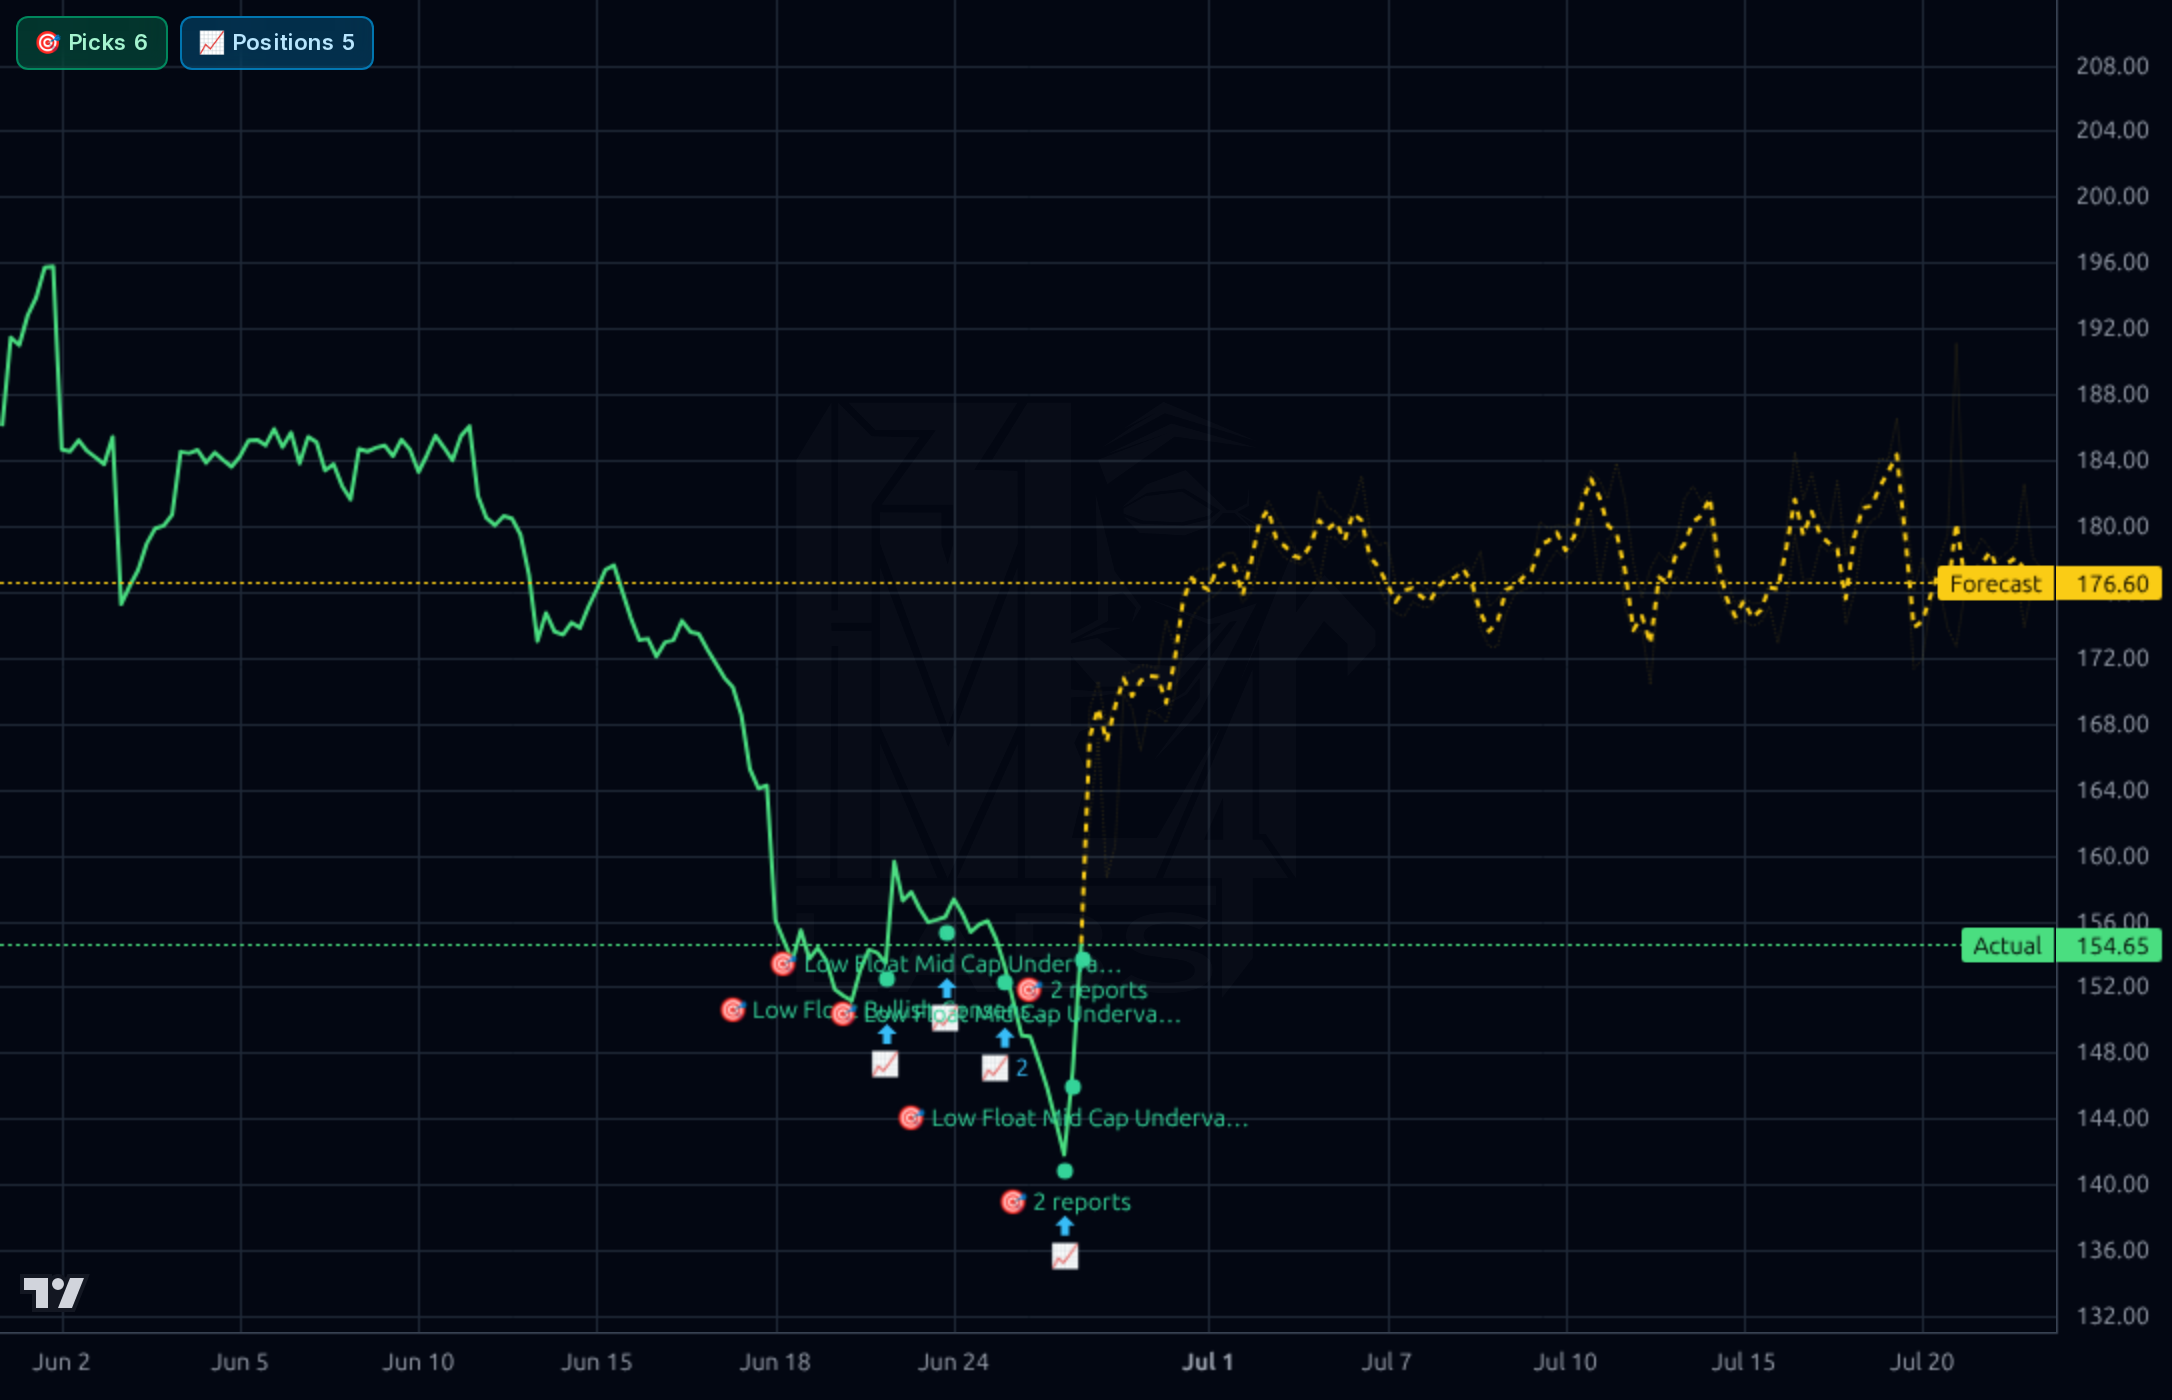
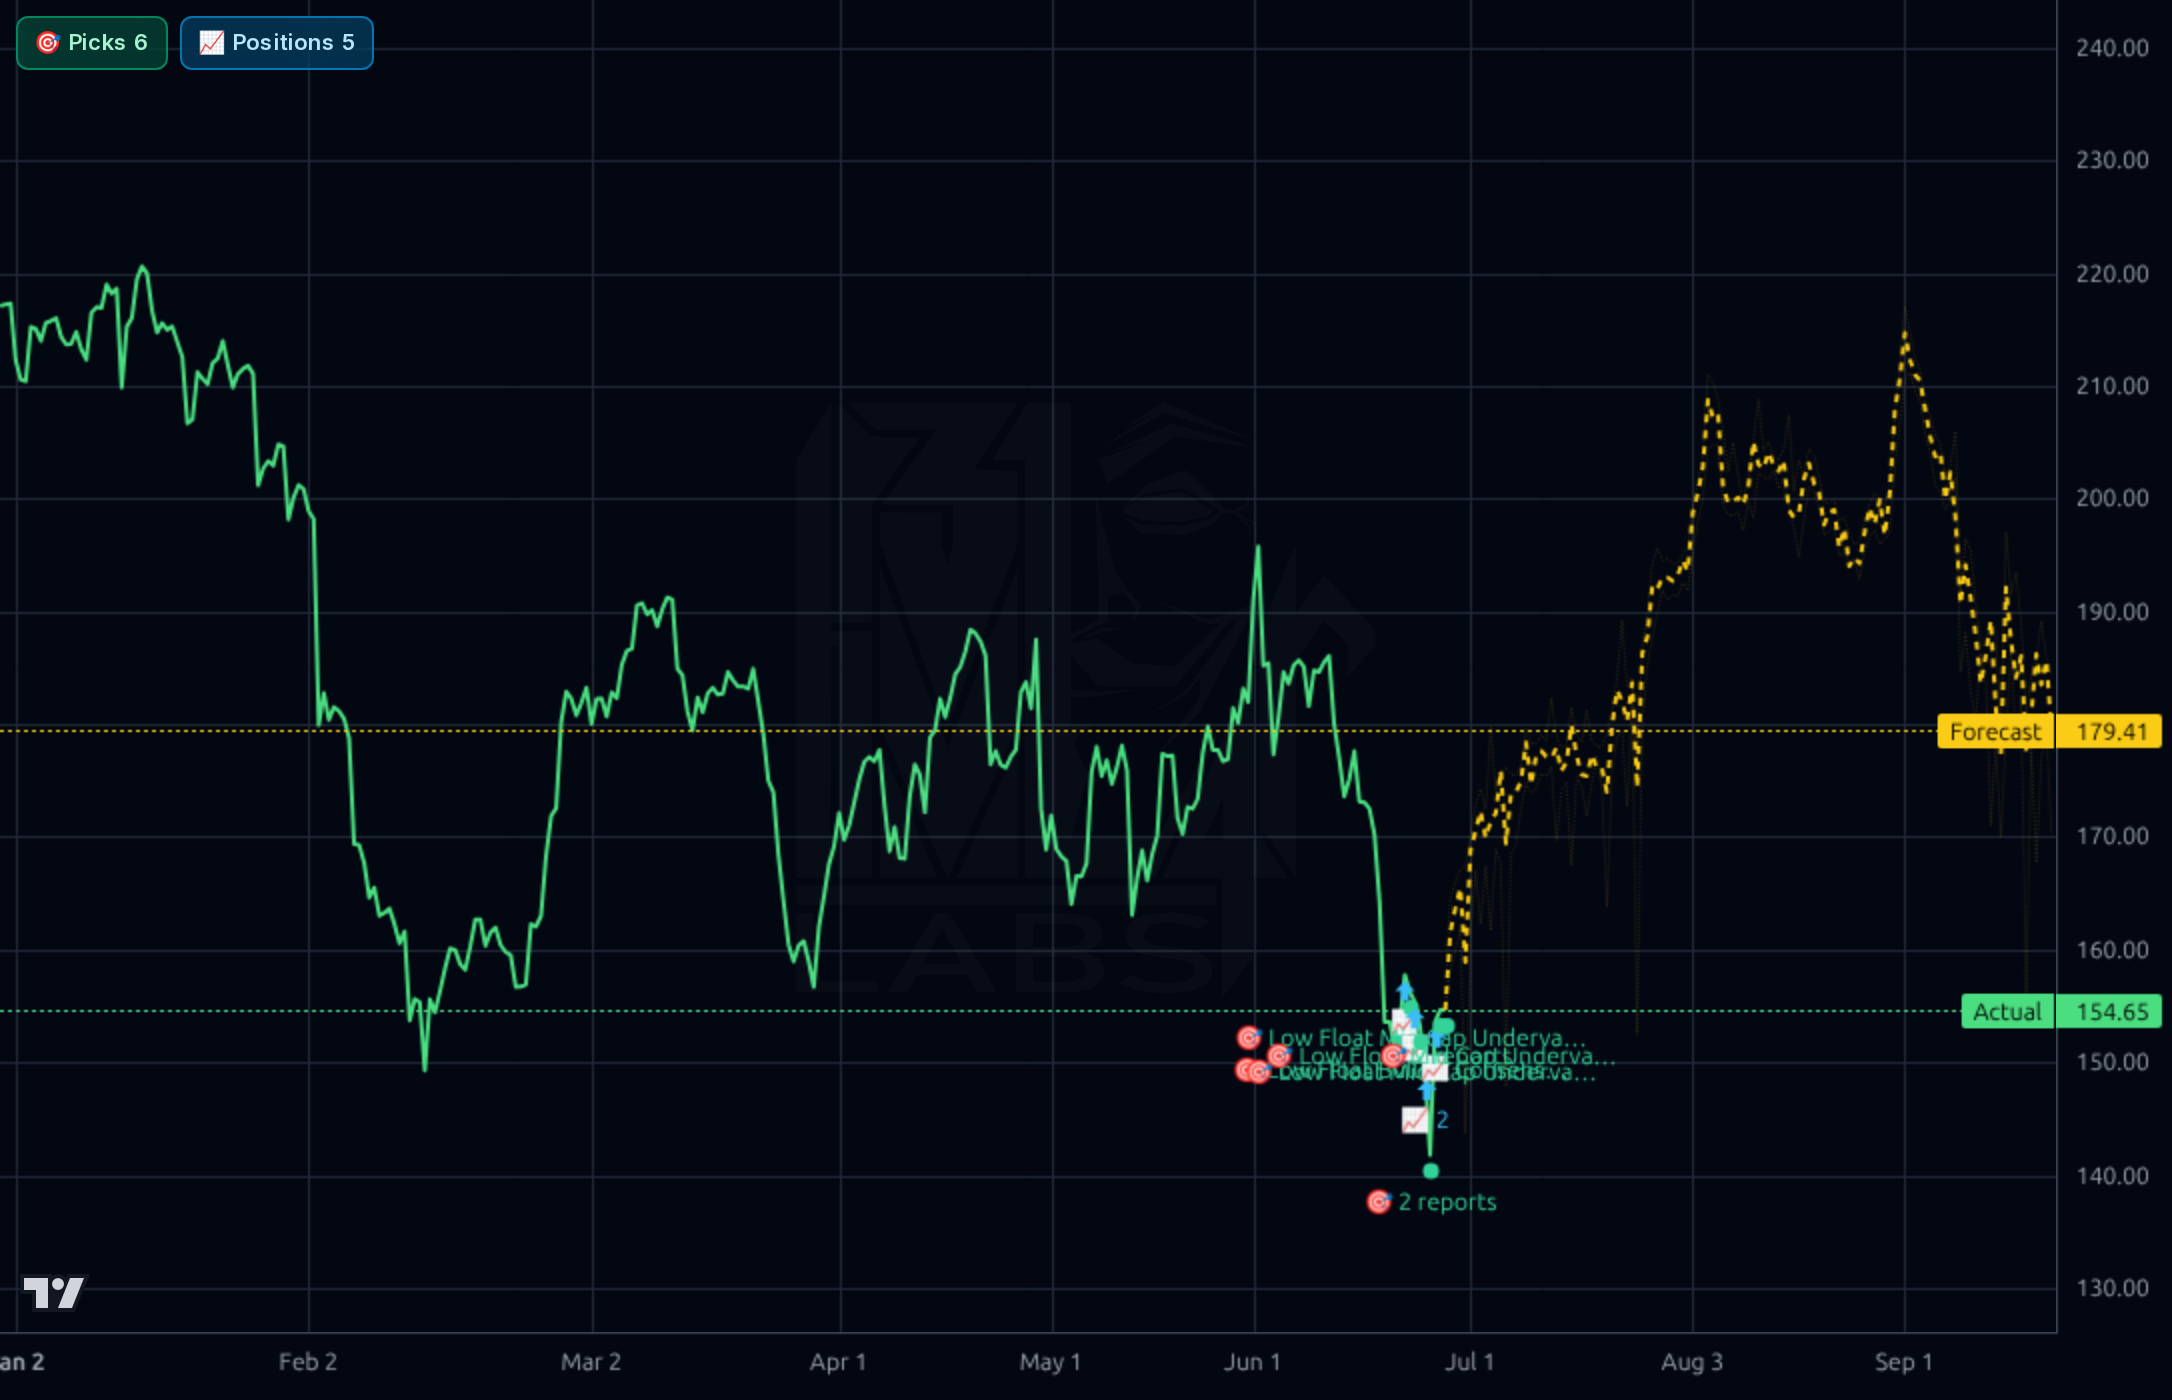
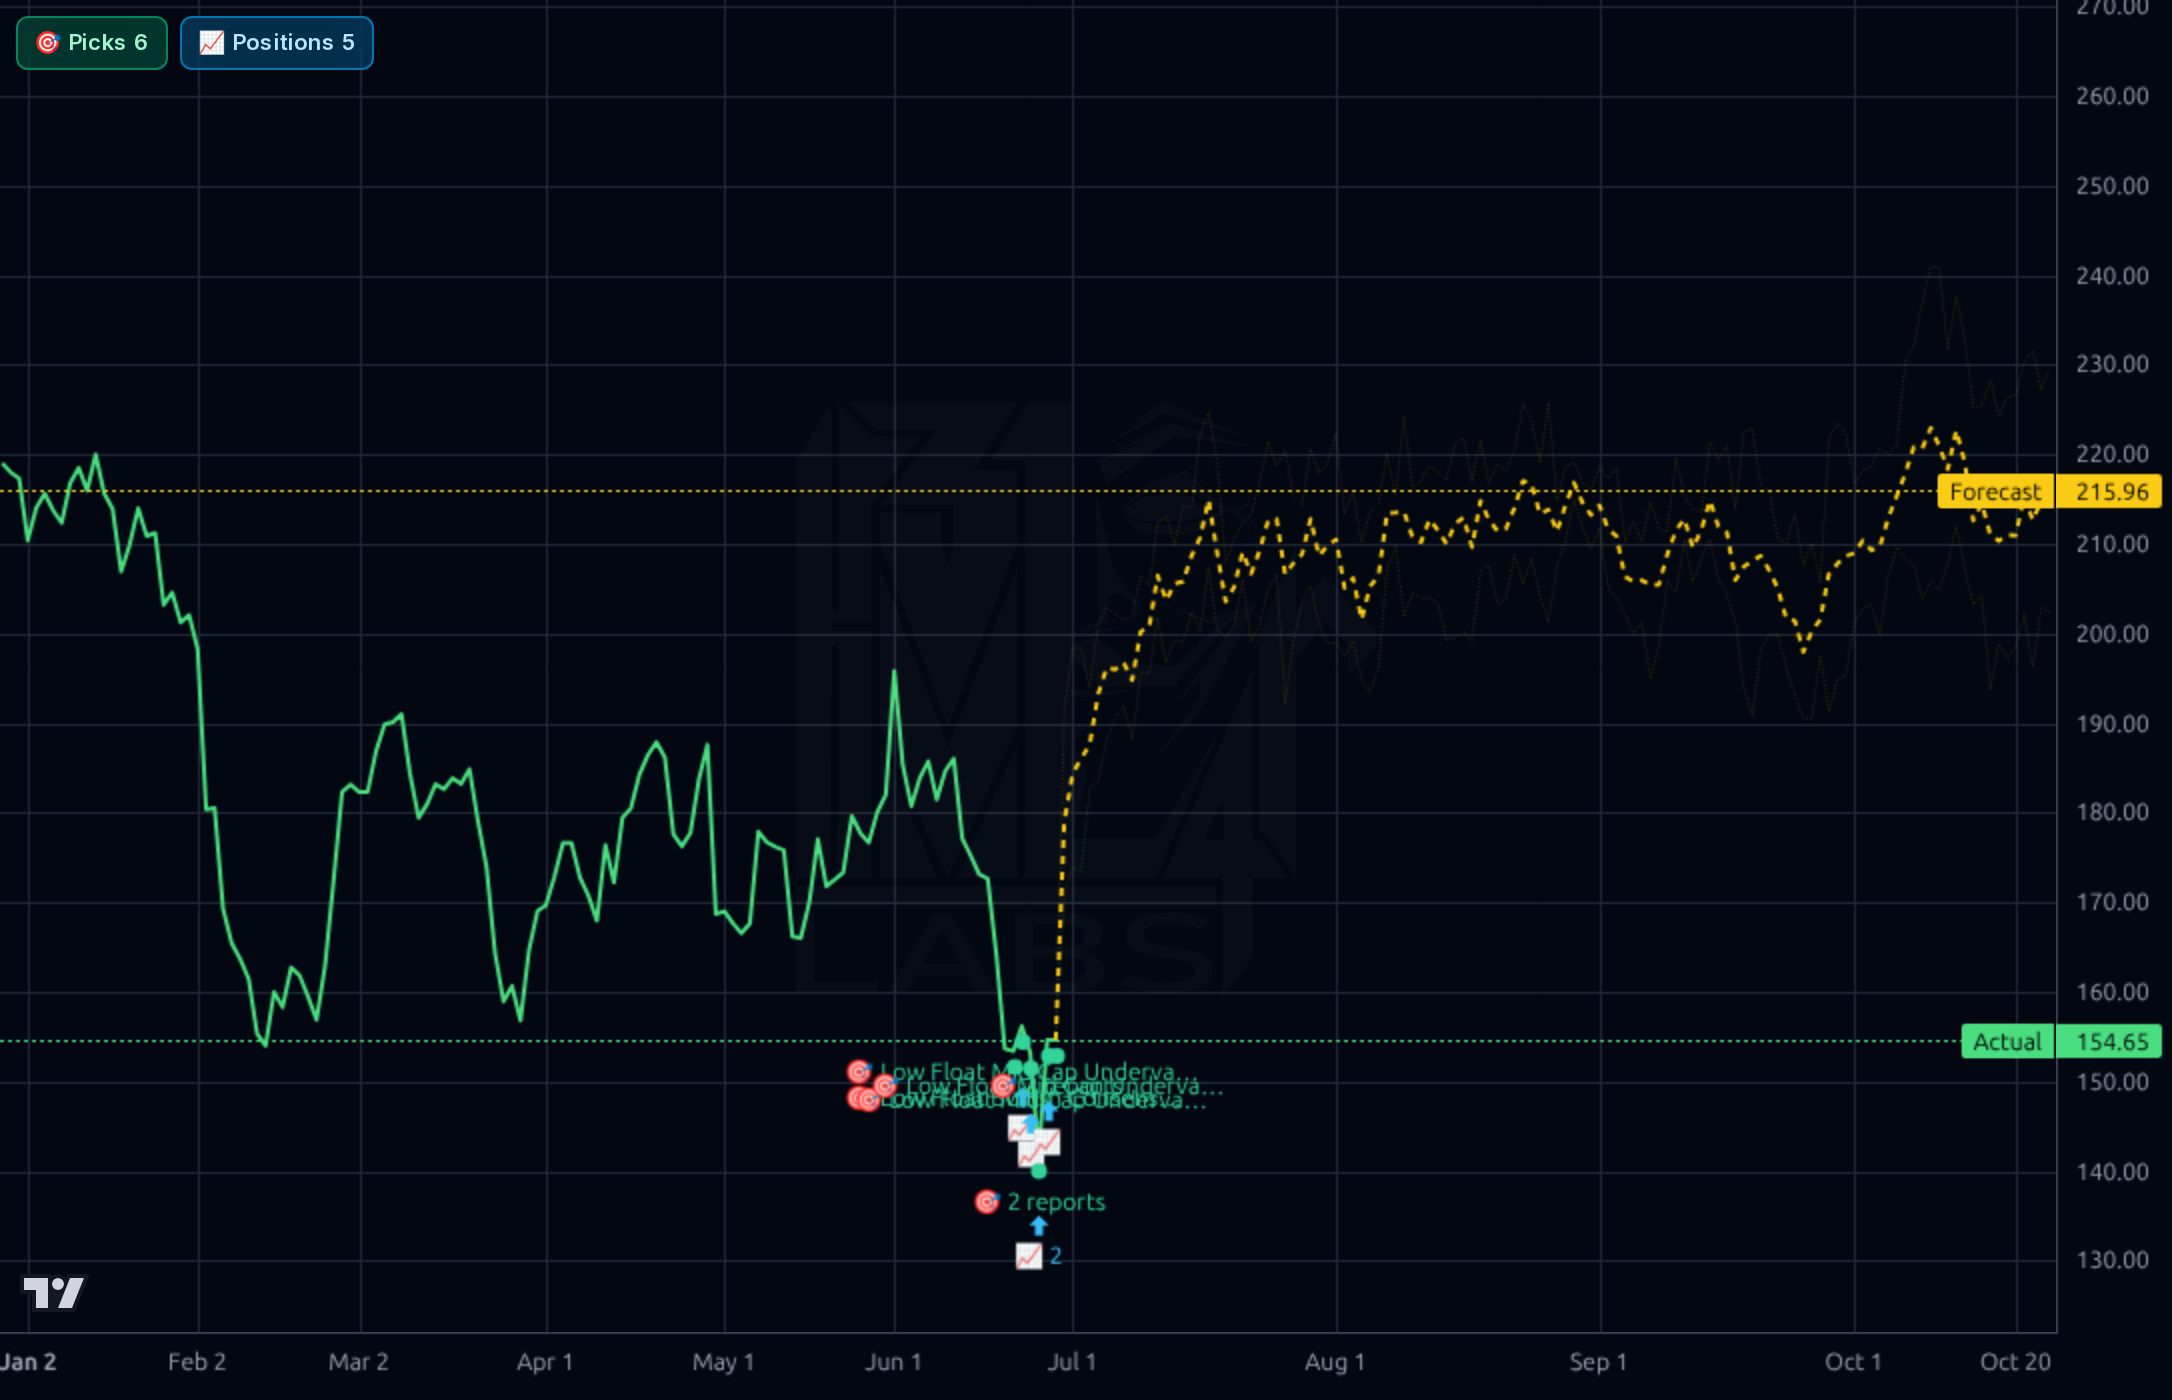
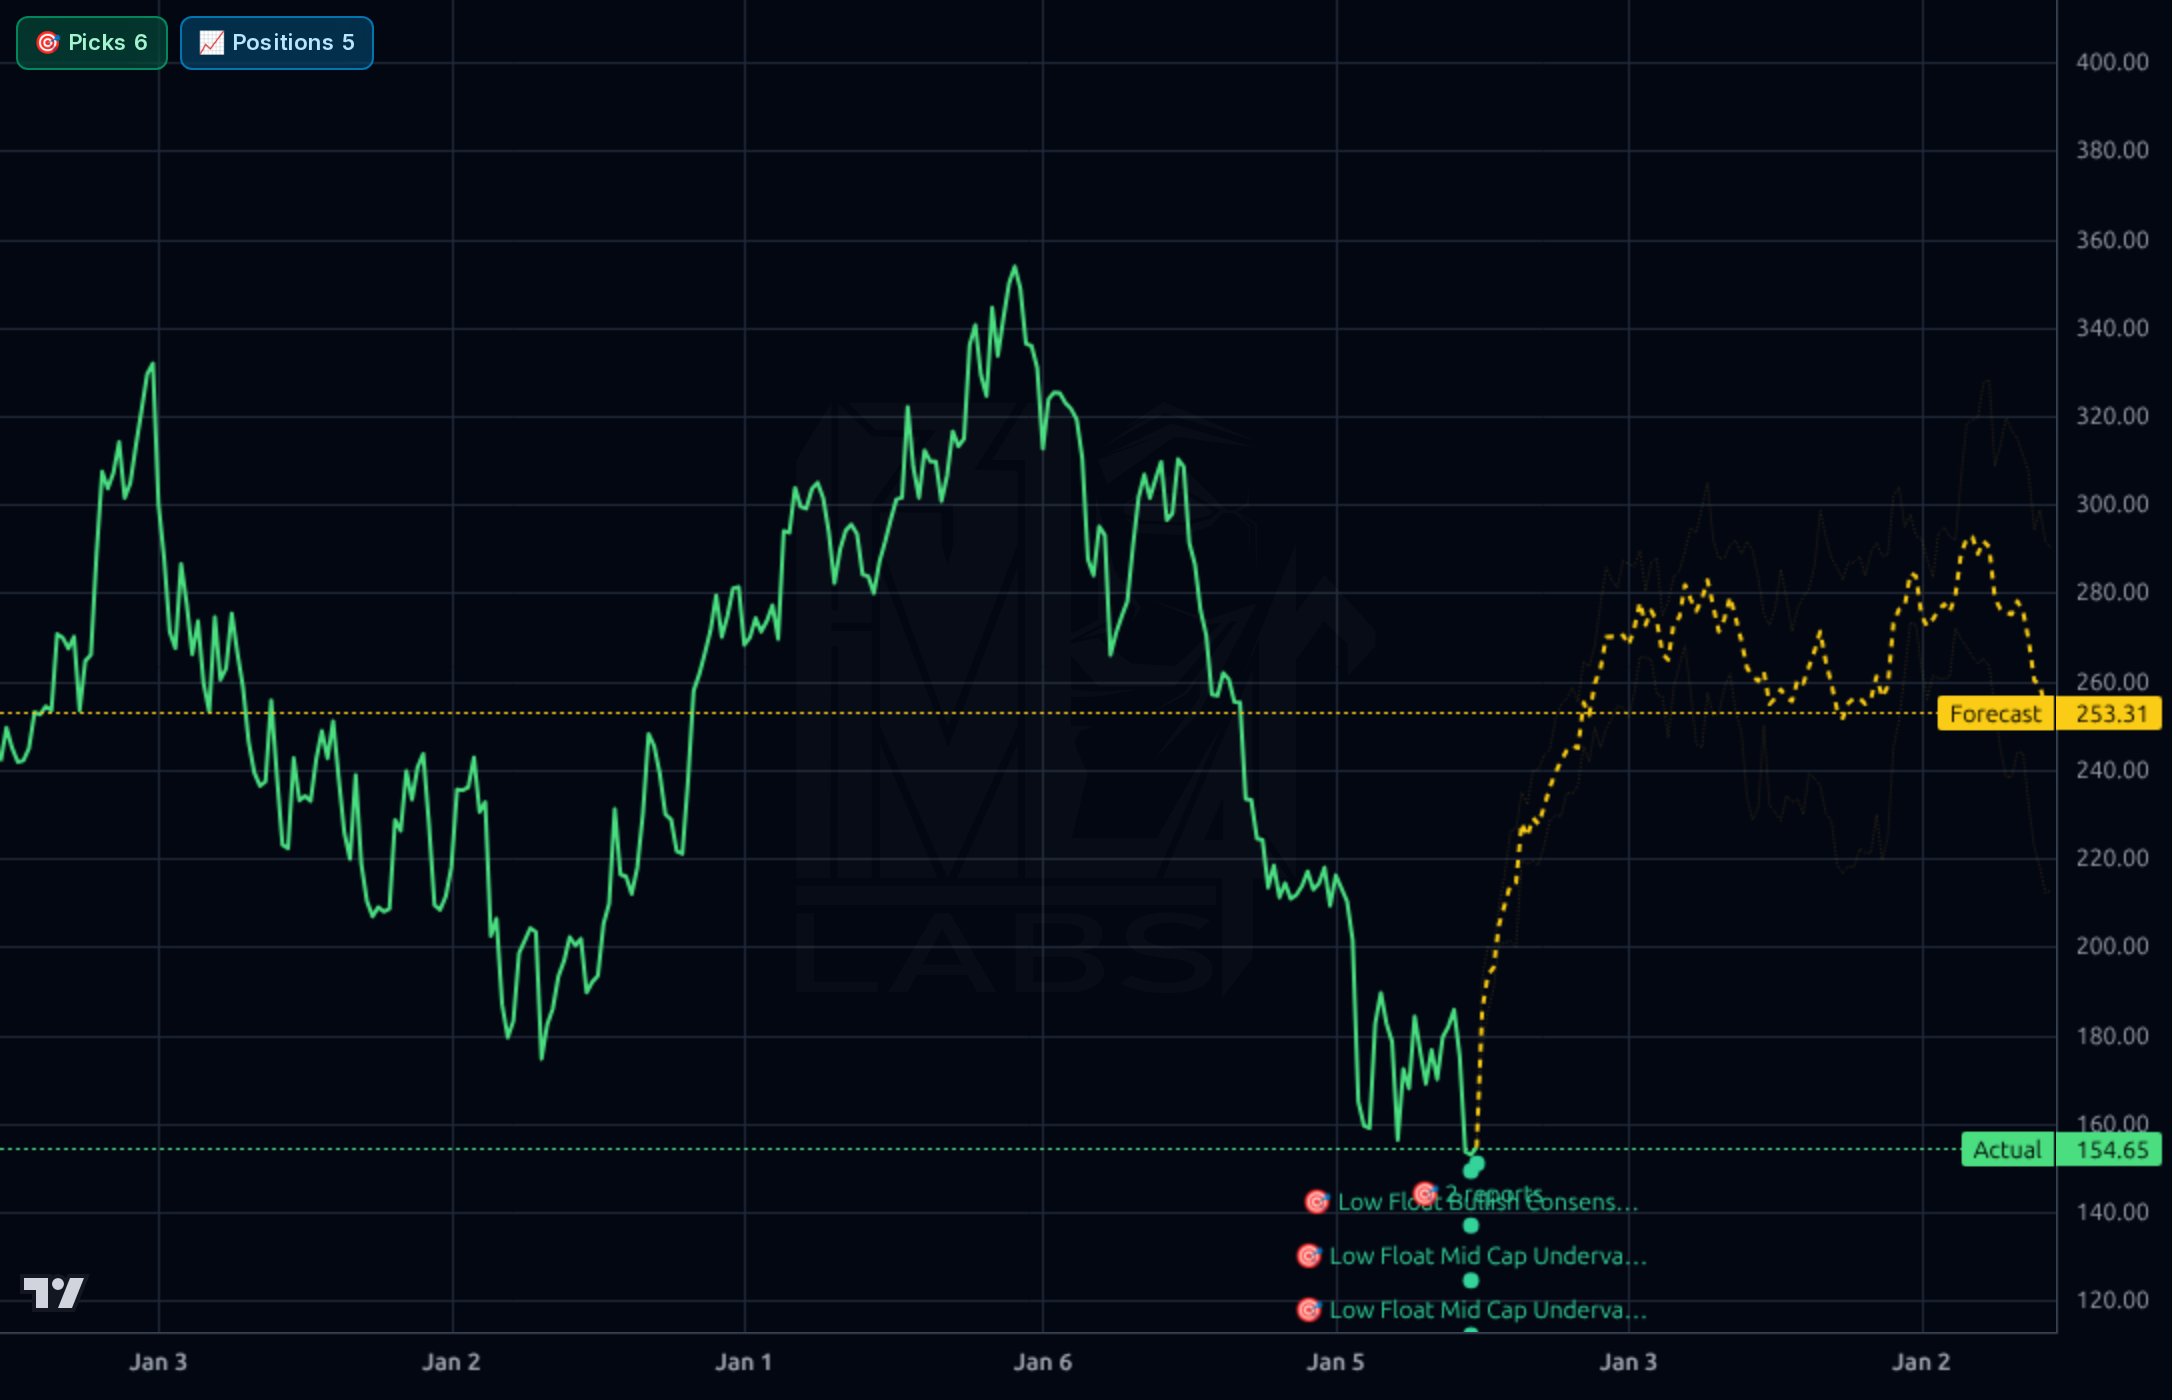
All four timeframes show a stock in a sustained downtrend culminating in a capitulation. The 1wk chart shows a roll-over from ~$355 highs through ~$320 distribution to a vertical drop to $154.65, the Actual print. The 1d chart confirms price sits at multi-year lows, -51% from 52w high and -21% below the 200-day SMA, -10% below 20-day. RSI 39.8 is weak but not yet washed-out oversold. The 1h chart shows the most recent leg: a slide from ~$184 (Jun 5) to $141 intraday lows around Jun 27, with the close at $154.65 (+9.0% on the session per Finviz; rel vol 2.24x) — a potential capitulation low with bullish reversal characteristics. The Kronos forecast bands across all timeframes are sharply higher ($176.60 on 1h, $179.41 on 4h, $215.96 on 1d, $253.31 on 1wk) — but realized directional accuracy is 11% vs 89% naive on 1d and 0% vs 100% on 1wk, so the model is mis-firing in this regime and the bullish forecast should be heavily discounted. Key levels: support $141.49 (52w low, must hold), resistance $172–$180 (prior consolidation shelf and 50-day area), then $200 psychological.
The newsflow is constructive but not transformative. The most concrete items are the Microsoft 365 Copilot integration bringing Morningstar research into Outlook/Excel and a partnership with Houlihan Lokey on daily CLO valuation indexes (both Jun 27) — these expand product surface area into enterprise workflow and private credit, two structurally growing TAMs. Subsequent items (loan fund AUM growth, Calamos CAIE anniversary, VOO $1T milestone, David Booth conference coverage) are tangential mentions of Morningstar data rather than company-specific catalysts. The more important signal sits outside the headlines: a Jun 20 analyst rating downgrade (1.00 → 1.67) is flagged as L2 bearish and coincides with the price collapse, suggesting sell-side concern around either the Q1 debt step-up, segment growth (PitchBook, Credit), or guidance. With earnings due Apr 29 / Jul 29 (data is inconsistent — Q2 print 07/29 AMC per social), the next print is the swing factor. Sentiment is 75% bullish on a small sample and the +9% reversal day attracted retail attention.
- Microsoft 365 Copilot integration (Jun 27) — embeds Morningstar research/analytics directly into Outlook & Excel, expanding distribution into enterprise workflow
- Daily CLO valuation indexes with Houlihan Lokey (Jun 27) — new benchmark product targeting the structurally growing private credit / CLO market
- PitchBook segment continued penetration into private capital markets (VC/PE/credit) — referenced as one of five segments and a key growth engine
- Morningstar Sustainalytics ESG data franchise as a long-duration revenue stream
- Operating margin expansion already visible: 20.7% (Q3'25) → 21.4% → 24.2% (Q1'26), with EPS Q/Q +49.6%
- Sharp leverage step-up: total debt rose from $1.04B (Sep '25) to $1.91B (Mar '26) while equity fell to $1.02B; D/E now 1.87 with no public explanation in news provided
- Fresh analyst downgrade Jun 20 (1.00 → 1.67) — sell-side turning more cautious into the selloff
- Stock down -50.2% over 1 year, -28.8% YTD, -21% below 200-day SMA — heavy crowding/momentum risk if Q2 disappoints
- Short float 9.72% and short ratio ~3.7 — elevated bearish positioning suggests informed sellers see further downside
- Q1'26 FCF dropped to $53.6M from $161.3M in Q4'25 — cash conversion volatility, possibly seasonal but needs monitoring
- Kronos model is currently unreliable on this name (1d directional accuracy 11% vs 89% naive), implying regime change the model hasn't adapted to
- Secular risk: AI-native research tools could disrupt the core Direct/Advisor Workstation franchise
Get AI analysis on any stock
This is one of hundreds of Kronos AI reports — scored fundamentals & technicals, bull/base/bear price targets, a multi-horizon plan, and continuously-updated forecasts across the market. Create a free account to explore them all.
Create your free account →Already a member? Sign in · Join our Discord