NOG— AI Stock Forecast & Price Targets
Published 6/30/2026 · A free sample of K3vl4r’s AI-powered analysis.
Kronos price forecasts, scored fundamentals & technicals, and a multi-horizon plan.
View the live NOG price forecast →
NOG presents a mixed picture: strong dividend yield (10.13%) and recent operational guidance increases suggest underlying value, but negative profitability metrics (-0.32 PE) and analyst downgrades temper optimism. The technicals show extreme oversold conditions on the 1D chart, while the consensus is bearish following multiple price target cuts from major banks.
Given the extreme oversold technical reading and high short interest (Short Ratio: 6.08), a tactical accumulation approach is warranted only on significant dips towards structural support levels, perhaps testing $17.50-$17.70. However, be prepared for sharp downside moves if broader energy sentiment deteriorates further.
The mid-term thesis hinges on the company successfully executing its production guidance increases and stabilizing profitability to justify the high dividend yield. A catalyst would be a reversal in analyst sentiment or sustained commodity price strength that allows NOG to improve net margins above 0%. If management can demonstrate capital efficiency improvements, the stock could retest prior resistance levels.
The long-term case is built on its status as an income play due to the high dividend yield (10.13%). However, the structural risk of high debt ($2.55B) relative to cash flow and negative historical profitability suggests that sustained capital expenditure or commodity price downturns could pose a significant threat to shareholder returns.
The fundamentals reveal a company with significant dividend appeal (10.13% yield) but concerning profitability metrics, evidenced by negative profit margins (-0.32) and negative trailing EPS (-6.32). While the forward P/E of 4.37 suggests low valuation relative to expected earnings, the historical net margin has been volatile and often negative in recent quarters (e.g., -0.96 in Q1 2026). The balance sheet shows high leverage with a Debt-to-Equity ratio of 142.99, indicating substantial debt relative to equity. Cash flow quality is mixed; while operating cash flow was strong at $323M (Q1 2026), the company has negative free cash flow in that period due to significant CapEx (-$311M). The recent guidance lift on production output suggests operational strength despite financial weakness.
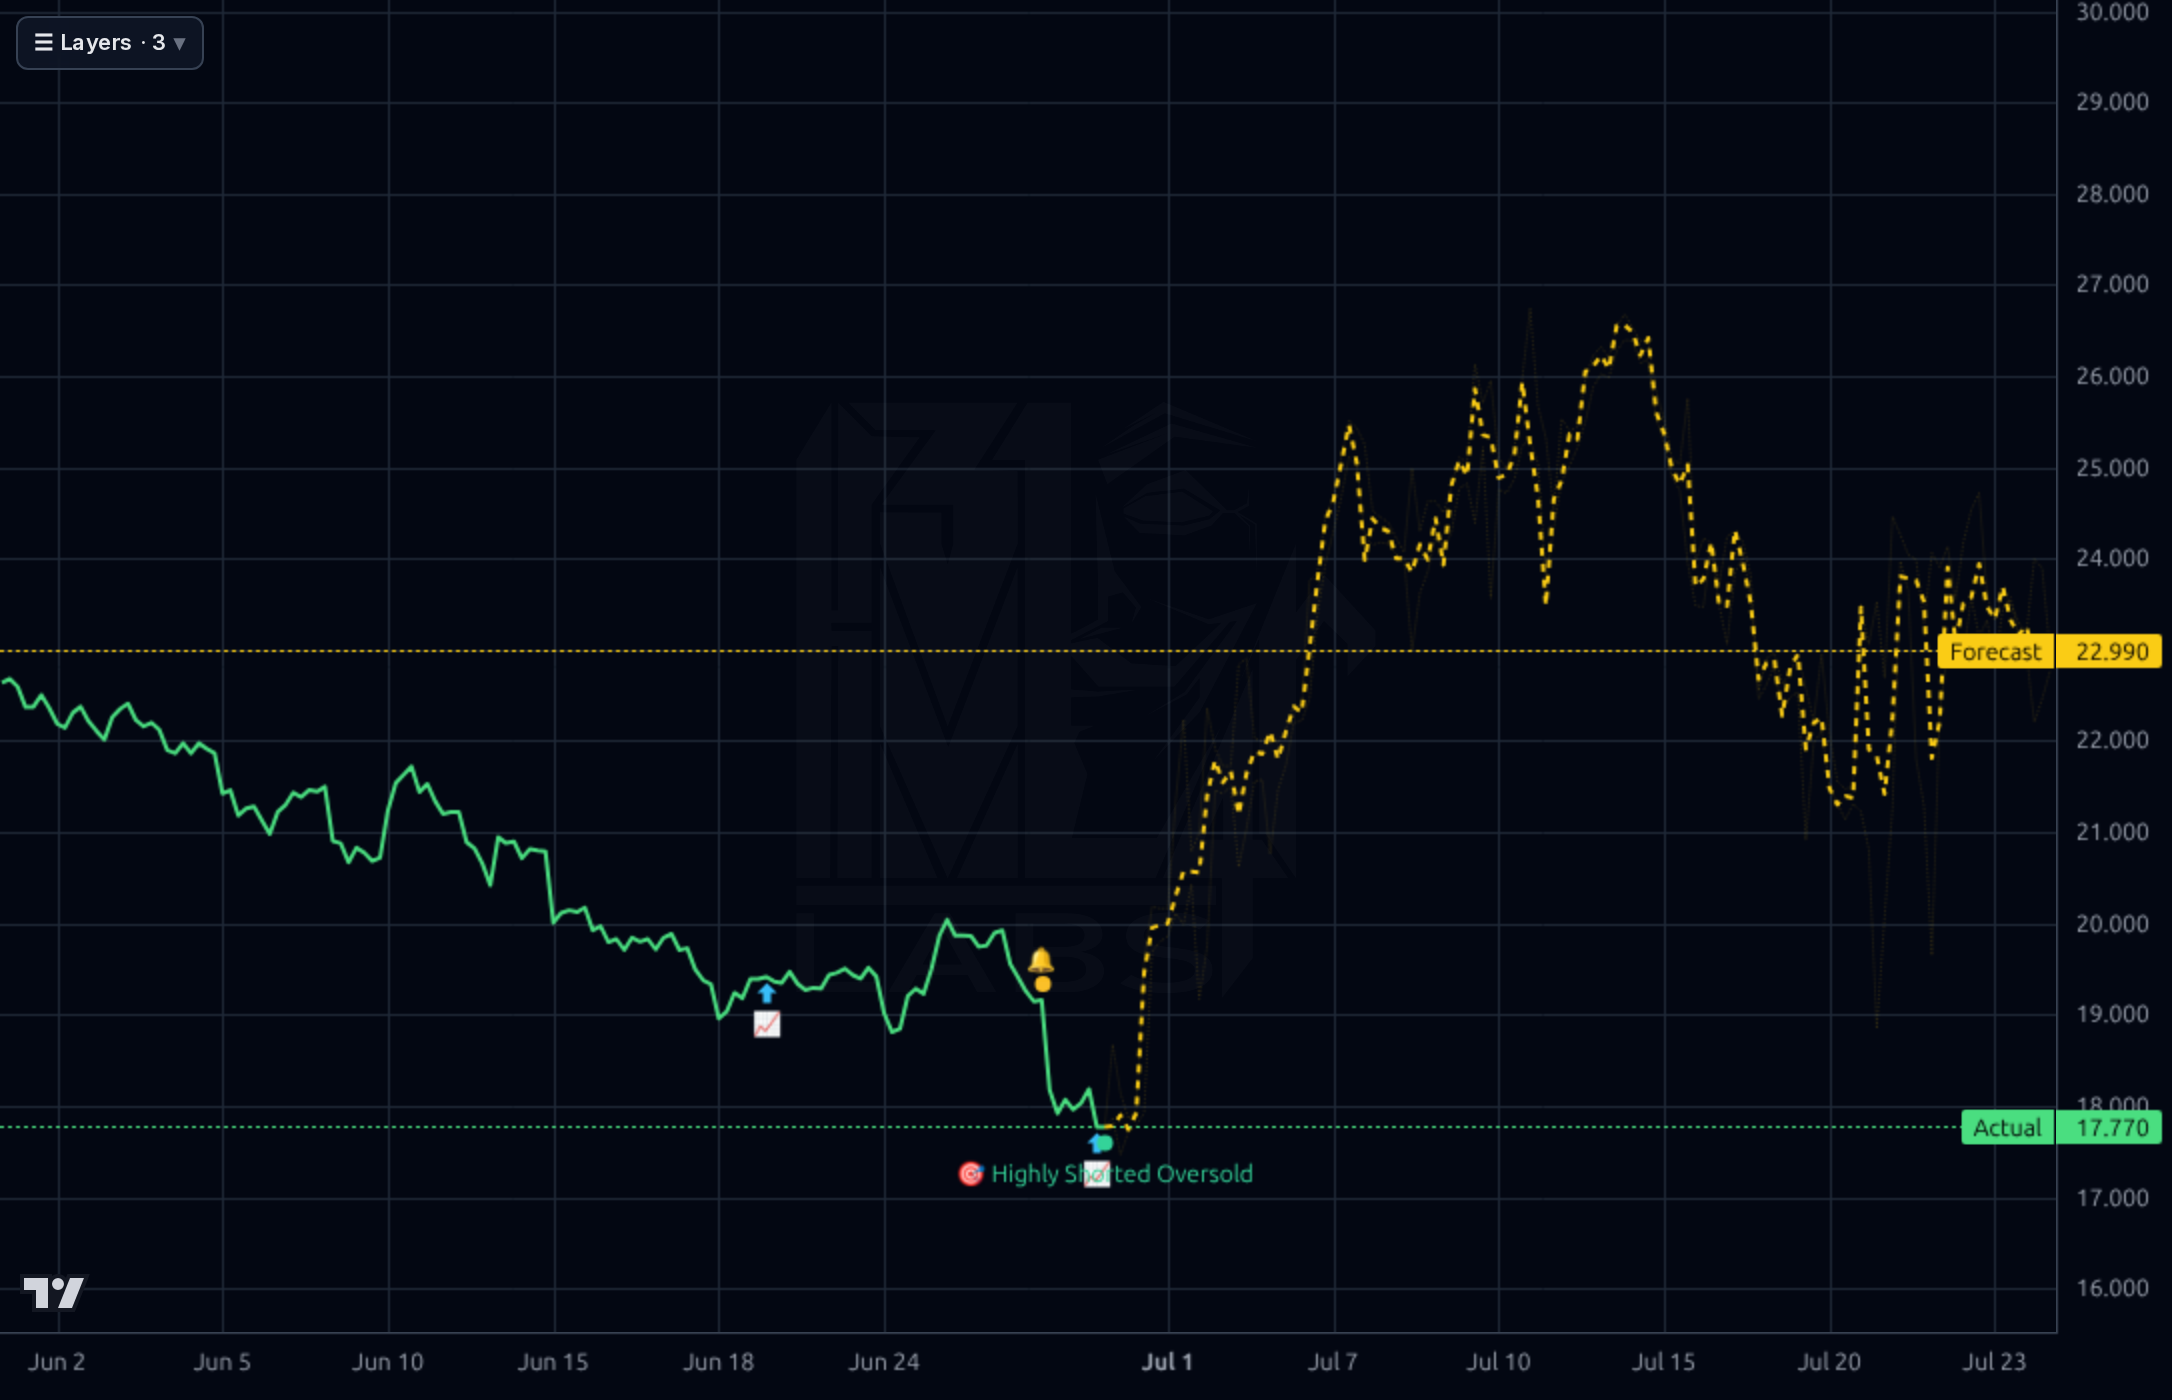
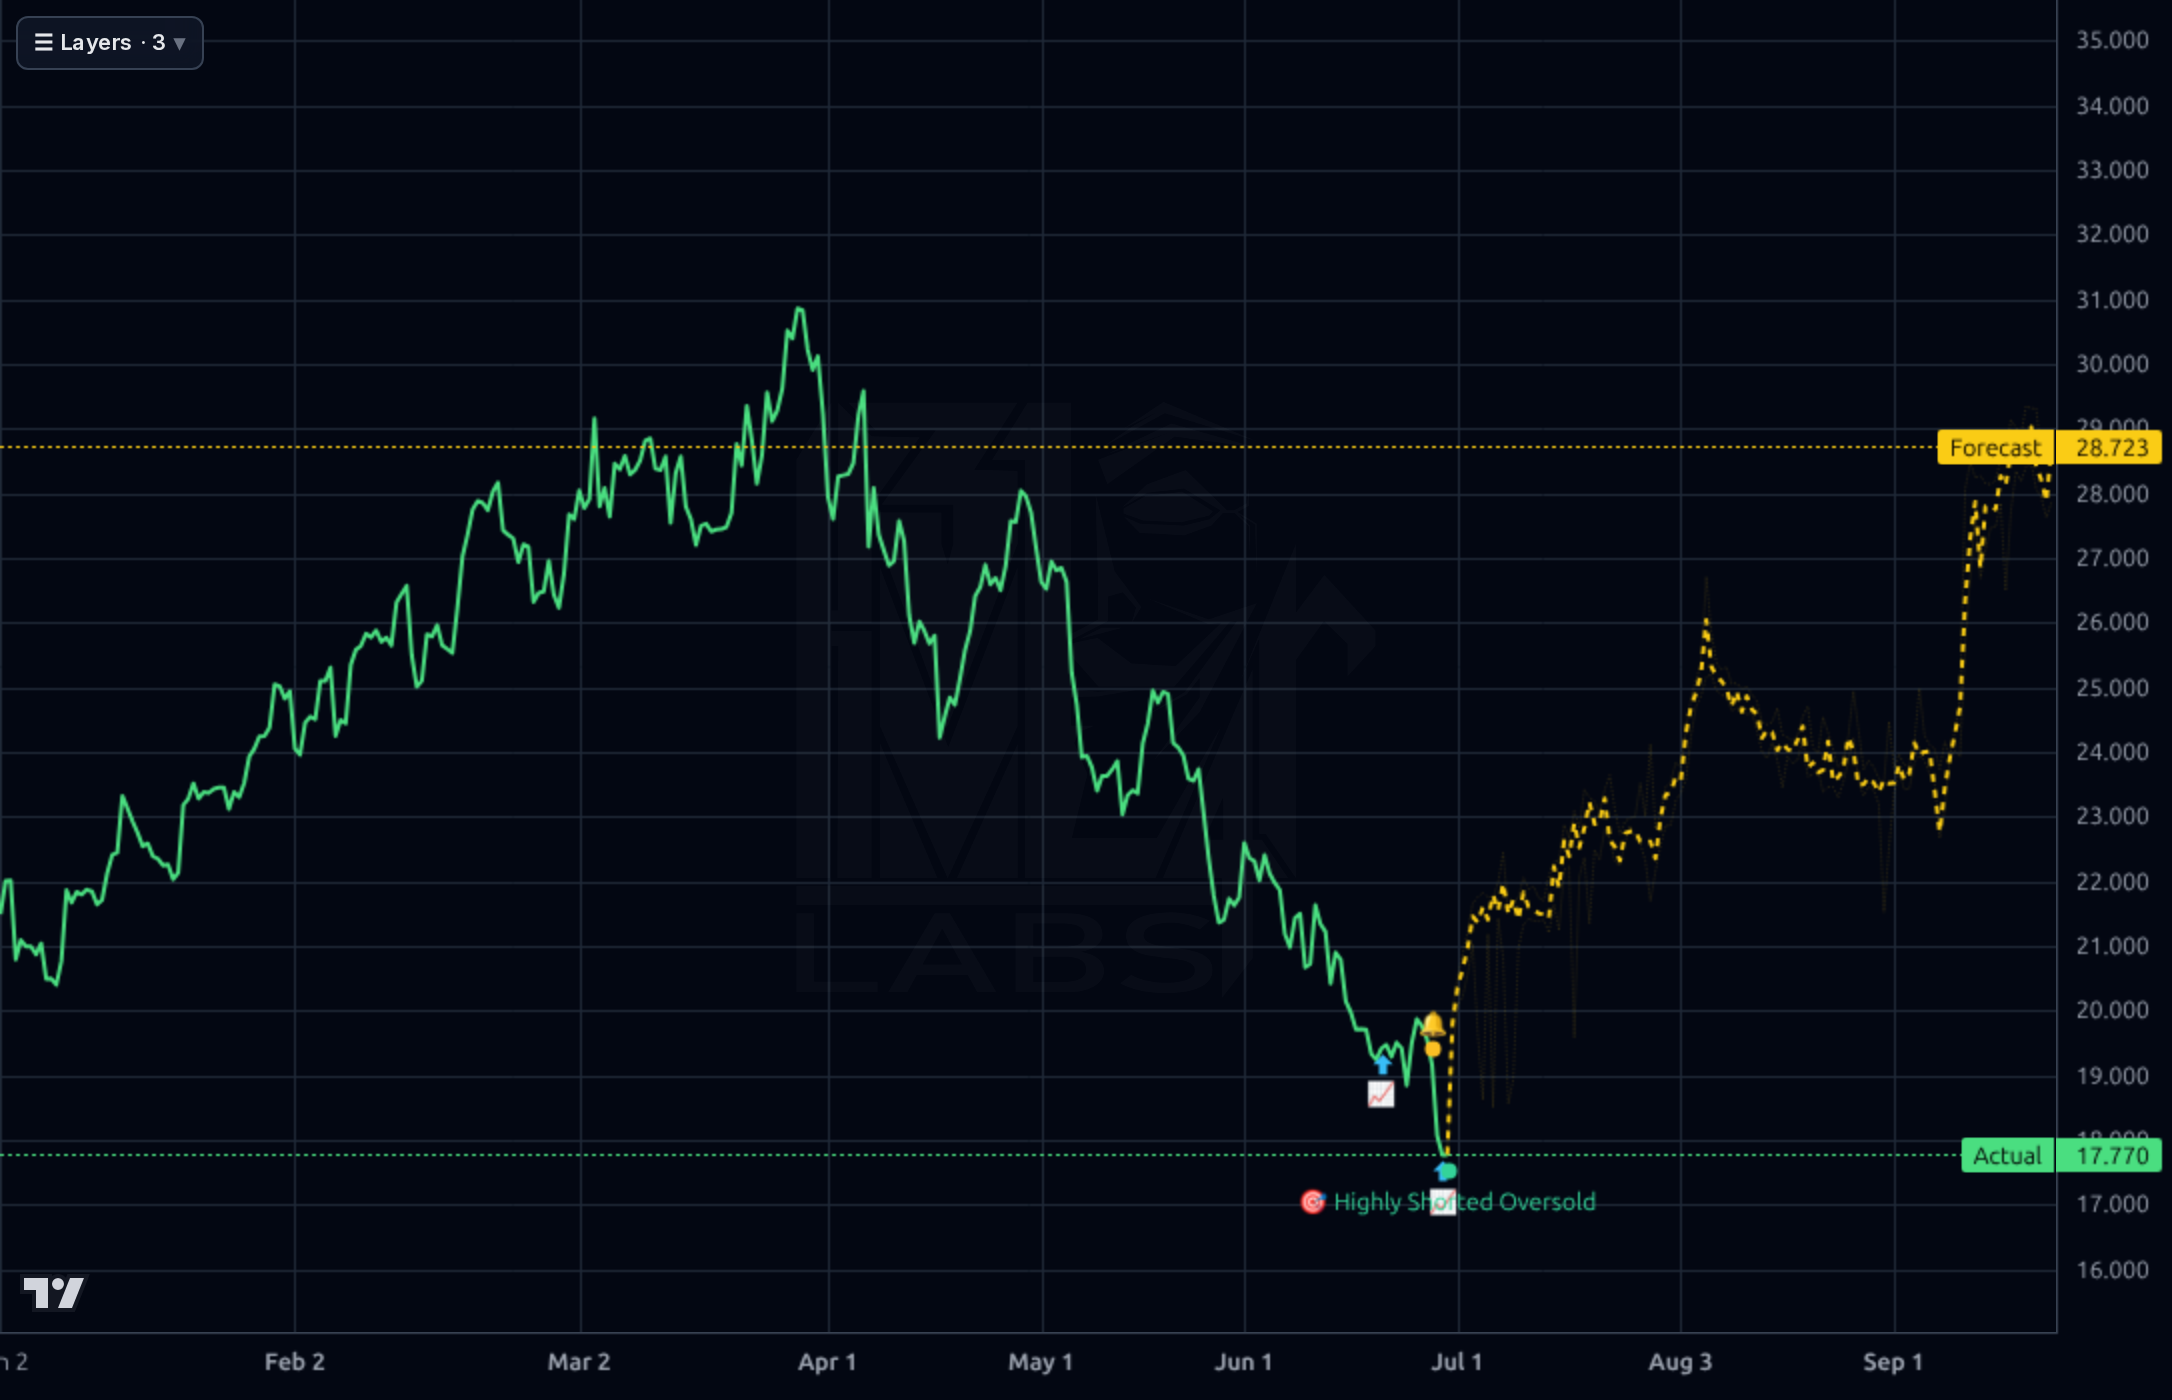
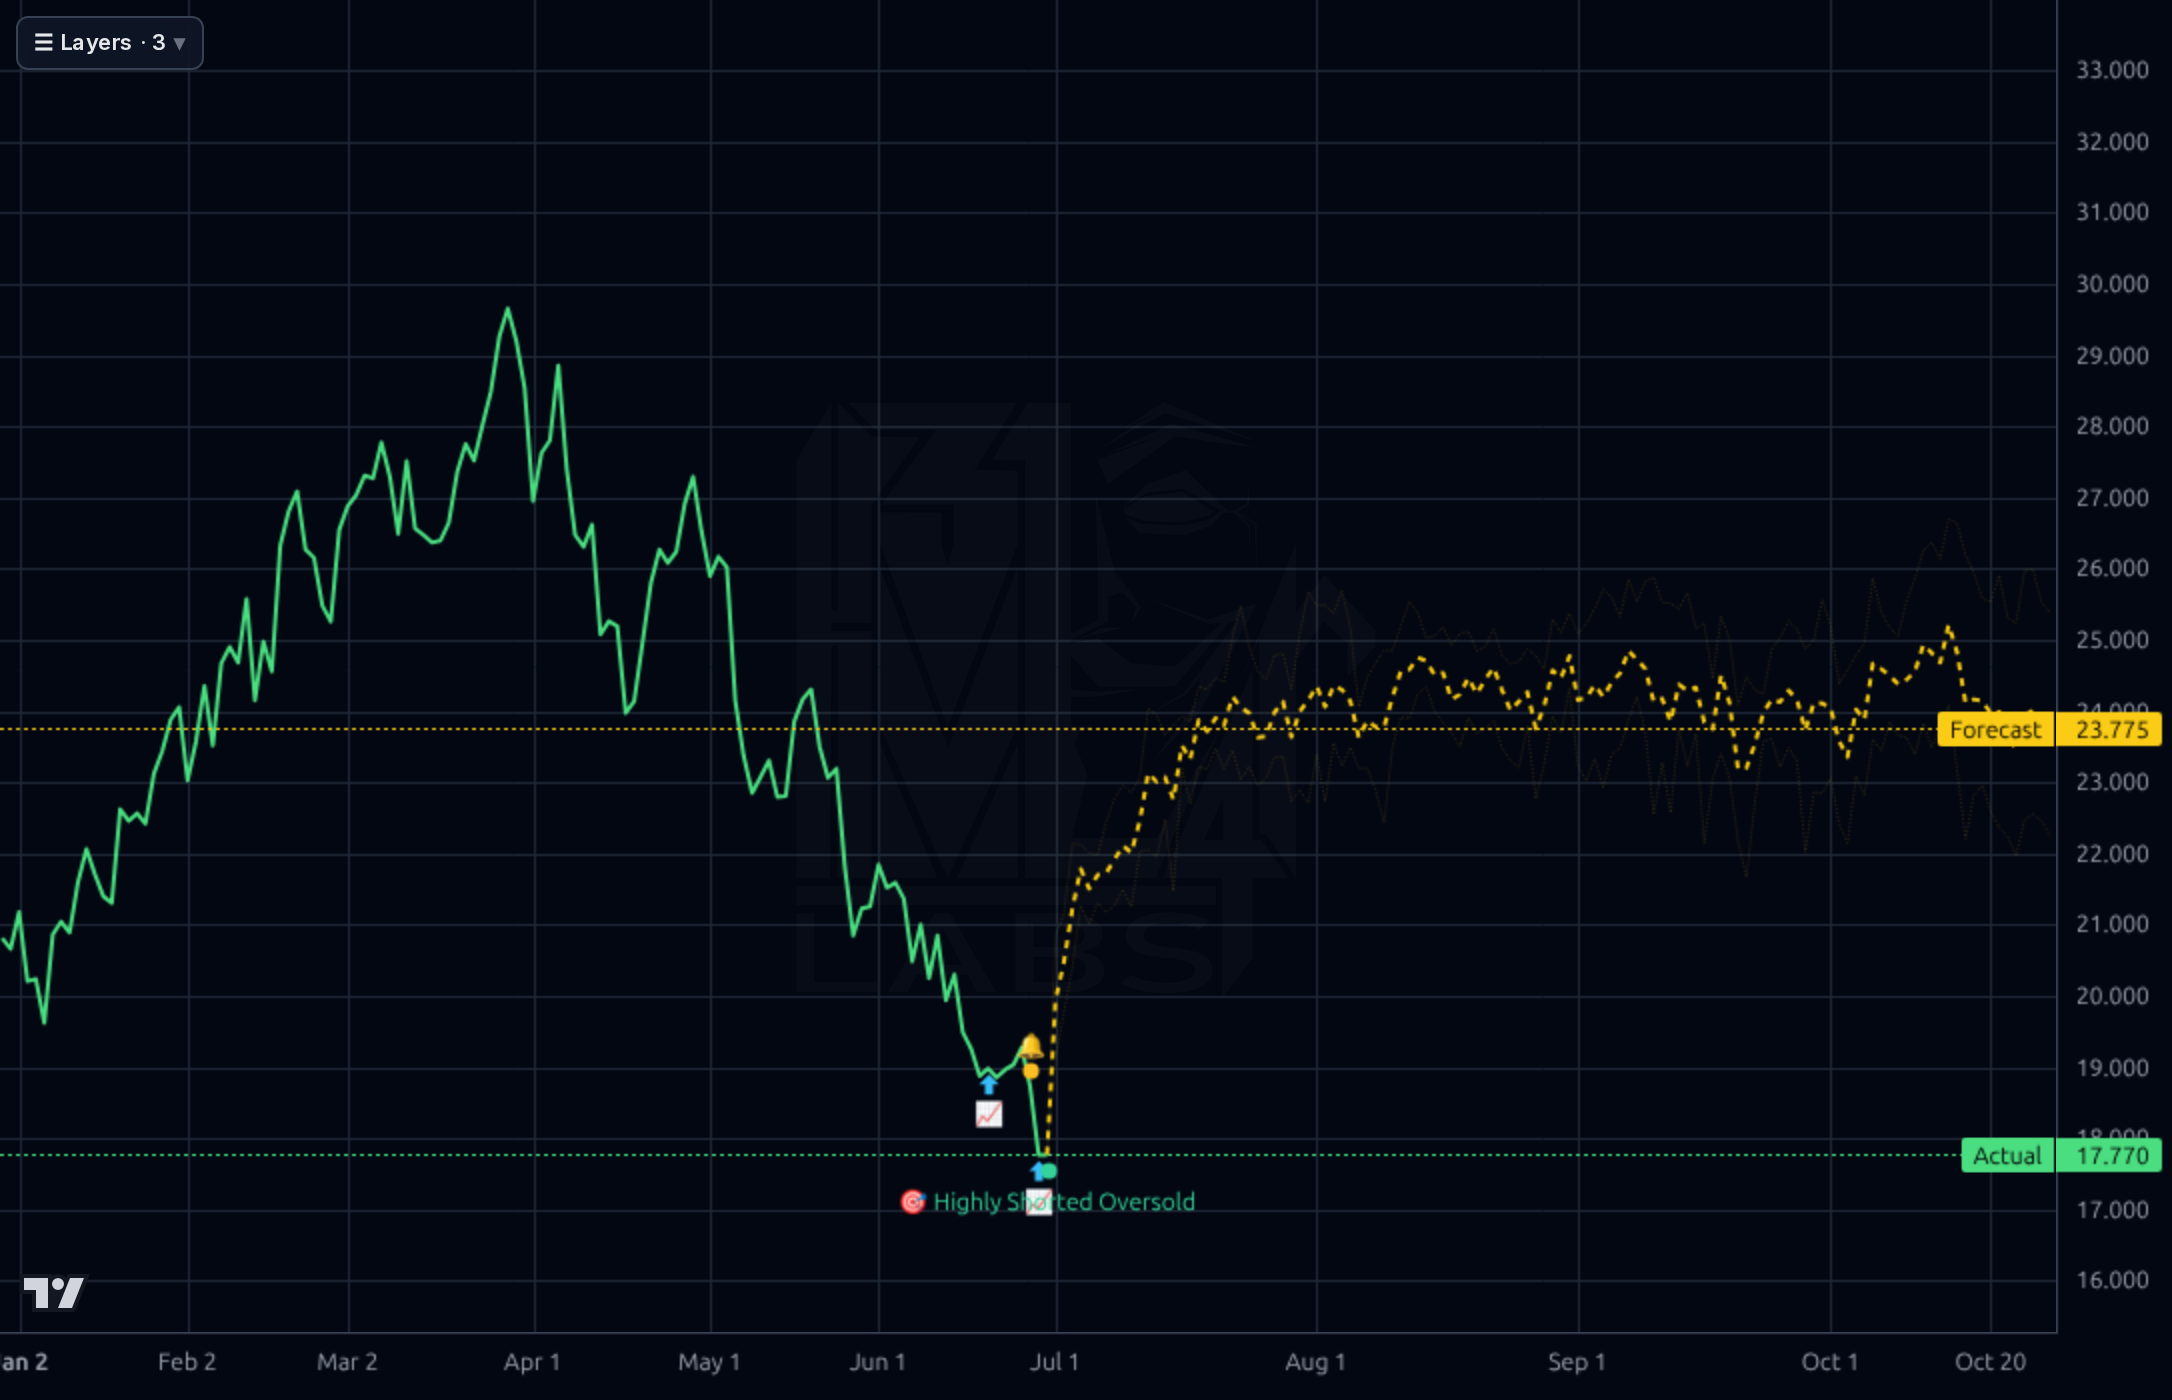
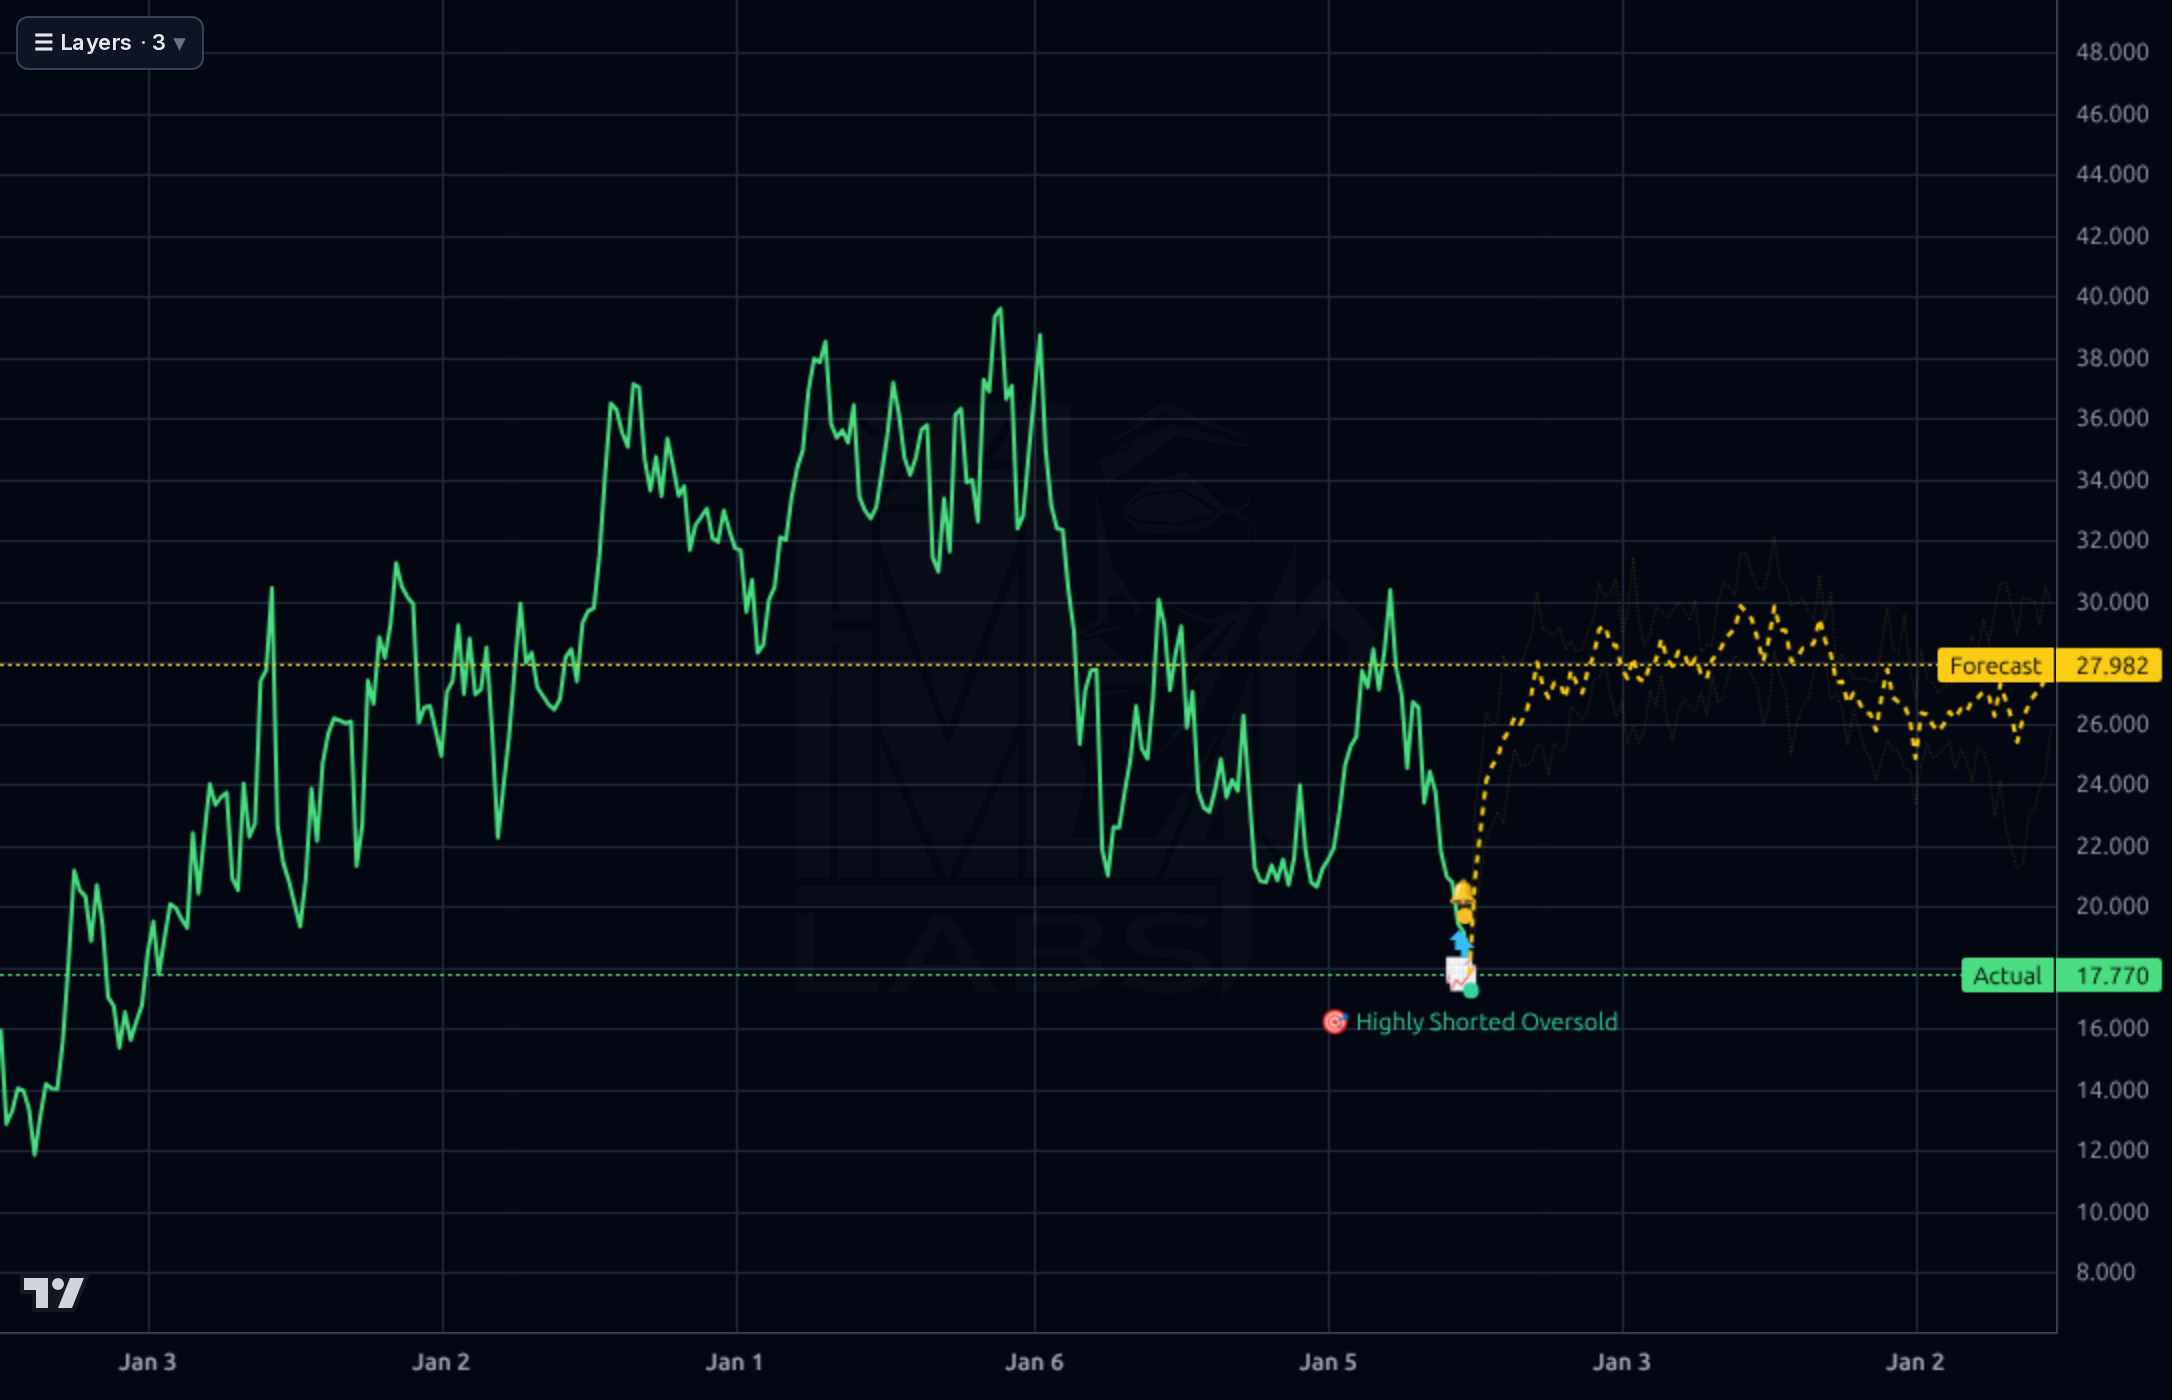
The charts show NOG trading near its 52-week low ($17.76), indicating extreme oversold conditions, which is a key technical signal for potential mean reversion. The 1D chart shows the price has fallen significantly below the yellow forecast band and into 'Highly Shorted/Oversold' territory. While the model's directional accuracy (47%) is below its naive baseline (58%), suggesting caution regarding immediate momentum plays, the oversold condition combined with high short interest suggests potential technical bounce opportunities. The 1W chart shows a clear downtrend but also highlights support near recent lows.
The news flow is dominated by negative analyst sentiment and sector headwinds. Morgan Stanley recently maintained an Underweight rating and lowered its price target to $25, while Raymond James has also cut targets (though reiterating Outperform). These actions suggest institutional skepticism despite the company's positive operational guidance lift regarding 2026 output. The broader energy sector weakness, noted by stocks trading down after geopolitical events, adds macro pressure. The dividend yield remains a key support narrative mentioned in the news.
- Increased production guidance: NOG raised its fiscal 2026 output outlook, signaling operational strength through strong Q1 performance and new acquisitions (Ohio Utica assets, Canadian Duvernay stake).
- High Leverage: The Debt-to-Equity ratio of 142.99 indicates significant financial risk should commodity prices decline or production costs rise.
- Negative Profitability: Persistent negative net margins and trailing EPS (-6.32) suggest the core business is not yet generating sufficient profit to cover debt servicing comfortably.
- Analyst Downgrades: Multiple recent price target cuts from major firms (e.g., MS to $25) indicate that institutional consensus remains bearish despite operational improvements.
Get AI analysis on any stock
This is one of hundreds of Kronos AI reports — scored fundamentals & technicals, bull/base/bear price targets, a multi-horizon plan, and continuously-updated forecasts across the market. Create a free account to explore them all.
Create your free account →Already a member? Sign in · Join our Discord