NOG — AI Stock Forecast & Price Targets
Published 7/6/2026 · A free sample of K3vl4r’s AI-powered analysis.
Kronos price forecasts, scored fundamentals & technicals, and a multi-horizon plan.
View the live NOG price forecast →
NOG is a highly leveraged E&P trading at 52-week lows ($17.95) with a stretched 10% dividend yield backed by a 461% payout ratio and negative TTM EPS of -$6.36. Q1 2026 free cash flow of -$311M against $2.55B debt and a 0.53 current ratio signals real balance sheet stress, and analyst PT cuts (Morgan Stanley to $25, Raymond James to $30) plus the model's own poor directional accuracy on this name argue against chasing the deep-value optics. Base case: range-bound-to-lower into the Q2 print; the dividend and capex trajectory are the binary events.
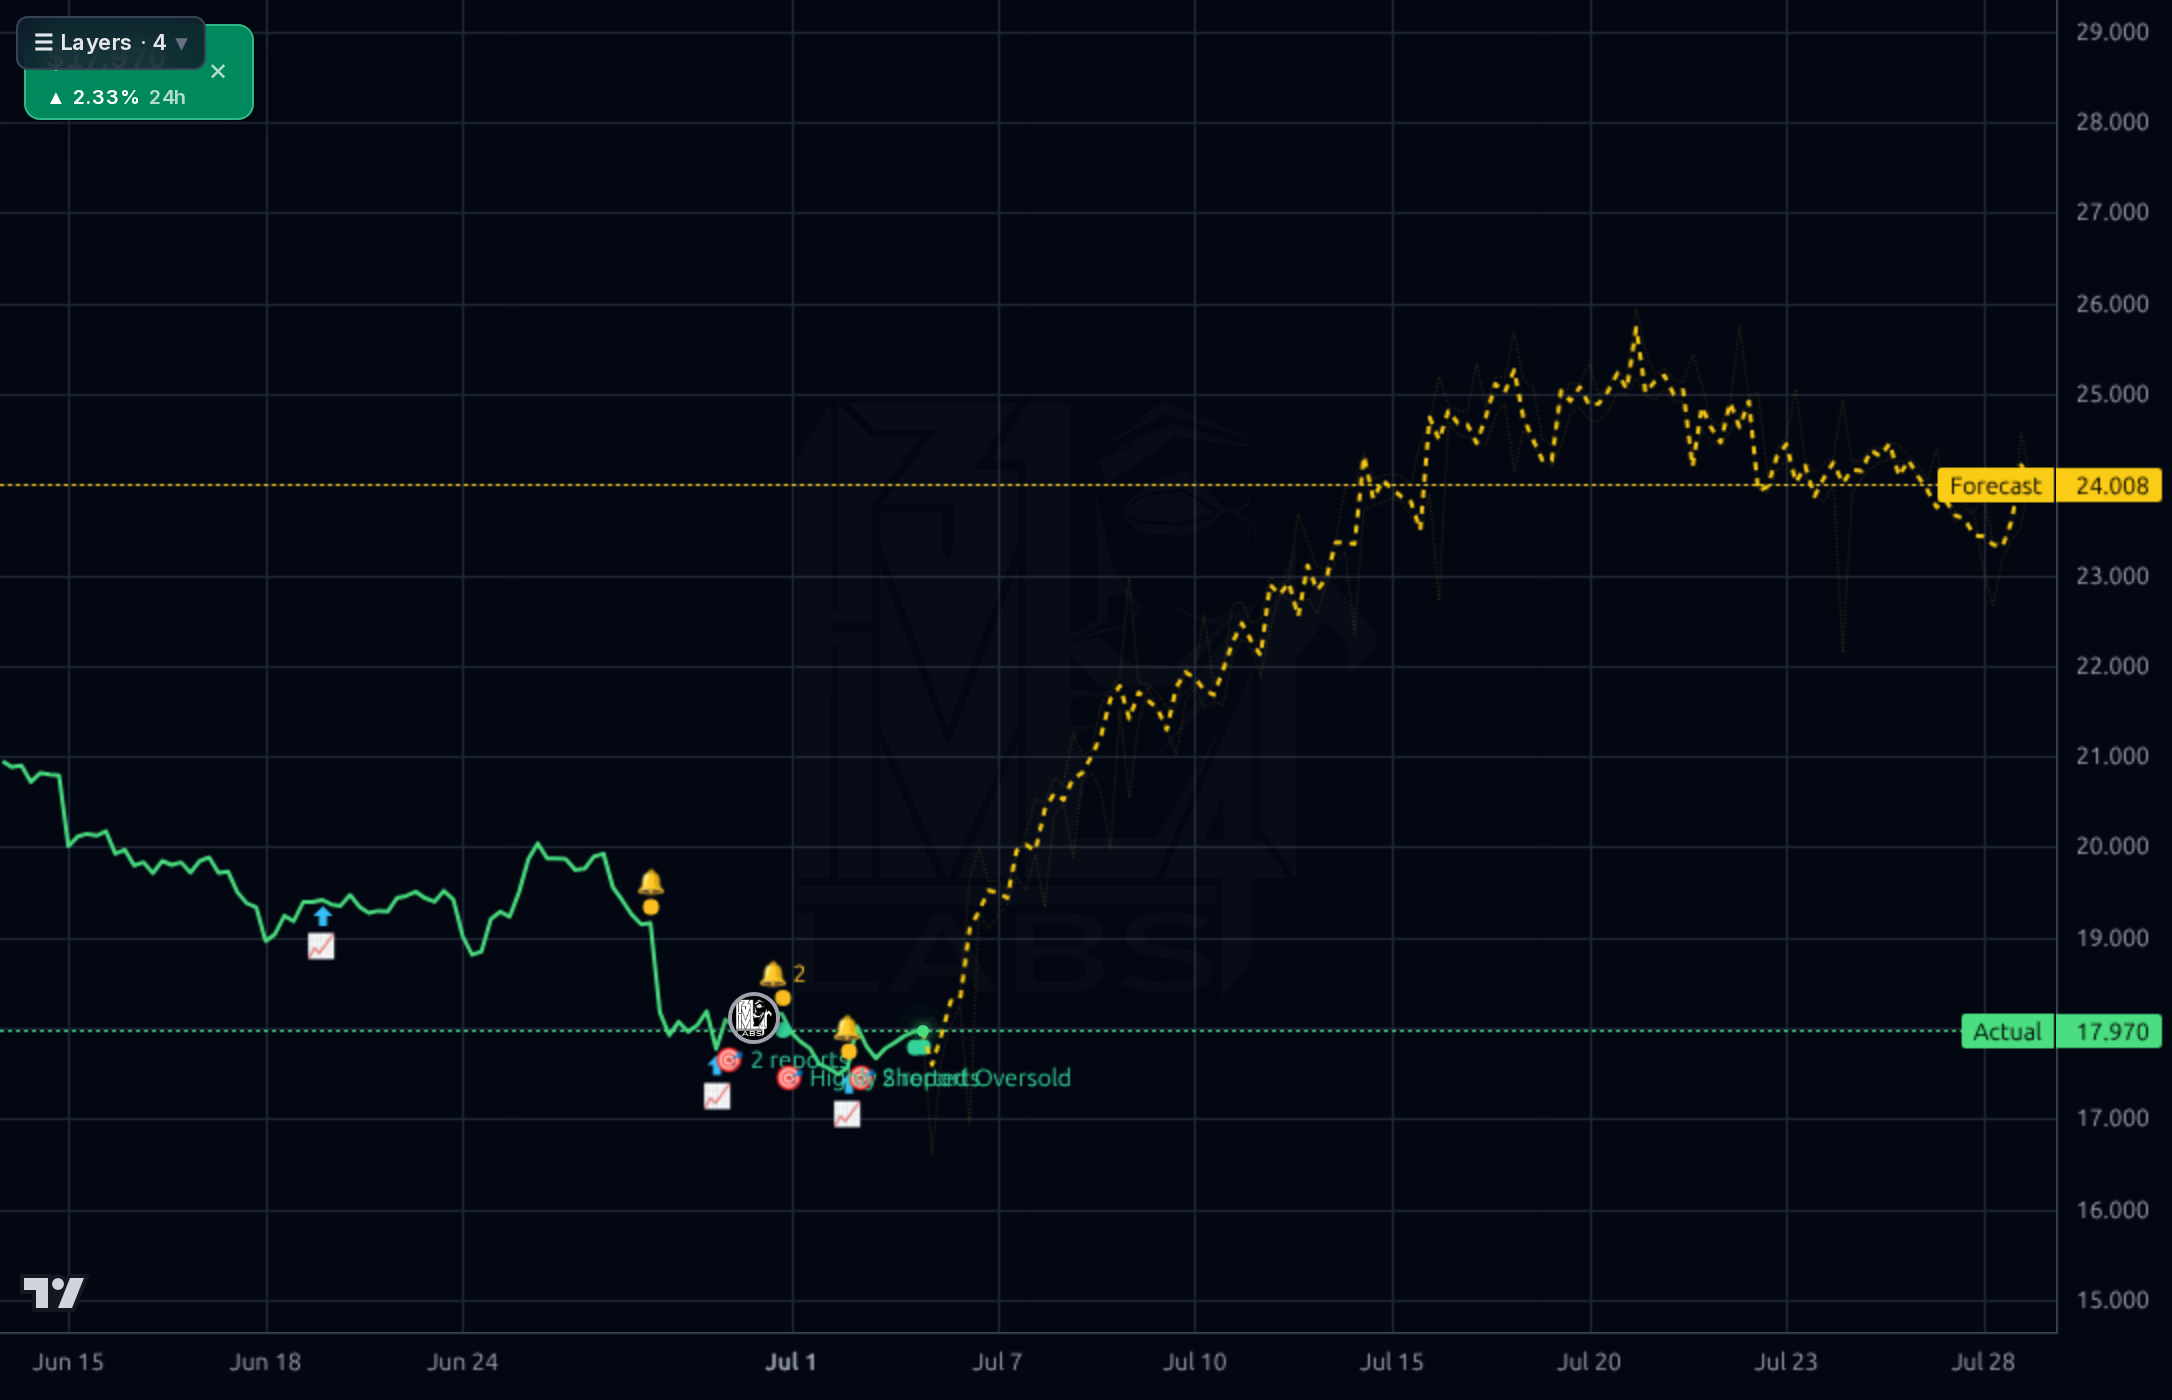
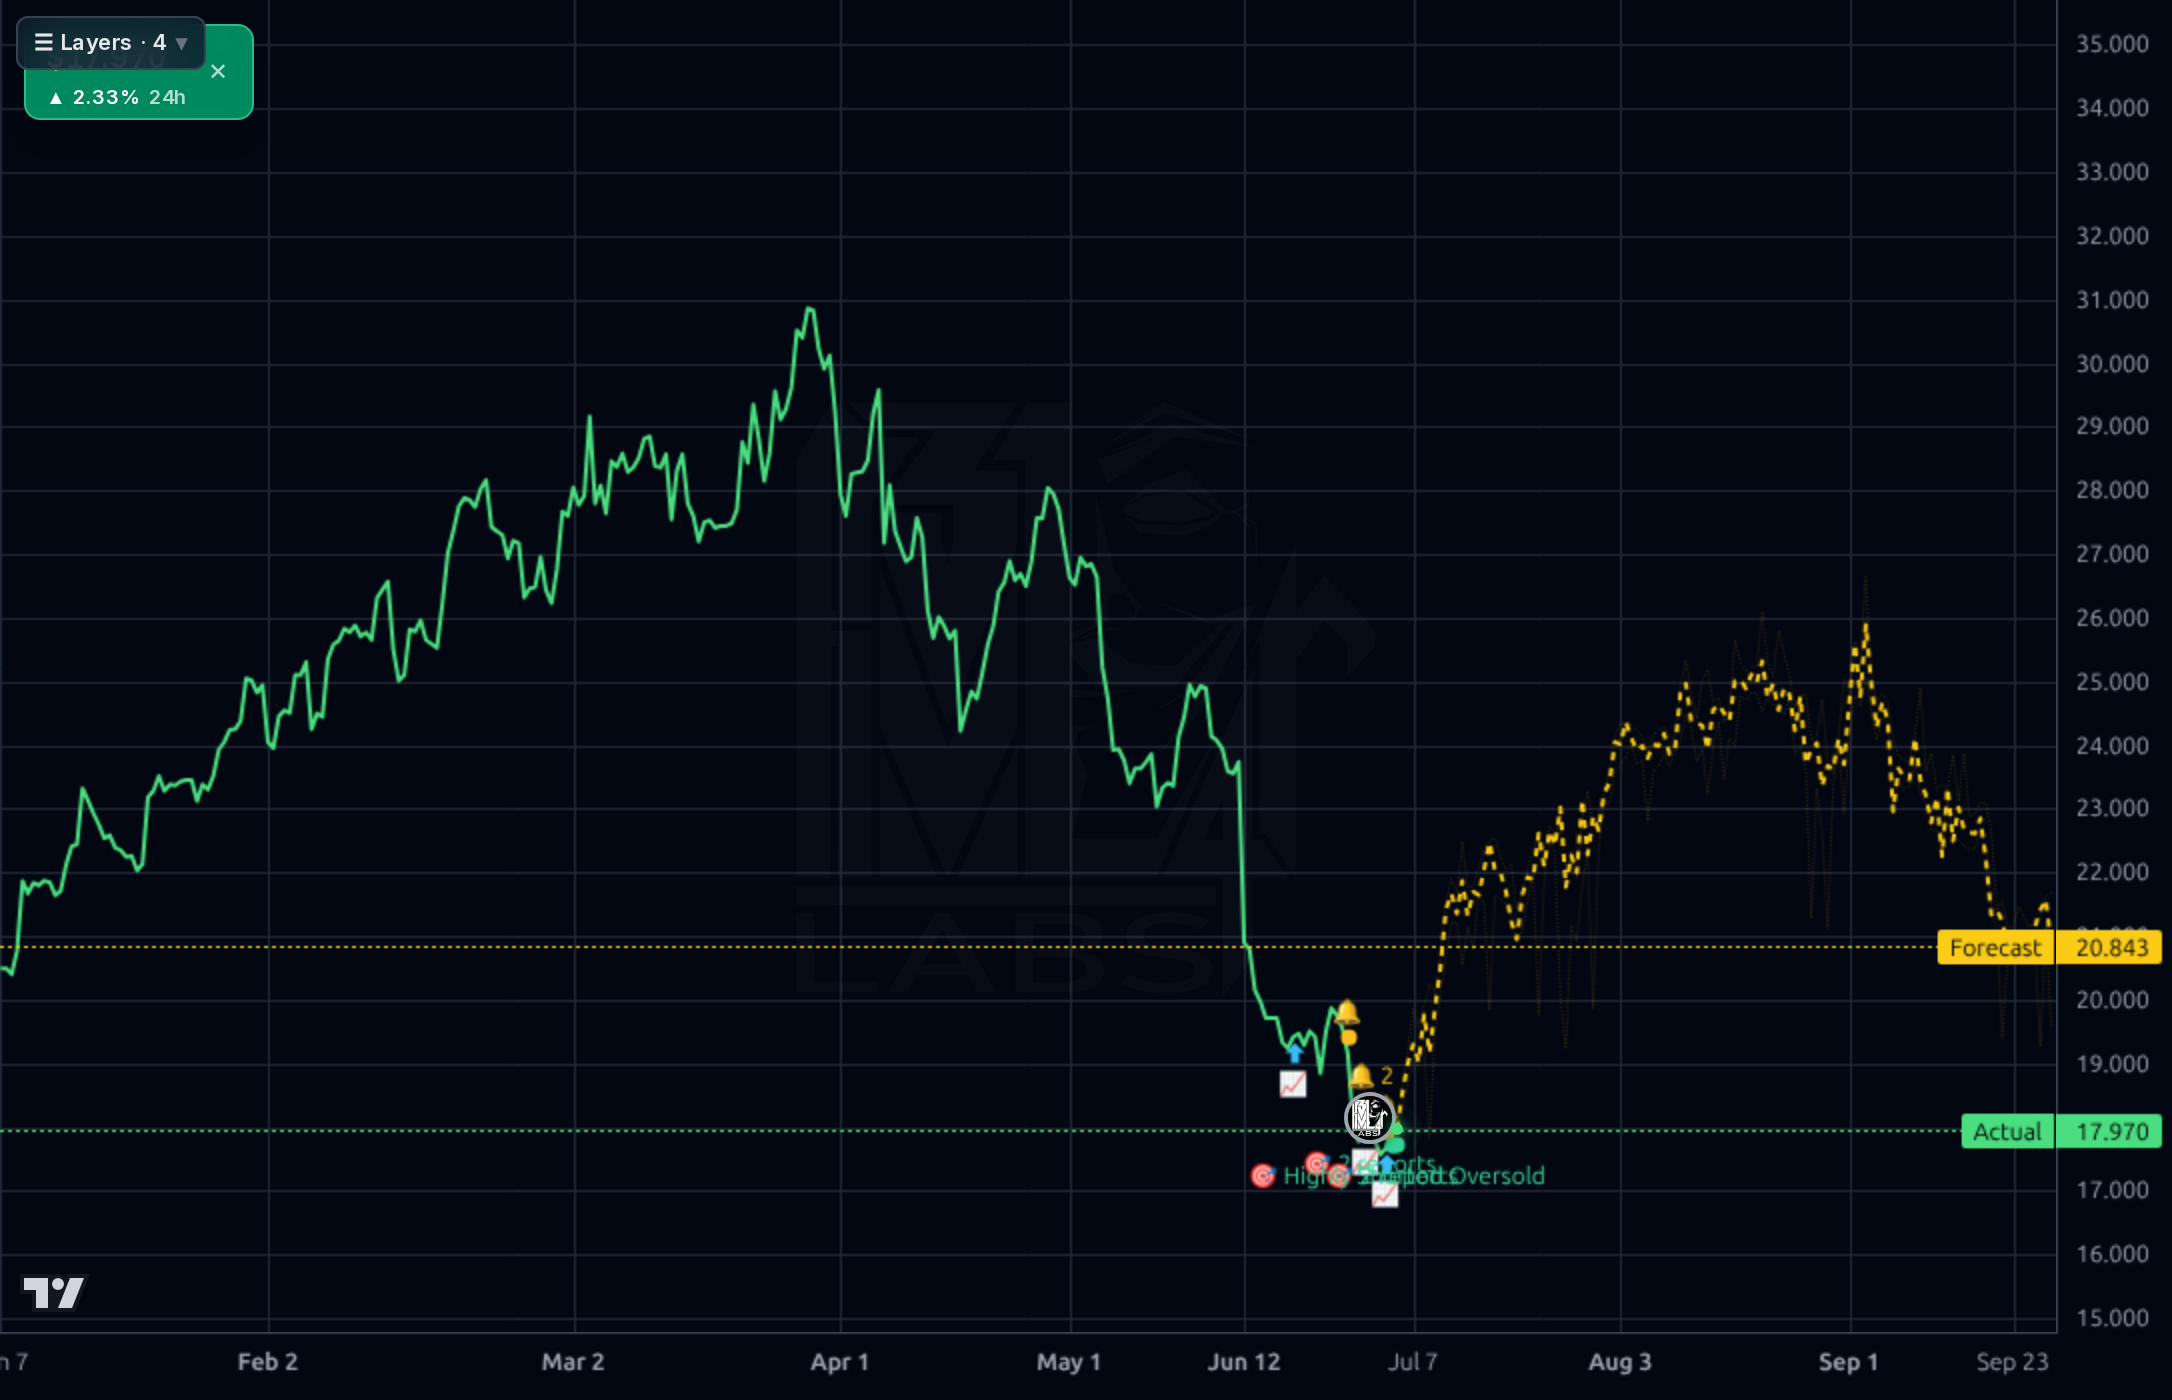
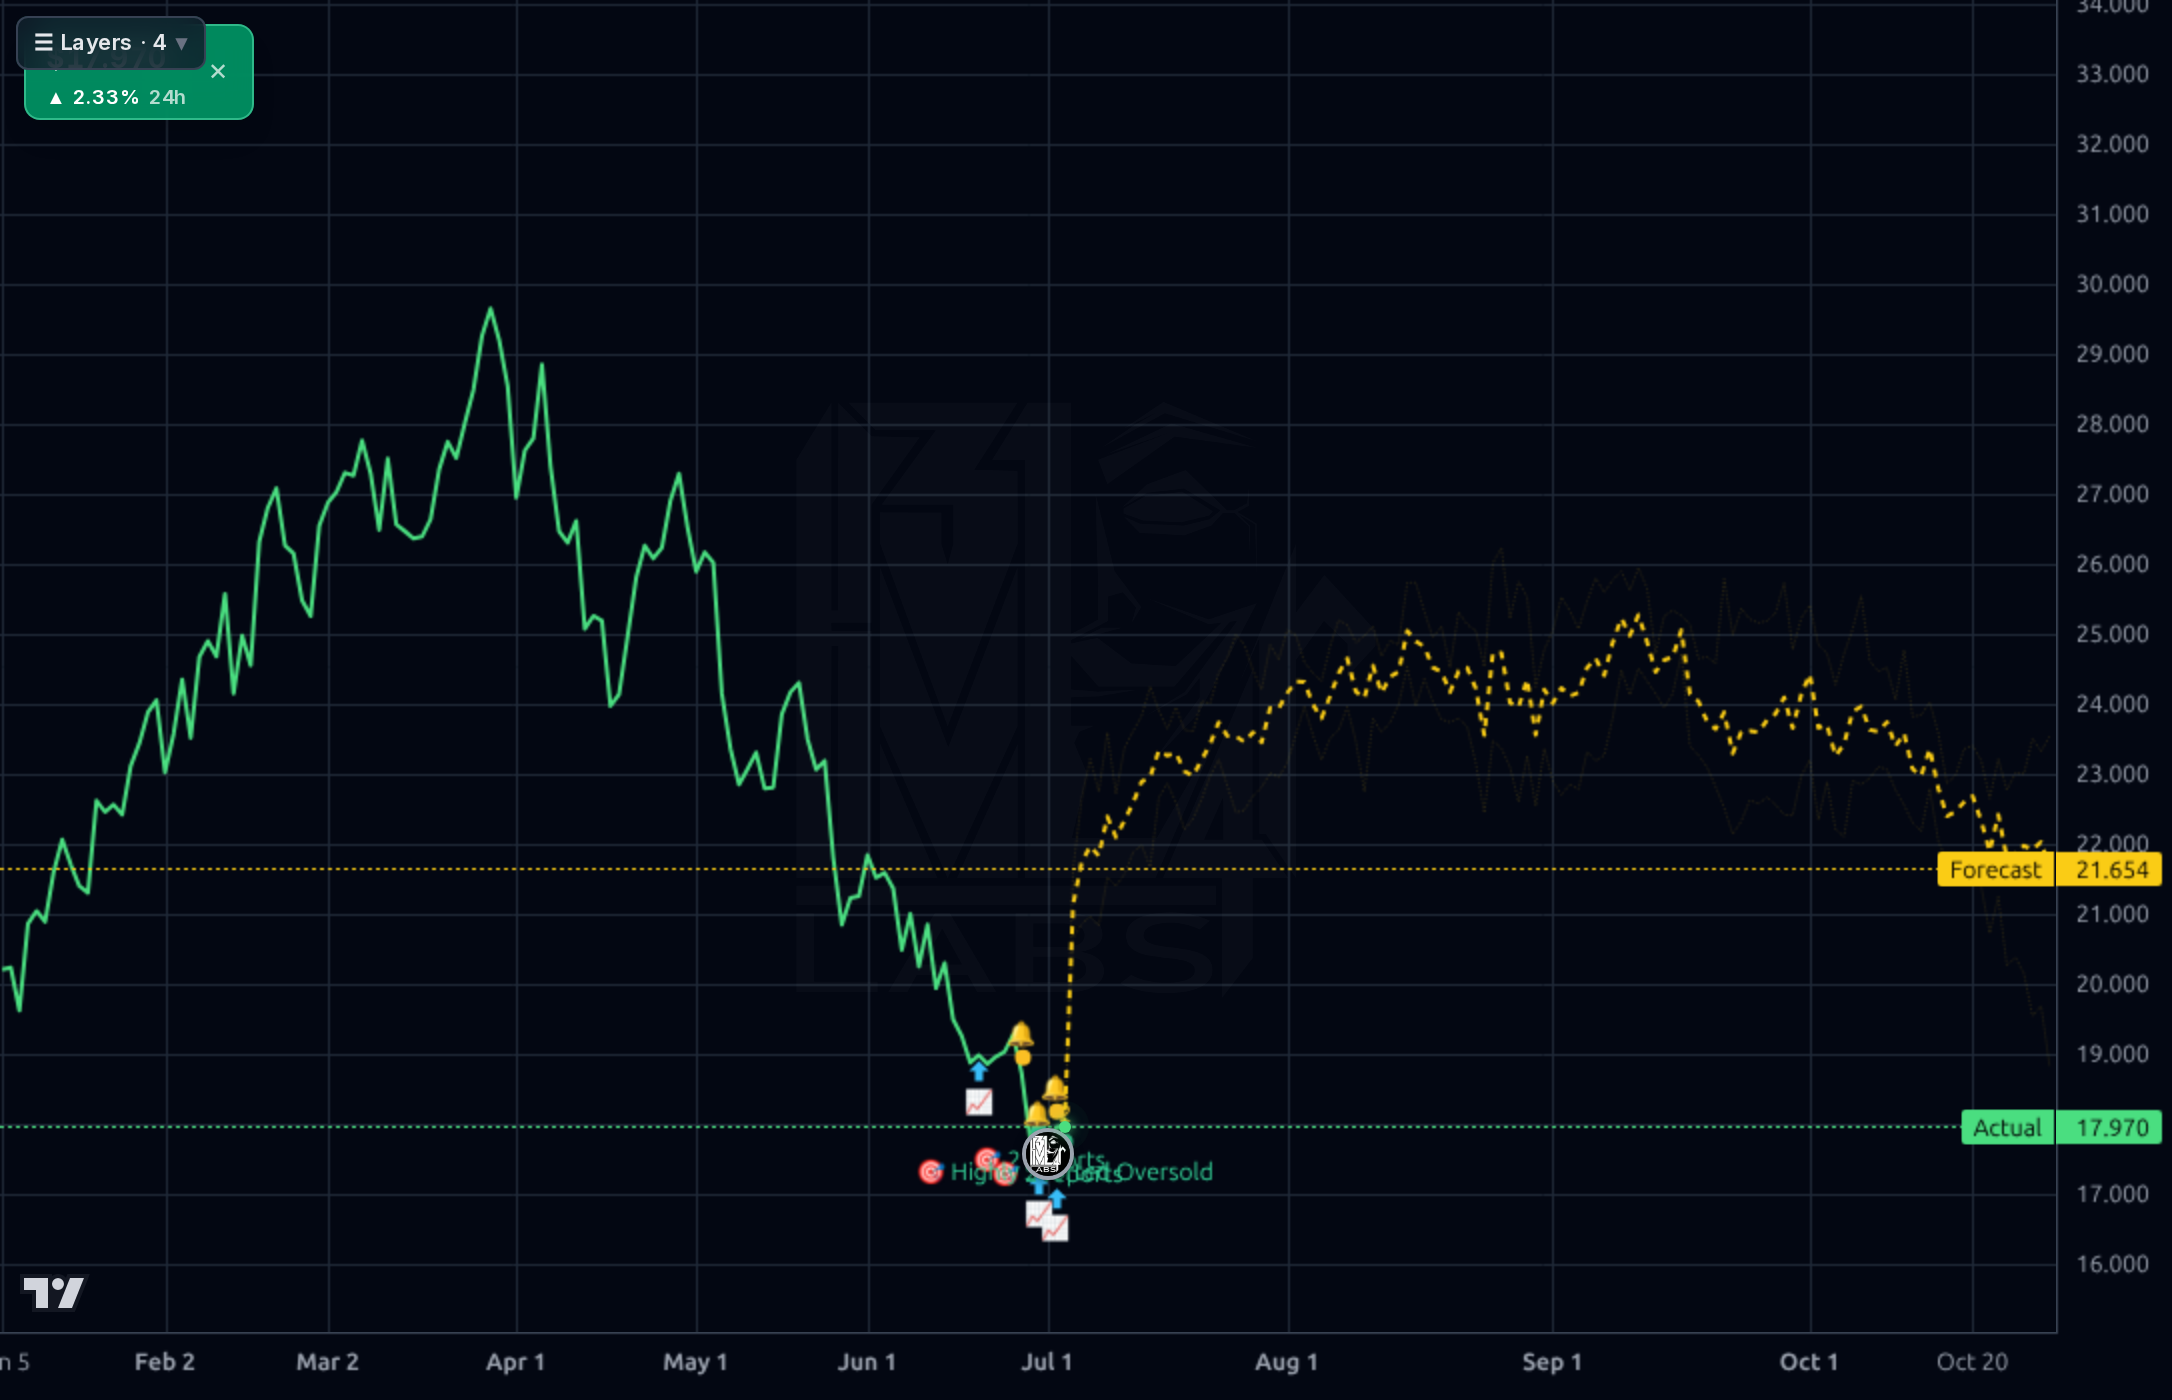
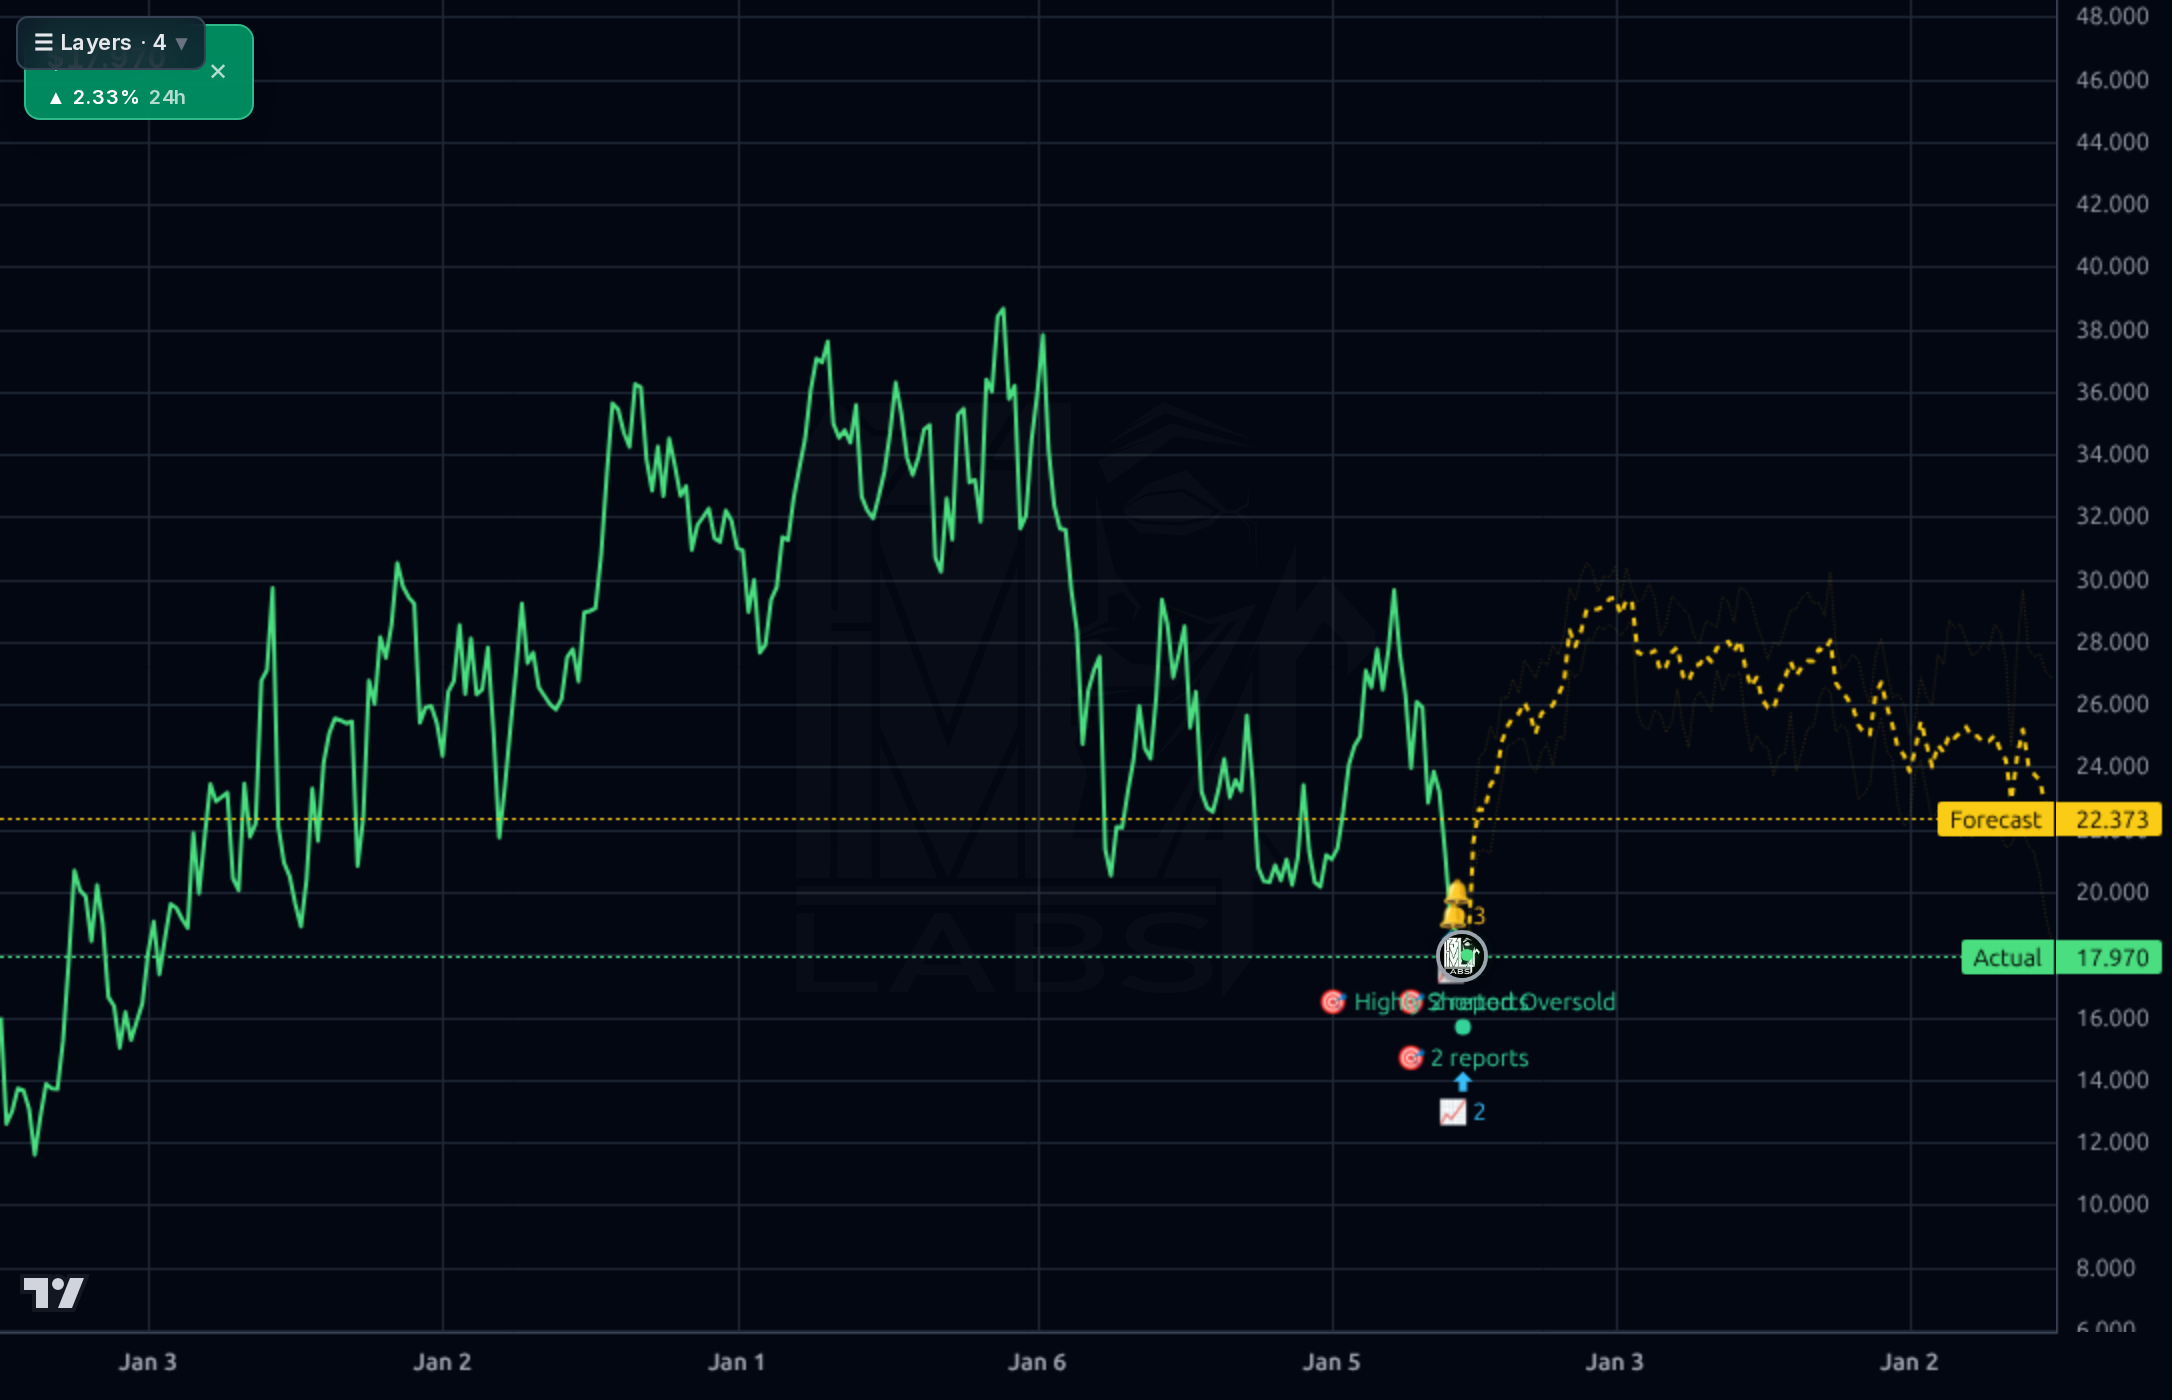
Avoid initiating longs. Price is at 52W lows with negative momentum, RSI 31 (oversold but not capitulatory), and a broken structure across all timeframes. A tradable oversold bounce toward $19.50-$20.85 is possible but the forecast model has been unreliable at this timeframe — do not size to it. For existing holders, tight stop below $17.30. For new money, wait for either (a) a weekly close back above the 20-SMA (~$19.70) with volume, or (b) an explicit capital allocation/dividend update. Invalidation of any short-term long: daily close below $17.30 opens the mid-teens.
Base case: NOG grinds sideways to modestly lower into the Q2 2026 print (late July/early August), with the dividend as the binary catalyst. If management preserves the payout AND capex normalizes back toward maintenance levels while oil stabilizes >$65, a re-rate to $22-24 is achievable (bull). If the Q2 print shows another quarter of deeply negative FCF, expect a dividend cut and a re-test of $14-15 (bear). Expected 6-month total return range: -20% to +25% including dividends, skewed to the downside. Change my mind: two consecutive quarters of positive FCF, an explicit deleveraging plan, or oil >$75 sustainably.
Multi-year, NOG is a non-op working interest aggregator whose terminal value is a function of Bakken/Permian/Uinta well economics and disciplined capital allocation. If management can prove they can generate normalized FCF of $400-500M on maintenance capex, the equity is worth materially more than current. The structural risk is that the model is inherently pro-cyclical and leveraged — a prolonged oil downcycle below $55 would force asset sales or dilutive equity raises, and the current balance sheet does not have the cushion to absorb a 2015/2020-style tape without capital structure damage. Base long-term thesis is neutral: this is a trading vehicle for oil bulls, not a compounder.
The fundamental picture has deteriorated sharply. Q1 2026 revenue of $544M was up sequentially from Q4 2025 ($451M), but net income was -$523M and EBITDA swung to -$456M, suggesting a large non-cash impairment tied to commodity price weakness. TTM profit margin is -30% and ROE is -29.8%. Operating cash flow remains real ($1.42B TTM, $324M in Q1) but capex of $635M in Q1 alone drove FCF to -$311M — a stark reversal from the modestly positive FCF prints in mid-2025. The balance sheet is stretched: $2.55B total debt against $37M cash, D/E of 1.43, and current ratio of 0.53. The 10.03% dividend yield is being paid out of a 461% payout ratio on negative earnings, which is not durable without commodity recovery or capex cuts. Forward P/E of 4.44 and P/B of 1.06 look optically cheap, but the market is pricing tail risk to the dividend and the equity itself, not mispricing normalized earnings. Institutional ownership >100% (short-covered borrowing) and 16.7% short float confirm crowded skepticism.
Across all four timeframes the tape is broken. On the daily and weekly, NOG has round-tripped from ~$38 (early-year highs) to $17.95, now sitting essentially at the 52-week low ($17.40) — that is -42.6% from the 52-week high, -25.3% below the 200-SMA, -20.6% below the 50-SMA, and -9.0% below the 20-SMA. RSI at 31.4 is oversold but not washed out, and price closed the week -9.1%, i.e. still trending down rather than basing. The 1h and 4h charts show a shallow reflex bounce off ~$17 lows with the model's forecast band projecting a rebound to $23-$24 over the coming weeks, but the model's realized directional accuracy on this name is 0% at 1wk vs a 100% naive baseline and 39% at 1d vs 71% naive — the forecast is unreliable in this regime and should be heavily discounted. Key levels: support $17.40 (52W low) then a vacuum to the mid-teens; resistance $19.50 (recent swing), $20.85 (declining 20-SMA area), then $22-23 where prior supply sits.
The signal in the newsflow is uniformly negative on the sell side and macro: Morgan Stanley reiterated Underweight and cut its PT from $29 to $25 (June 29), and Raymond James, while keeping Outperform, cut from $35 to $30 (June 15) and again referenced in a June 22 note discussing long-term production growth. The stock has been whipsawed by oil price action — up on June 10 as US strikes on Iran spiked crude, then down again on June 16 as a US-Iran peace framework crushed oil back down. Noise: retail chat groups and generic 'target price' tweets carry no informational value; the 86% bullish retail sentiment against a broken chart and negative broker revisions is a mild contrarian yellow flag. The core signal: even the bulls on the sell side are cutting numbers, and the equity is trading well below every published target because the market is discounting a possible dividend action and/or continued commodity weakness.
- Production guidance increases from Bakken/Permian non-op interests provide a volume tailwind if executed — cited in Raymond James June 22 note supporting long-term production growth thesis
- Q1 2026 capex of $635M was elevated vs. $308M in Q4 2025; a step-down back to ~$300M/quarter would restore positive FCF at current strip
- Forward EPS estimate of $4.04 implies a return to profitability; hitting even 60% of that would collapse the forward P/E to a sub-6x multiple against peers
- Potential opportunistic acquisitions of distressed non-op interests if commodity weakness persists — consistent with the company's historical M&A-driven growth model
- Dividend cut risk is acute: 461% payout ratio on negative TTM EPS and Q1 FCF of -$311M make the current $1.80 annualized payout mathematically unsustainable without commodity recovery
- Balance sheet fragility: $2.55B debt vs. $37M cash, current ratio 0.53, D/E 1.43 — limited cushion for a prolonged oil downcycle
- Commodity price sensitivity: sustained WTI below $55-60 threatens both cash flow and asset carrying values (Q1 impairment already visible in -$456M EBITDA print)
- Sell-side de-rating in progress: Morgan Stanley $25 UW, Raymond James cut $35→$30; further PT cuts likely if Q2 disappoints
- Short interest at 16.7% of float creates squeeze potential on any positive surprise but also signals professional skepticism
- Model forecast unreliability: 0% directional accuracy at 1wk vs 100% naive baseline on this name means the projected rebound to $22-24 should be heavily discounted
Get AI analysis on any stock
This is one of hundreds of Kronos AI reports — scored fundamentals & technicals, bull/base/bear price targets, a multi-horizon plan, and continuously-updated forecasts across the market. Create a free account to explore them all.
Create your free account →Already a member? Sign in · Join our Discord