OLLI — AI Stock Forecast & Price Targets
Published 7/8/2026 · A free sample of K3vl4r’s AI-powered analysis.
Kronos price forecasts, scored fundamentals & technicals, and a multi-horizon plan.
View the live OLLI price forecast →
OLLI presents a fundamentally sound bargain retailer with strong historical margins and cash flow generation, trading at significant discounts relative to its 52-week high ($141.74) and analyst targets. The current price action suggests deep cyclical weakness rather than structural failure, making staged accumulation attractive despite unreliable short-term technical signals.
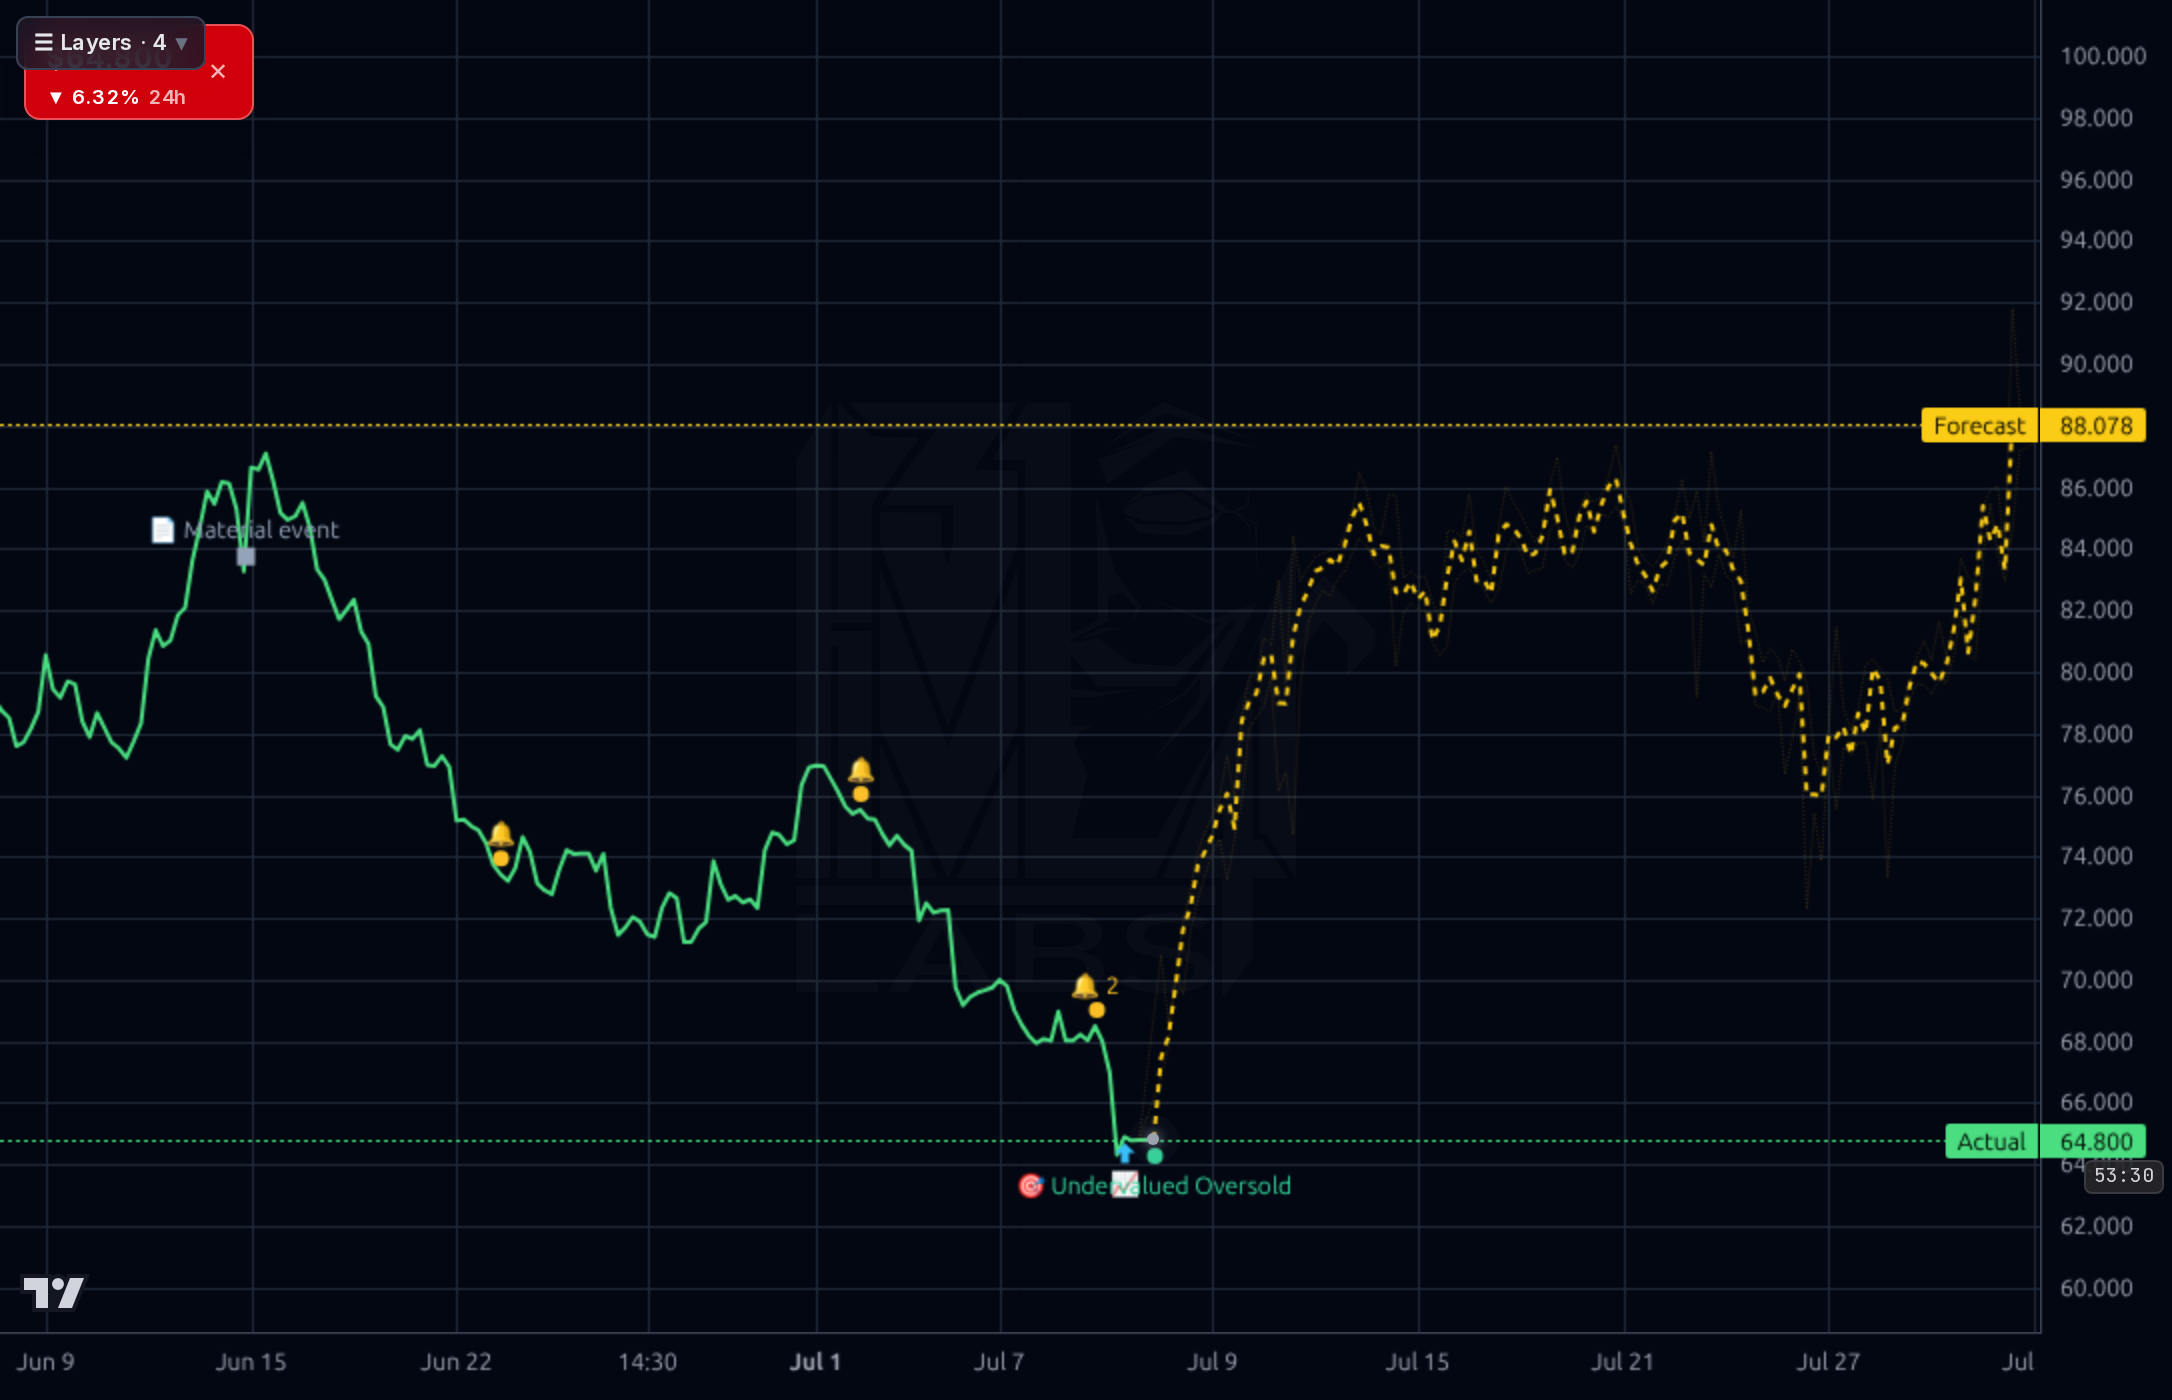
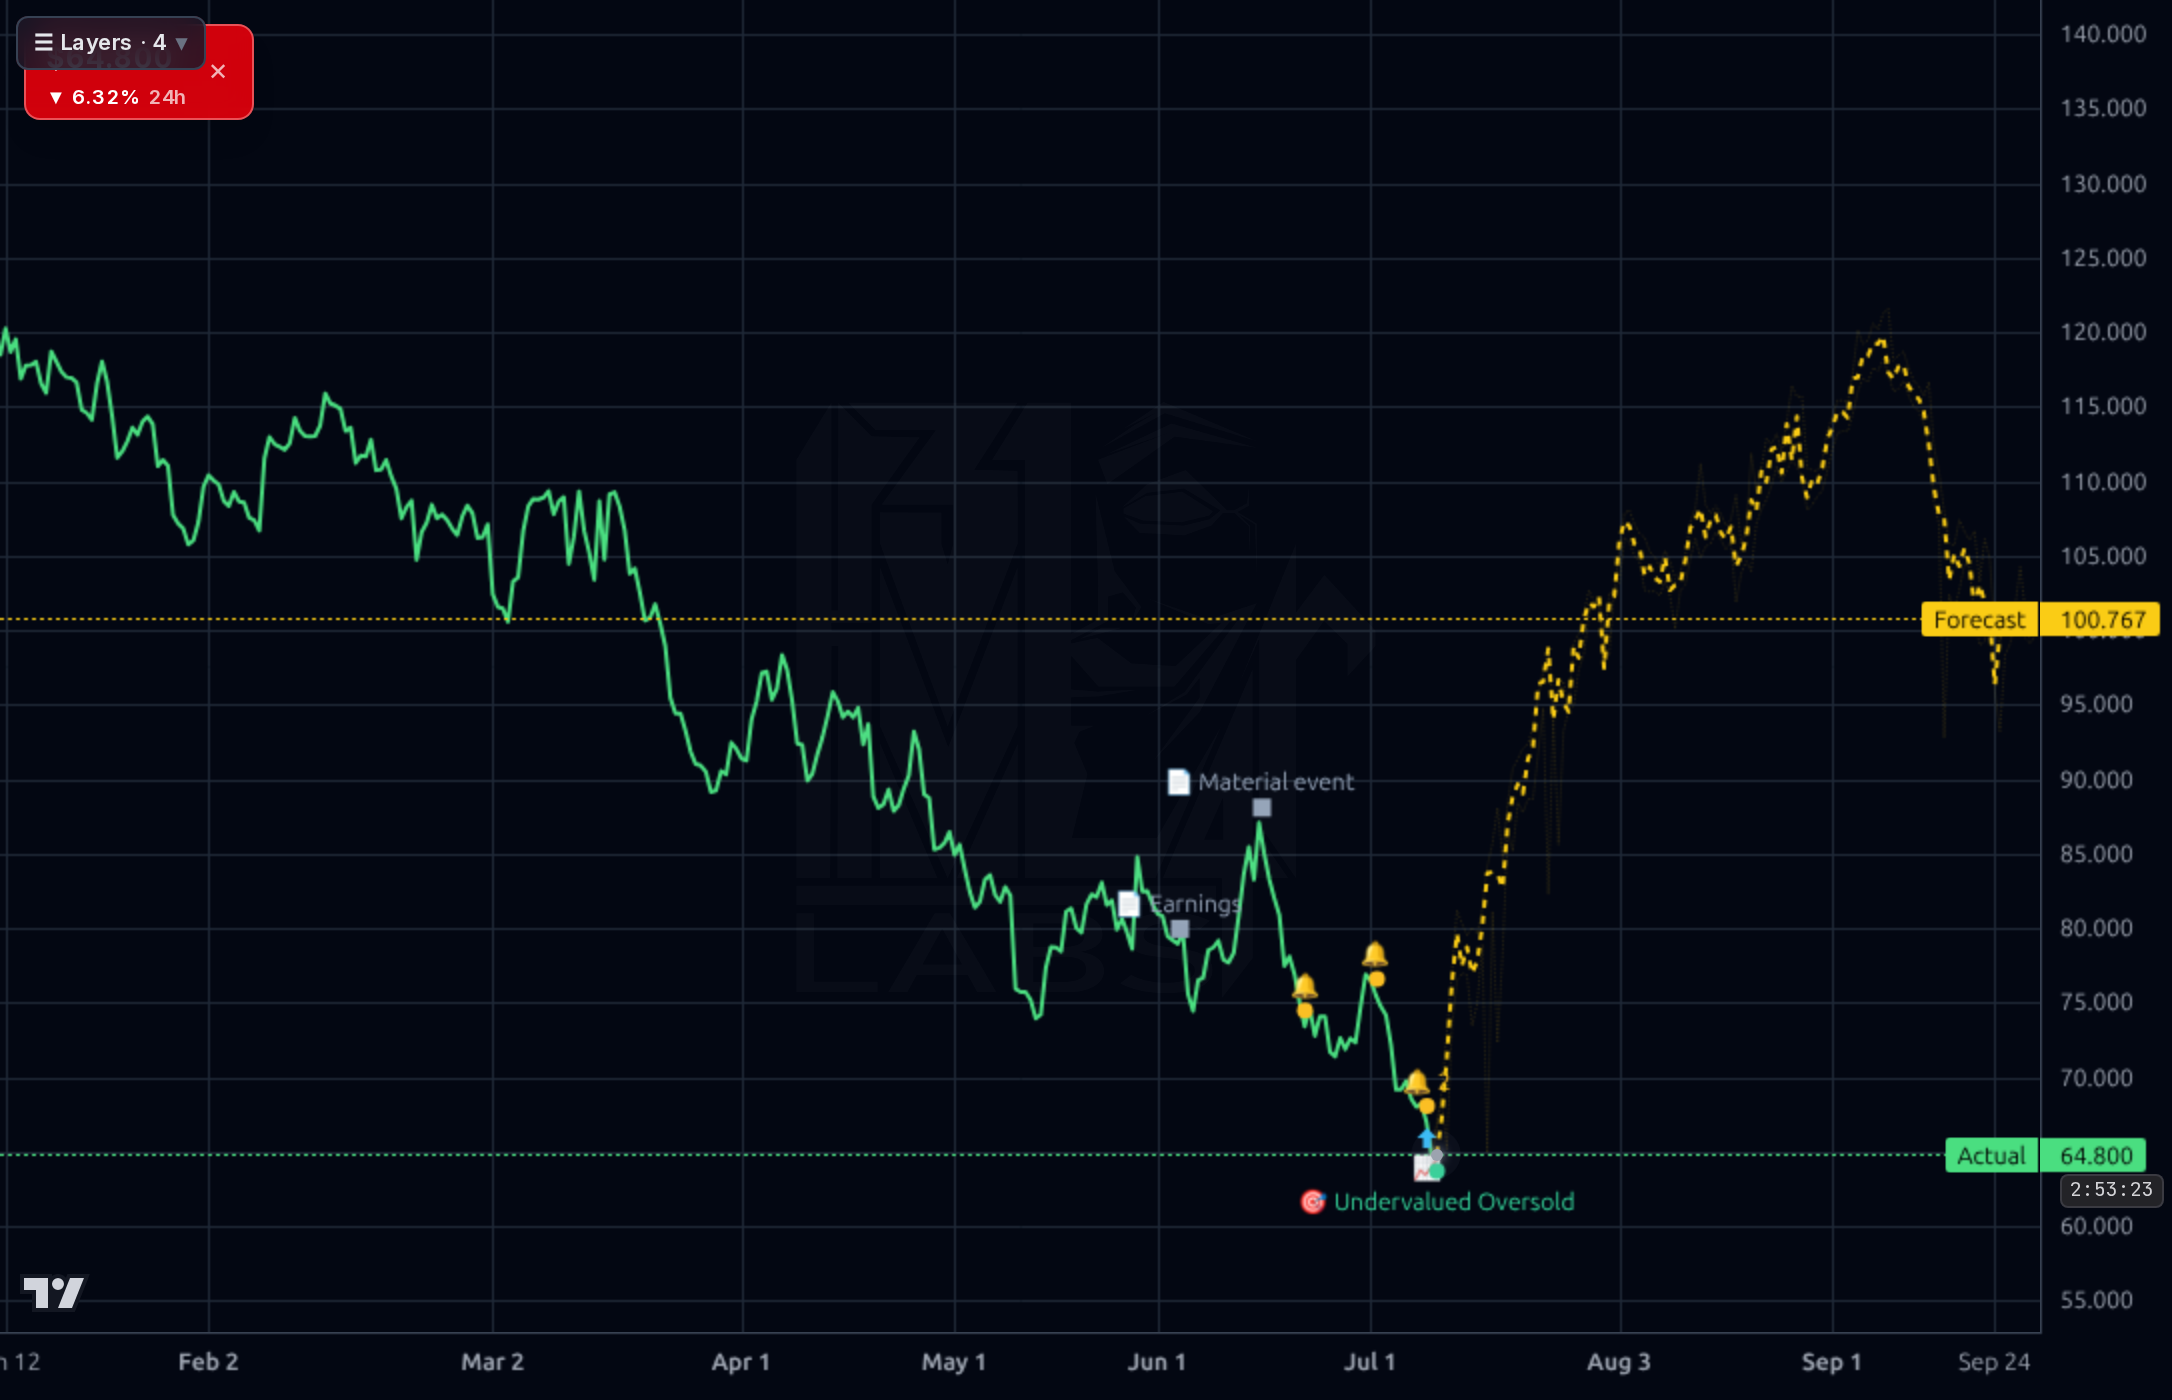
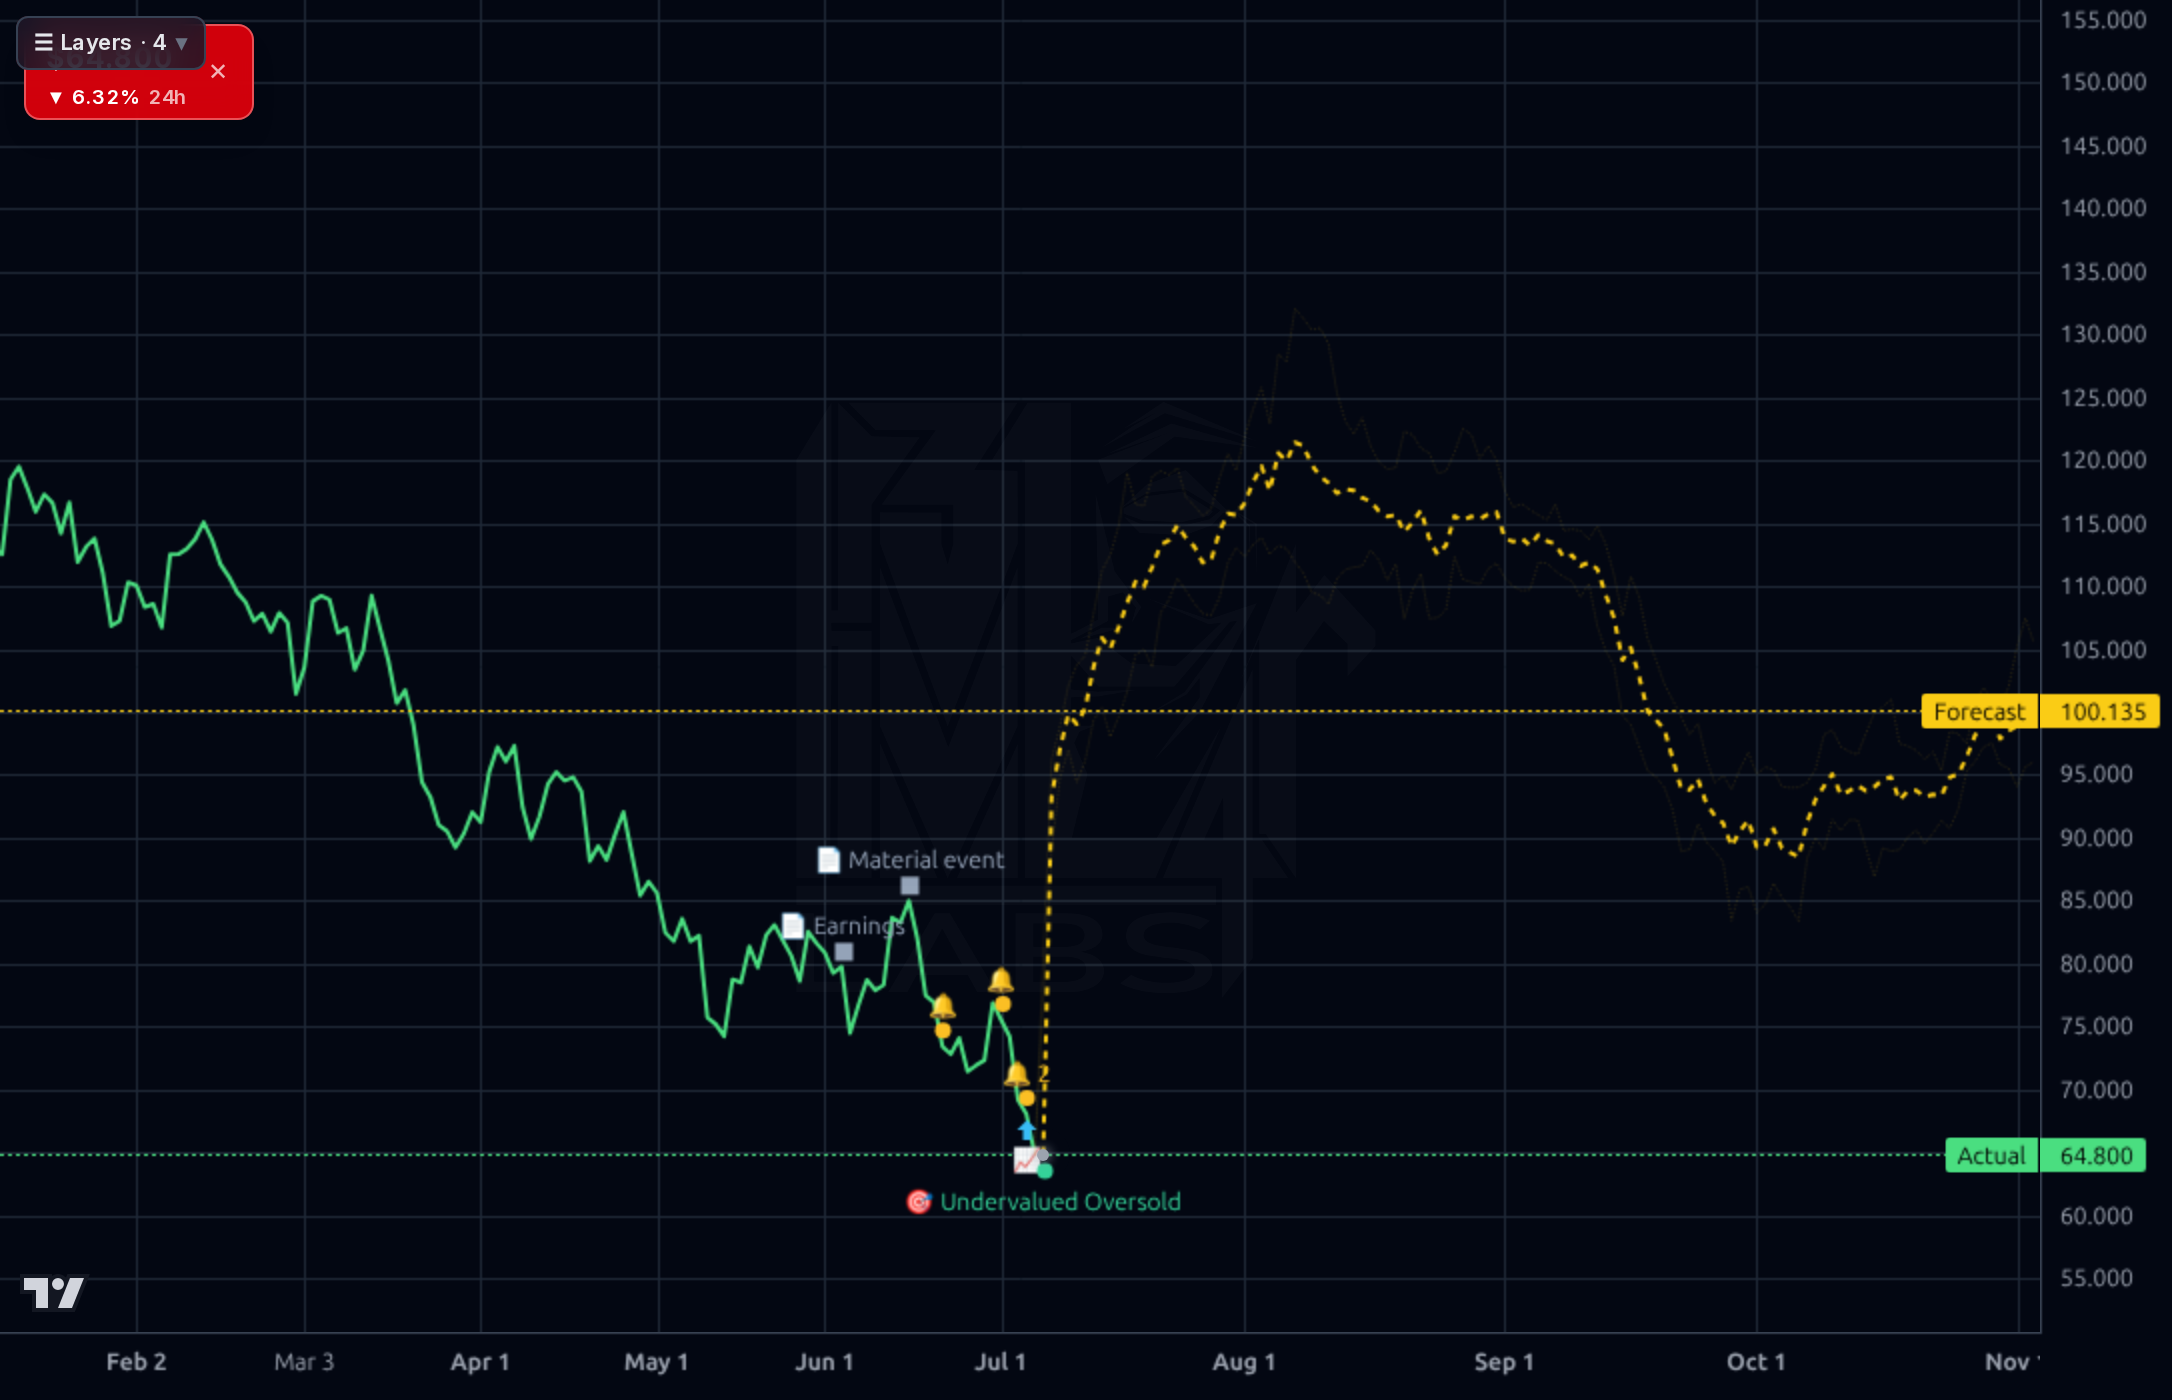
Wait for confirmation of support at key psychological levels (e.g., $63.55 or prior consolidation areas) before initiating small, staged buys. A break below recent lows without a clear catalyst is an invalidation signal.
The thesis favors accumulation over the next 1-6 months, targeting the base case implied by analyst consensus ($92.00). Catalysts include the August earnings report and any positive commentary on unit growth or margin stability amid macro uncertainty.
The long-term view remains favorable due to the structural advantage of closeout sourcing in a recessionary/cyclical environment, provided competitive encroachment from mass discounters does not erode core traffic. The biggest risk is sustained consumer spending shock.
The company exhibits solid operational metrics: Gross Margins have been strong (e.g., 39.14% in the latest snapshot), and ROE stands at a respectable 13.78%. The balance sheet appears healthy with a Current Ratio of 2.32 and manageable debt levels relative to equity, despite high total debt figures. Cash flow conversion is robust, with $135M TTM free cash flow supporting optionality. While the Debt/Equity ratio (0.38) suggests low leverage risk, the overall financial picture points to a resilient, value-oriented business model.
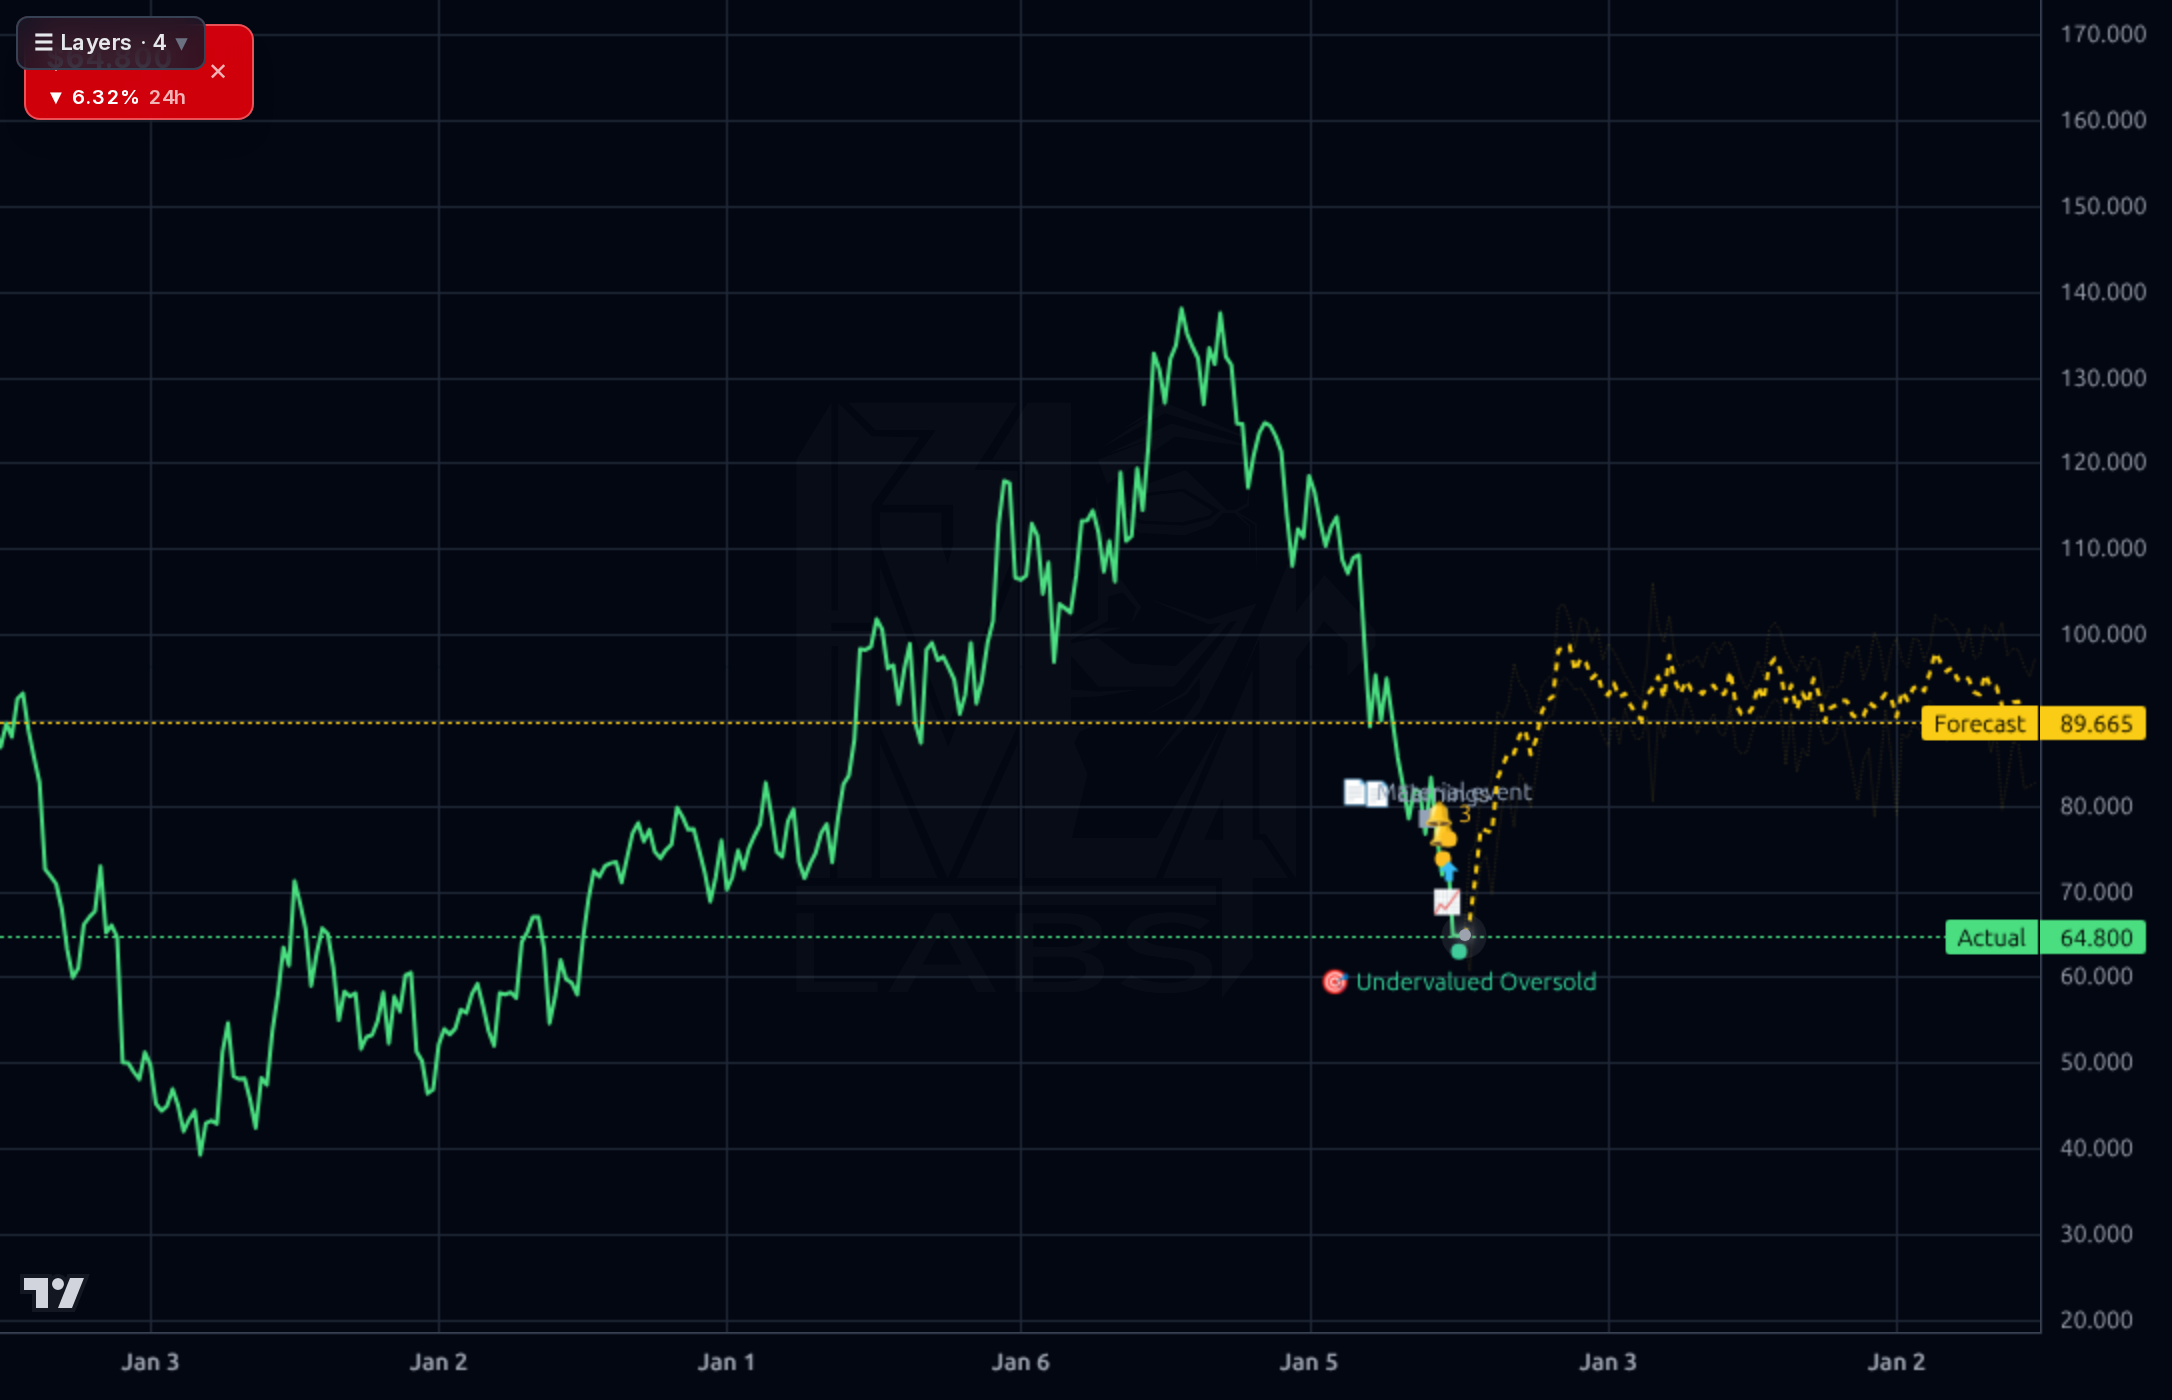
Technically, OLLI is in a significant drawdown, trading near 52-week lows ($67.74). The chart shows multiple instances of sharp declines followed by consolidation periods (e.g., the visible support/resistance levels around $70-$80 area on both charts). Momentum indicators like RSI (34.83) suggest oversold conditions, and the model's own accuracy metrics for short-term forecasting are poor (1d directional accuracy 20% vs 81% baseline), indicating caution is warranted. The forecast bands show a significant gap between current price ($68.03) and analyst targets.
The recent news flow is overwhelmingly positive regarding the company's positioning, with multiple articles from June 2026 highlighting OLLI as an outperformer in Q1 earnings season. Analysts are reiterating a 'Buy' thesis based on its bargain status and growth potential. The primary signal is the consistent analyst conviction despite the stock price decline, suggesting that fundamental value may be disconnected from current market sentiment.
- Sourcing tailwinds from retail bankruptcies and shelf resets continue to feed inventory at attractive costs, supporting gross margin expansion.
- Disciplined unit growth runway suggests continued store-level revenue increases supported by strong new-store economics.
- Strong free cash flow conversion ($136M TTM) provides optionality for capital returns or strategic investments.
- Competitive encroachment from Walmart and mass-market discounters on overlapping SKUs remains the primary secular risk.
- The stock's deep drawdown (-47% YoY) means any negative macro news could trigger a further, unpredicted sell-off.
- High short interest (10.6%) increases volatility risk if sentiment shifts rapidly.
Get AI analysis on any stock
This is one of hundreds of Kronos AI reports — scored fundamentals & technicals, bull/base/bear price targets, a multi-horizon plan, and continuously-updated forecasts across the market. Create a free account to explore them all.
Create your free account →Already a member? Sign in · Join our Discord