PAR— AI Stock Forecast & Price Targets
Published 6/24/2026 · A free sample of K3vl4r’s AI-powered analysis.
Kronos price forecasts, scored fundamentals & technicals, and a multi-horizon plan.
View the live PAR price forecast →
PAR Technology is a deeply broken-down restaurant SaaS/hardware hybrid trading near 52-week lows ($15.38 vs $72.15 high) with persistent operating losses, negative FCF, and a heavy debt load — but the AI forecast, analyst sentiment (1.44 recom, $26.38 PT), and recent JPM upgrade suggest a tactical mean-reversion setup. The risk/reward is asymmetric for a speculative long, but fundamentals remain unprofitable and short interest at 26.92% signals real bearish conviction.
1-4 week view: Tactical long bias with tight risk. Stock is consolidating $14.50–$15.70 after bouncing off $11.59. Buy zone $14.00–$14.80, stop below $13.20 (the Kronos 1h forecast low and structural support). Initial target $16.00–$16.50 (50-day resistance + Kronos 1h forecast). Position size small (1–2% portfolio) given 26.9% short float — can squeeze hard either way. Invalidation: daily close below $13.00.
1-6 month view: Constructive on a mean-reversion thesis. Catalysts: next earnings print (need to see narrowing losses and continued >20% revenue growth), continued analyst rerating from the JPM upgrade, potential short-covering rally given 7.2 days-to-cover. Expected return range +30% to +70% (target $20–$26 = analyst consensus PT). What would change my mind: another quarter of widening operating losses, OCF deterioration, or guidance cut. Watch debt covenants given $434M debt vs $77M cash.
1-3 year view: PAR is a credible play on restaurant digitization with a respectable enterprise customer base (Punchh, Plexure). If management can drive operating leverage to break-even/positive FCF by 2027, the stock can rerate to 3–4x EV/Sales (~$35–$45) — consistent with Kronos's weekly forecast of $42. The structural risk is that competition from Toast, Block/Square, Olo, and Lightspeed compresses unit economics and PAR remains a sub-scale conglomerate of acquired loyalty/POS assets that never achieve profitability — in which case the debt load forces dilutive equity raises or a distressed sale.
Revenue growth is the bright spot — Q1'26 revenue of $123.97M is up 19.4% Y/Y with TTM sales growth of 23.94%, reflecting the Punchh/PAR Retail/Plexure engagement-cloud expansion. However, profitability is poor and not improving in a straight line: Q1'26 operating margin of -11.2% and net margin of -13.0%, with four consecutive quarters of net losses ($16M–$21M each) and TTM EPS of -$1.88. Gross margin of ~44% is respectable for a hybrid hardware/SaaS model but operating deleverage suggests heavy S&M and R&D spend without scale benefits yet. The balance sheet is the bigger concern: $433.8M total debt vs only $77.2M cash, debt/equity 0.52, and operating cash flow turned negative again in Q1'26 (-$16.6M) and Q4'25 (-$11.8M), reversing the brief Q3'25 positive print. FCF is essentially zero on a TTM basis ($1.2M). P/B of 0.77 is striking — market is pricing the equity below book — and EV/Sales of 2.08 is well below SaaS peers, but this is justified until cash burn stabilizes. Forward P/E of 11.95 and PEG of 0.16 only matter if forward EPS of $1.29 actually materializes, which is a large 'if' given the trajectory.
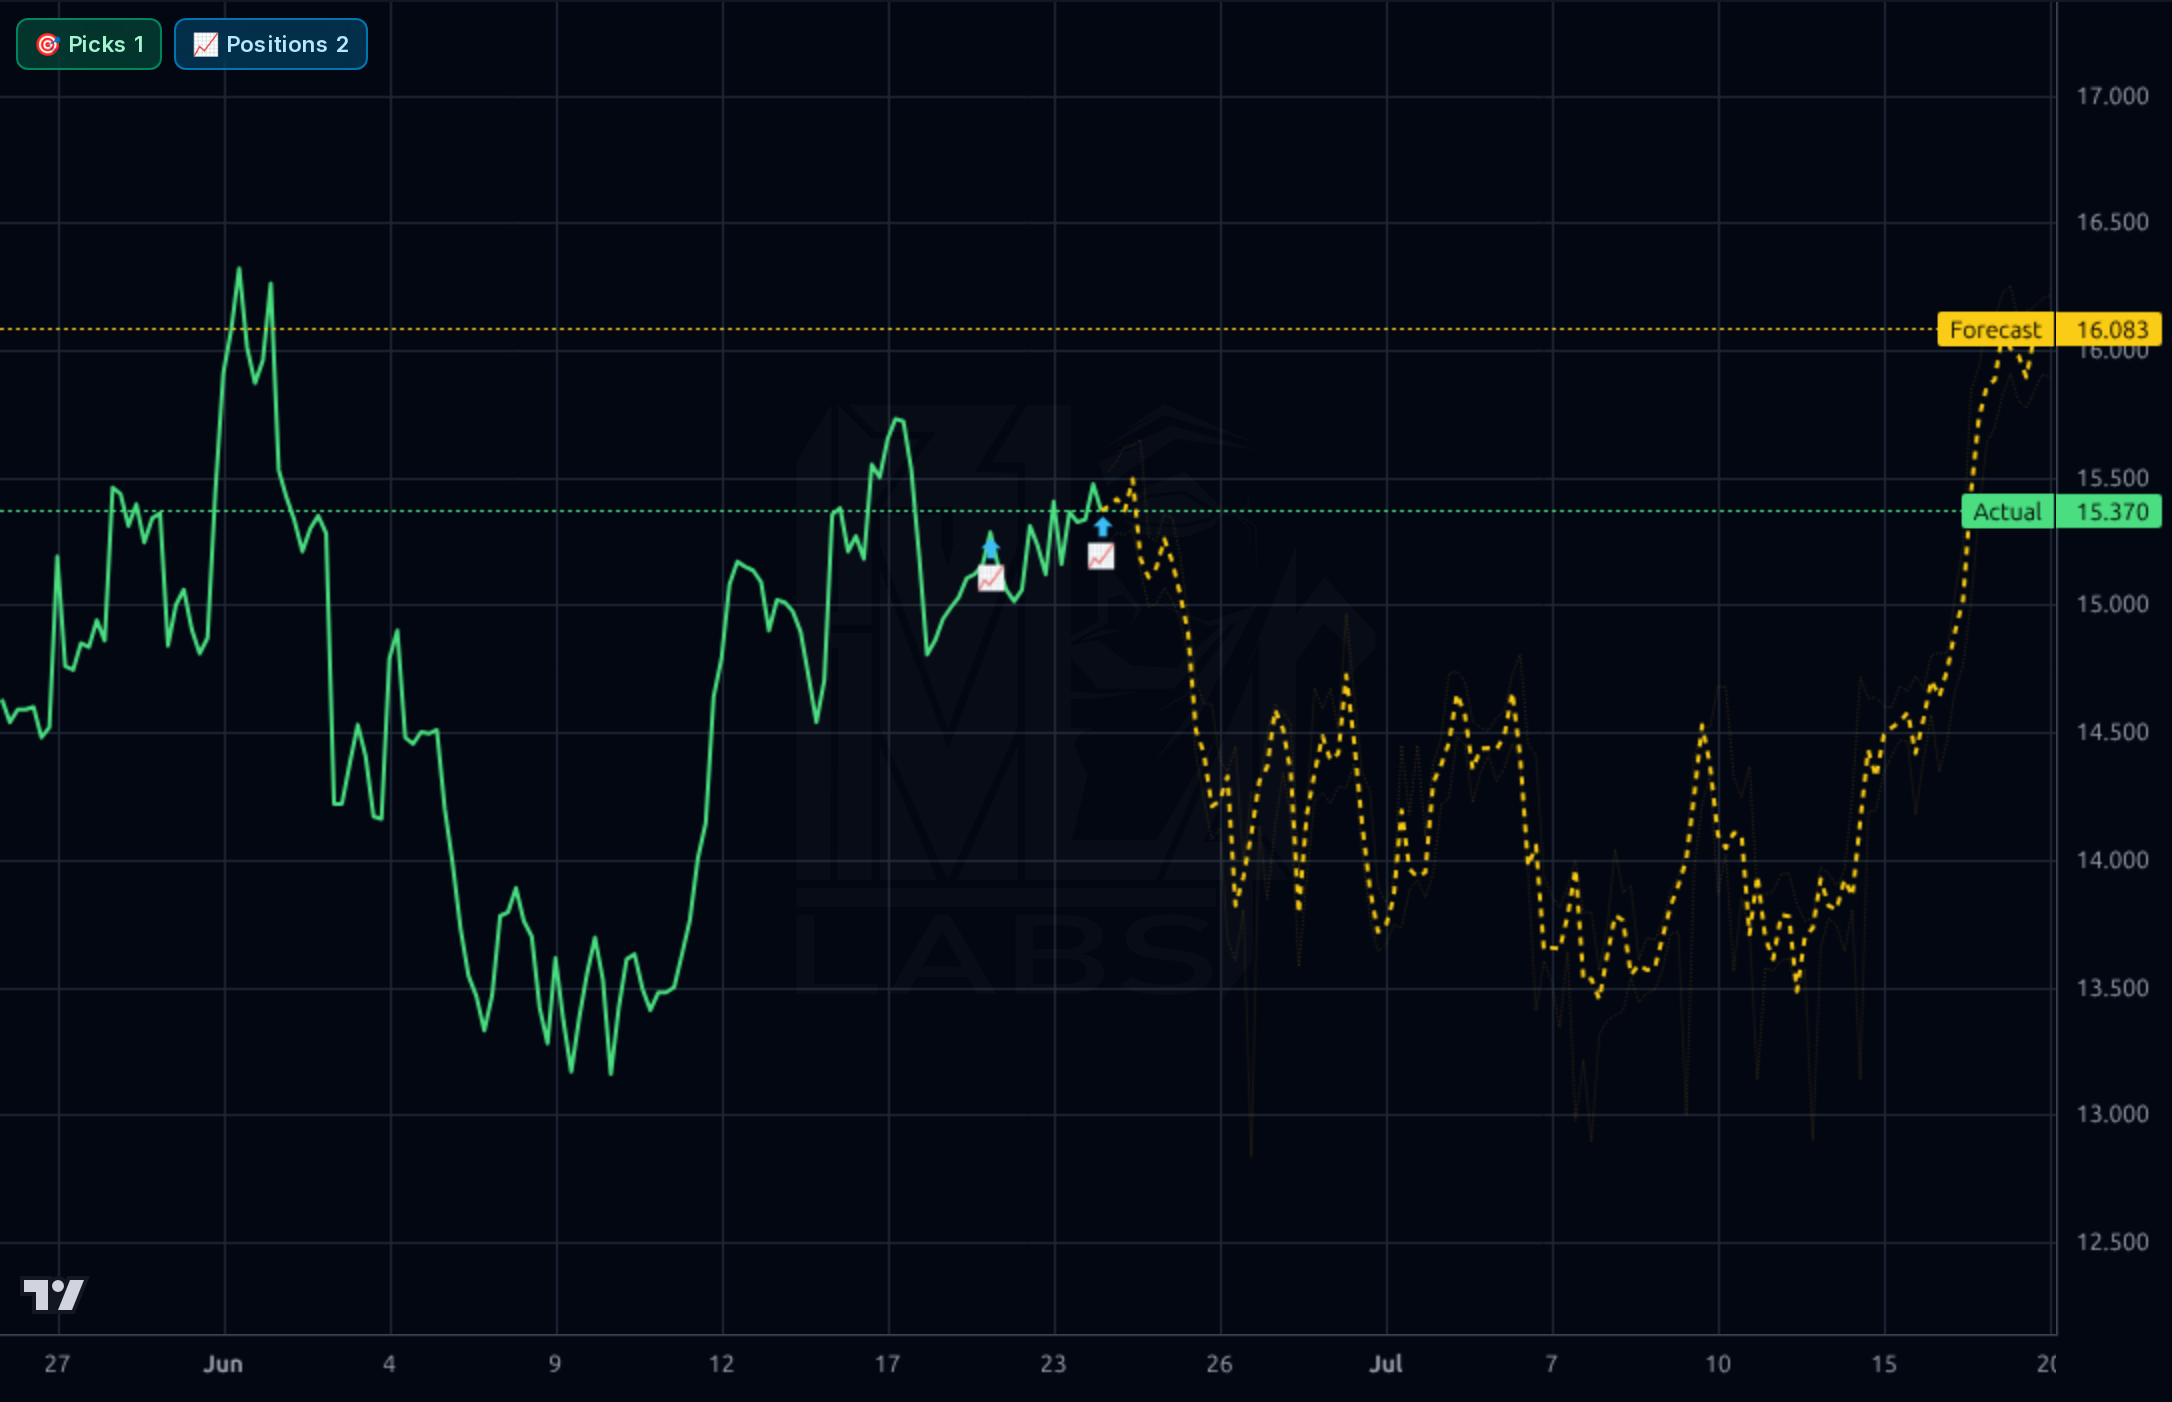
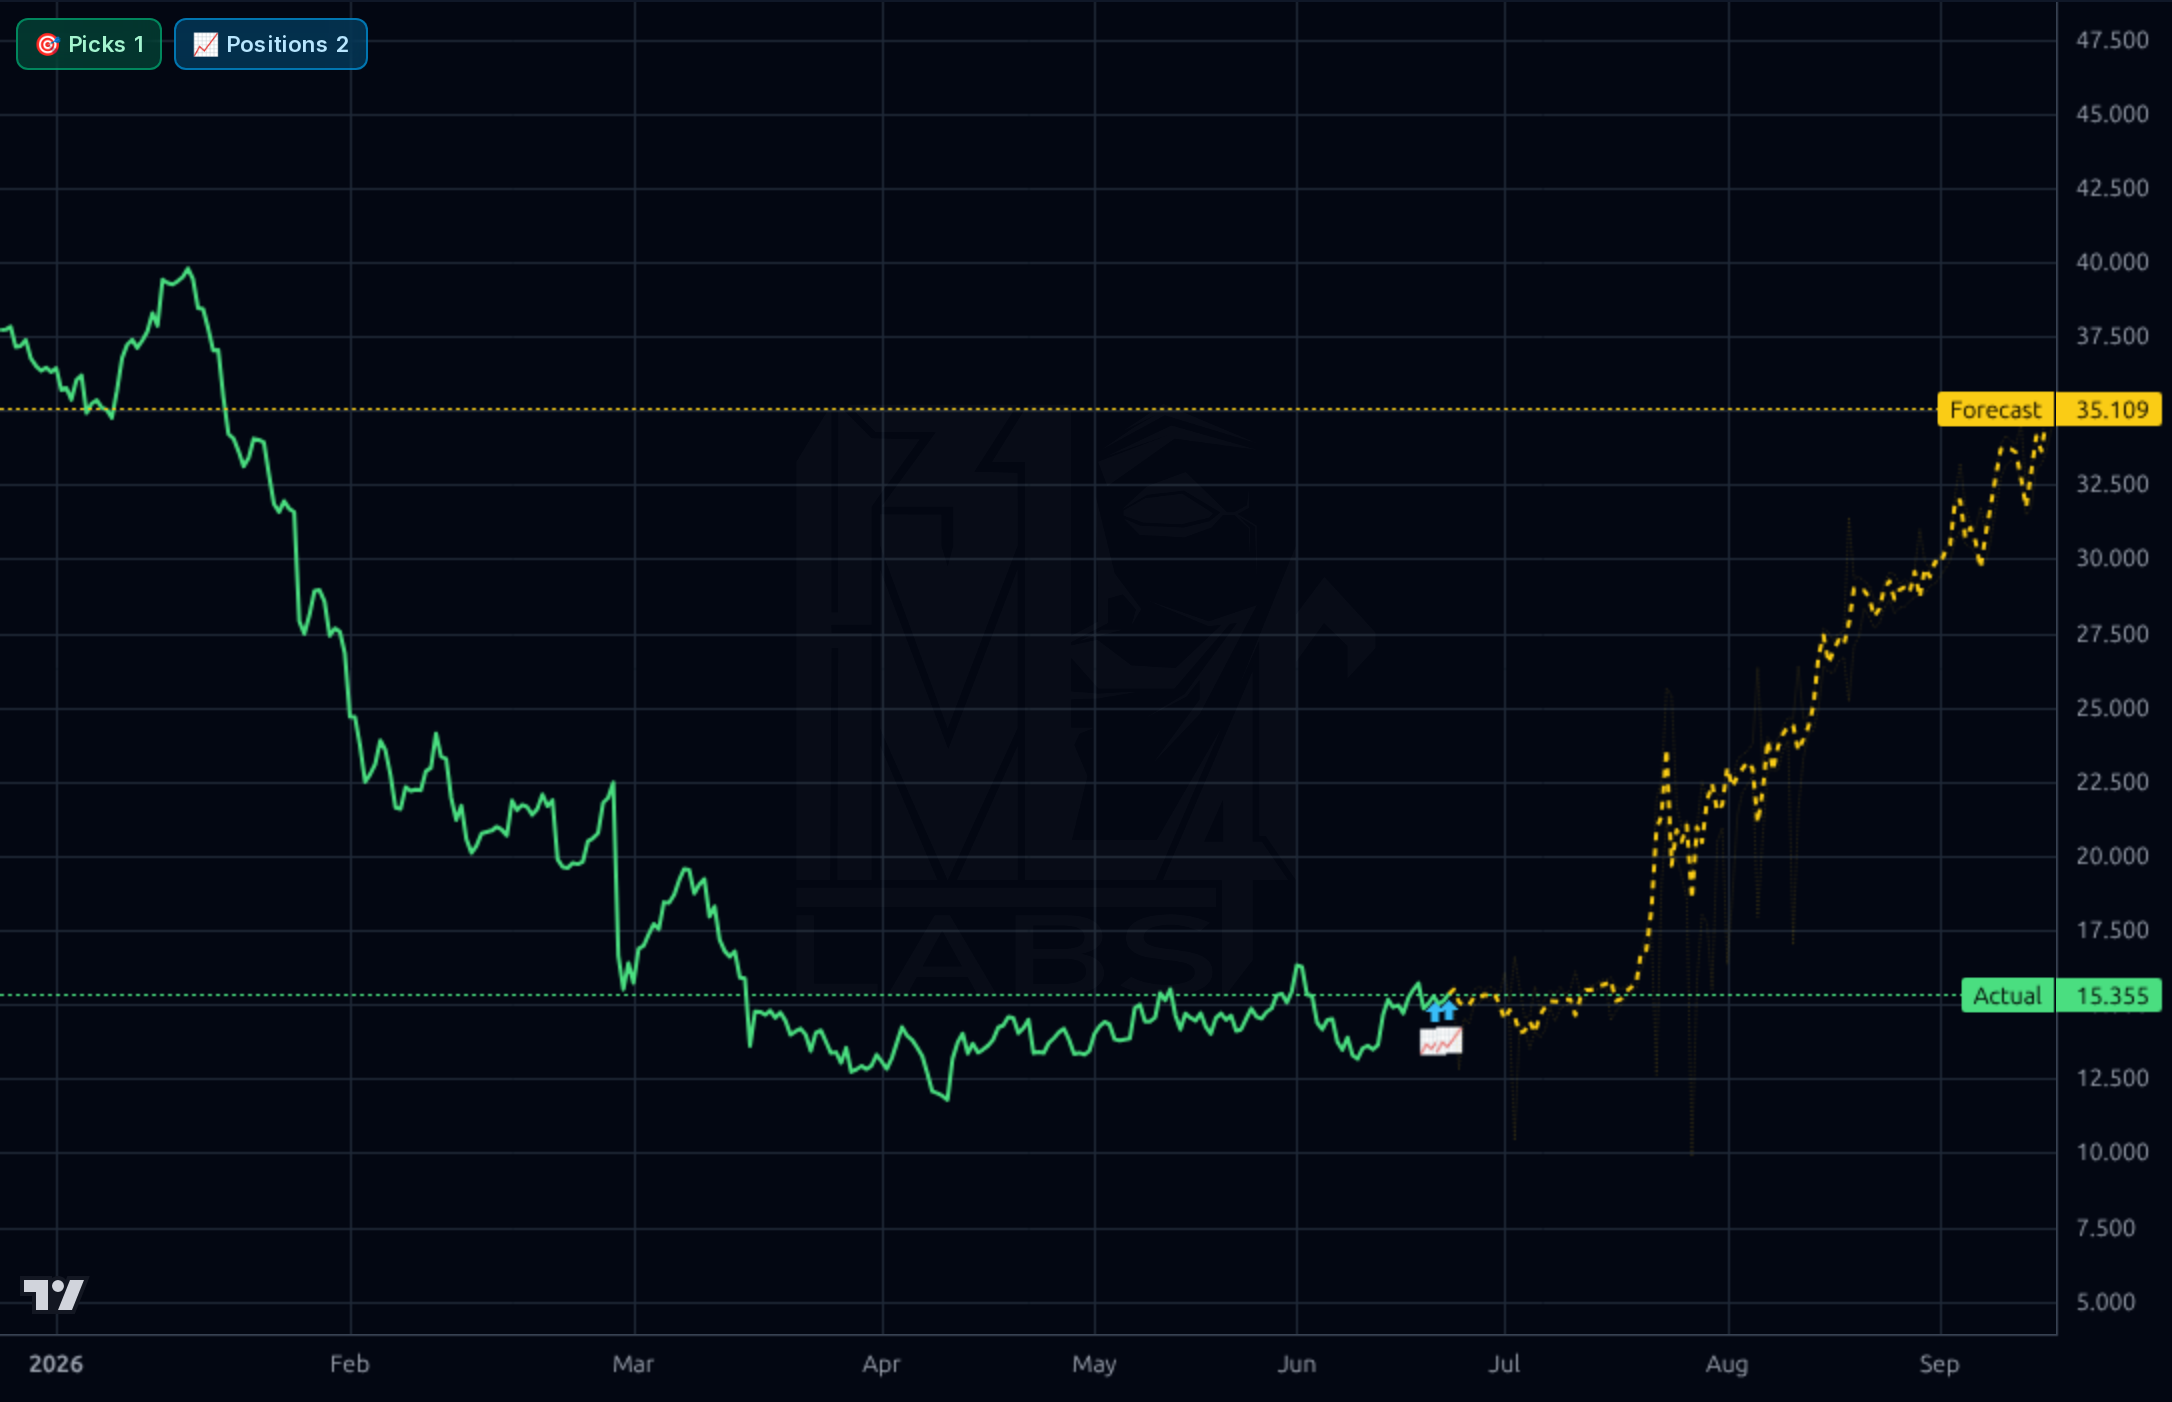
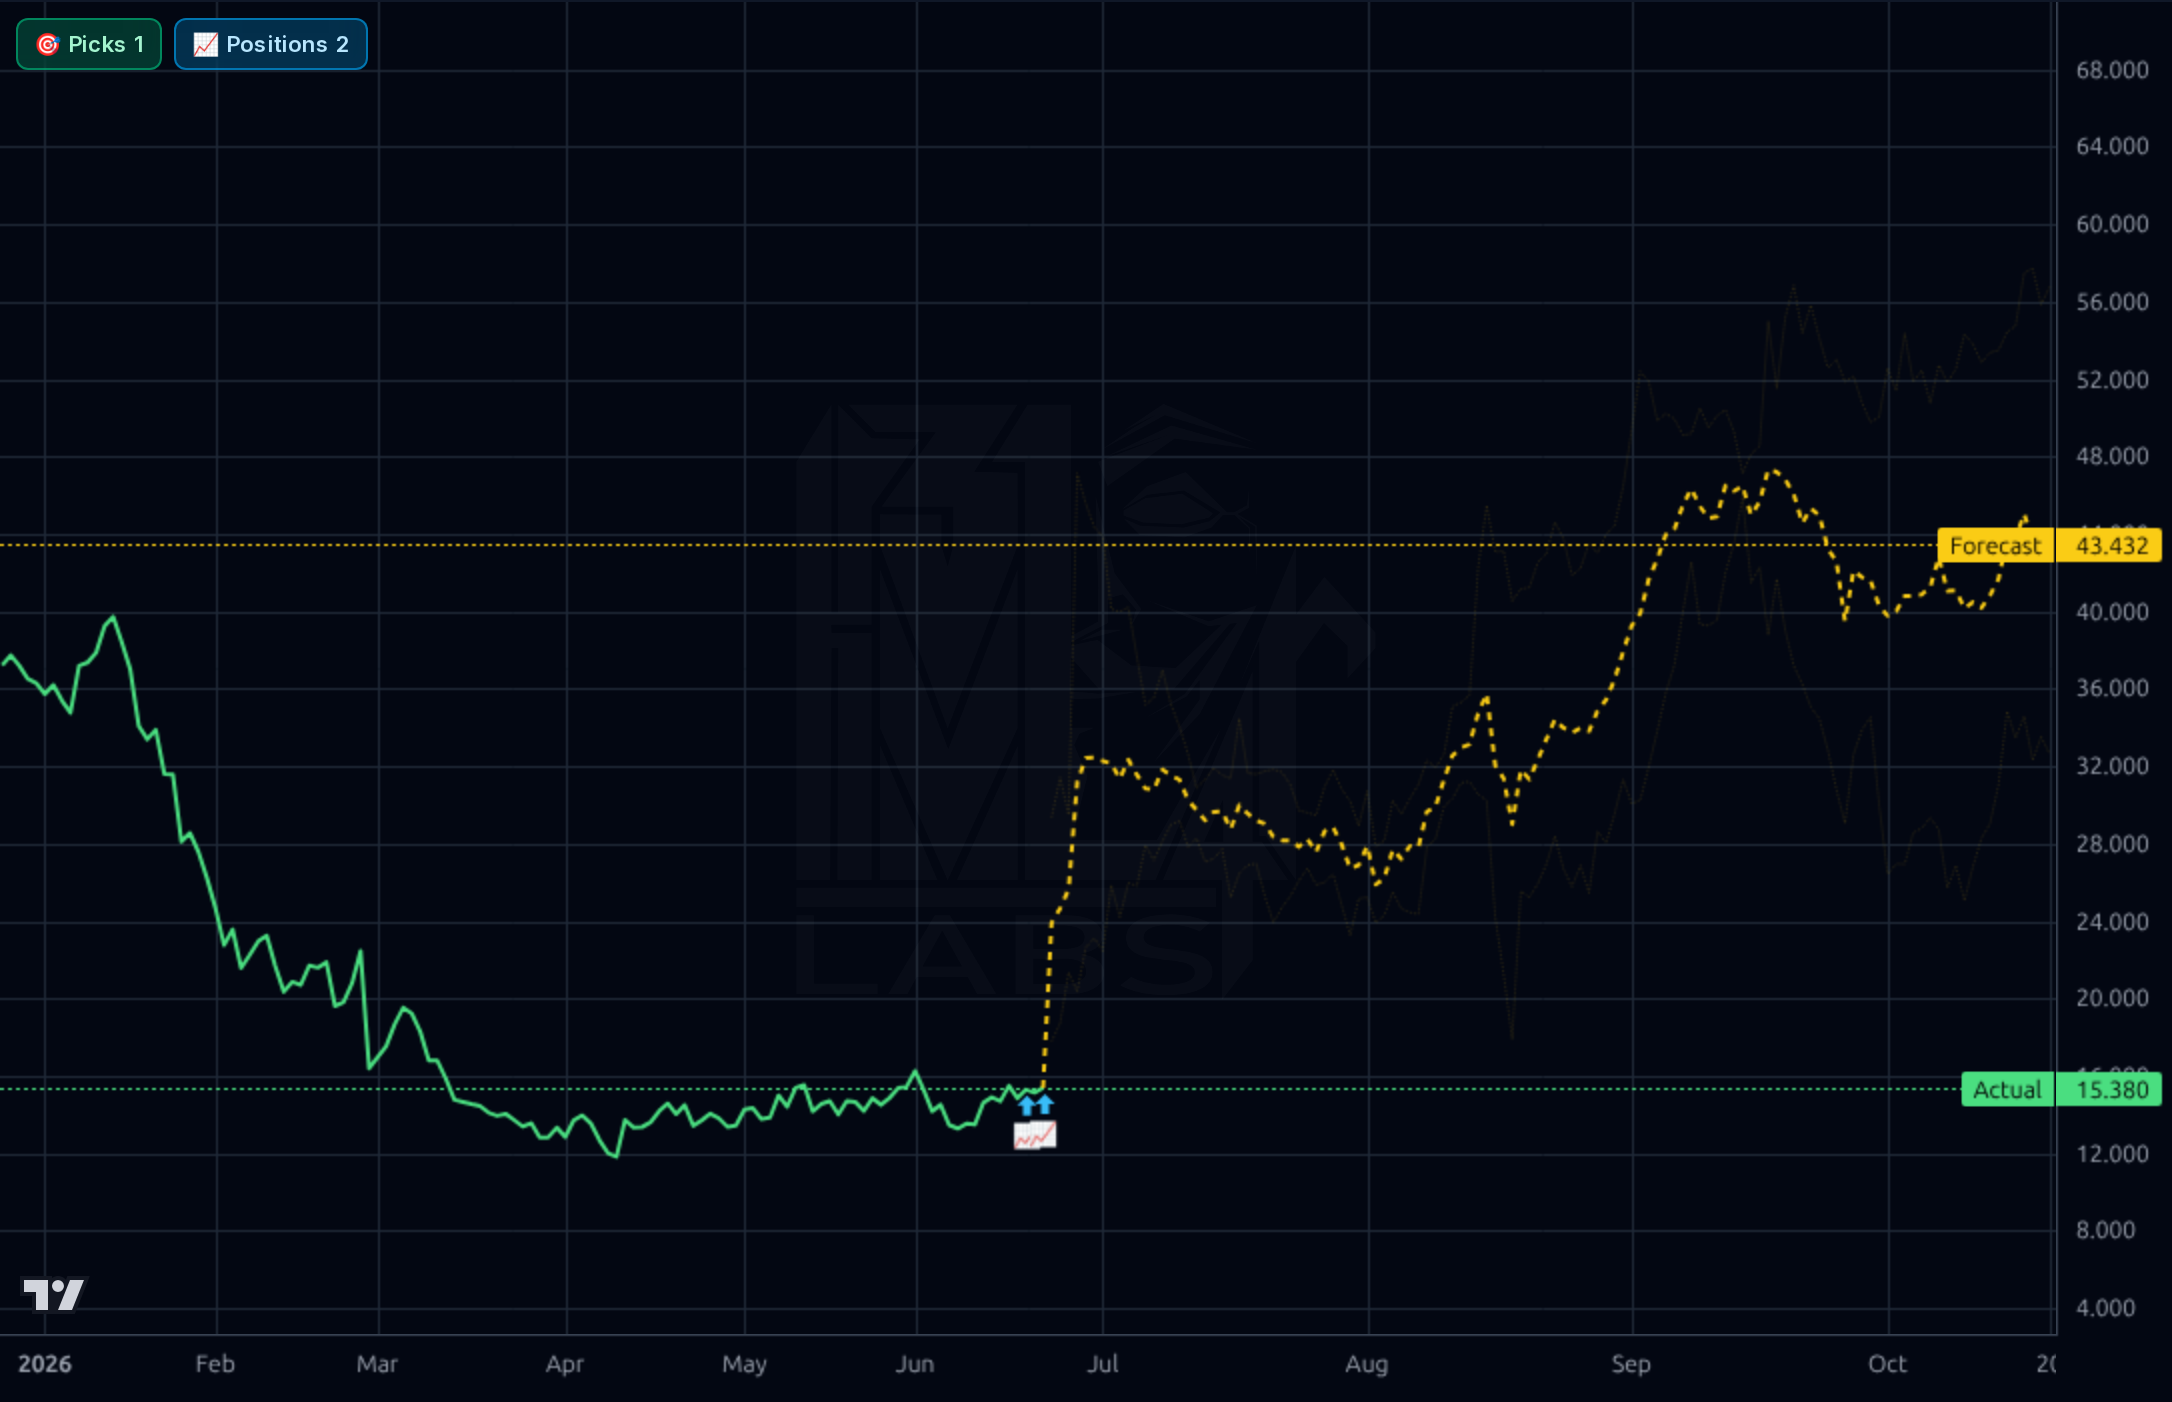
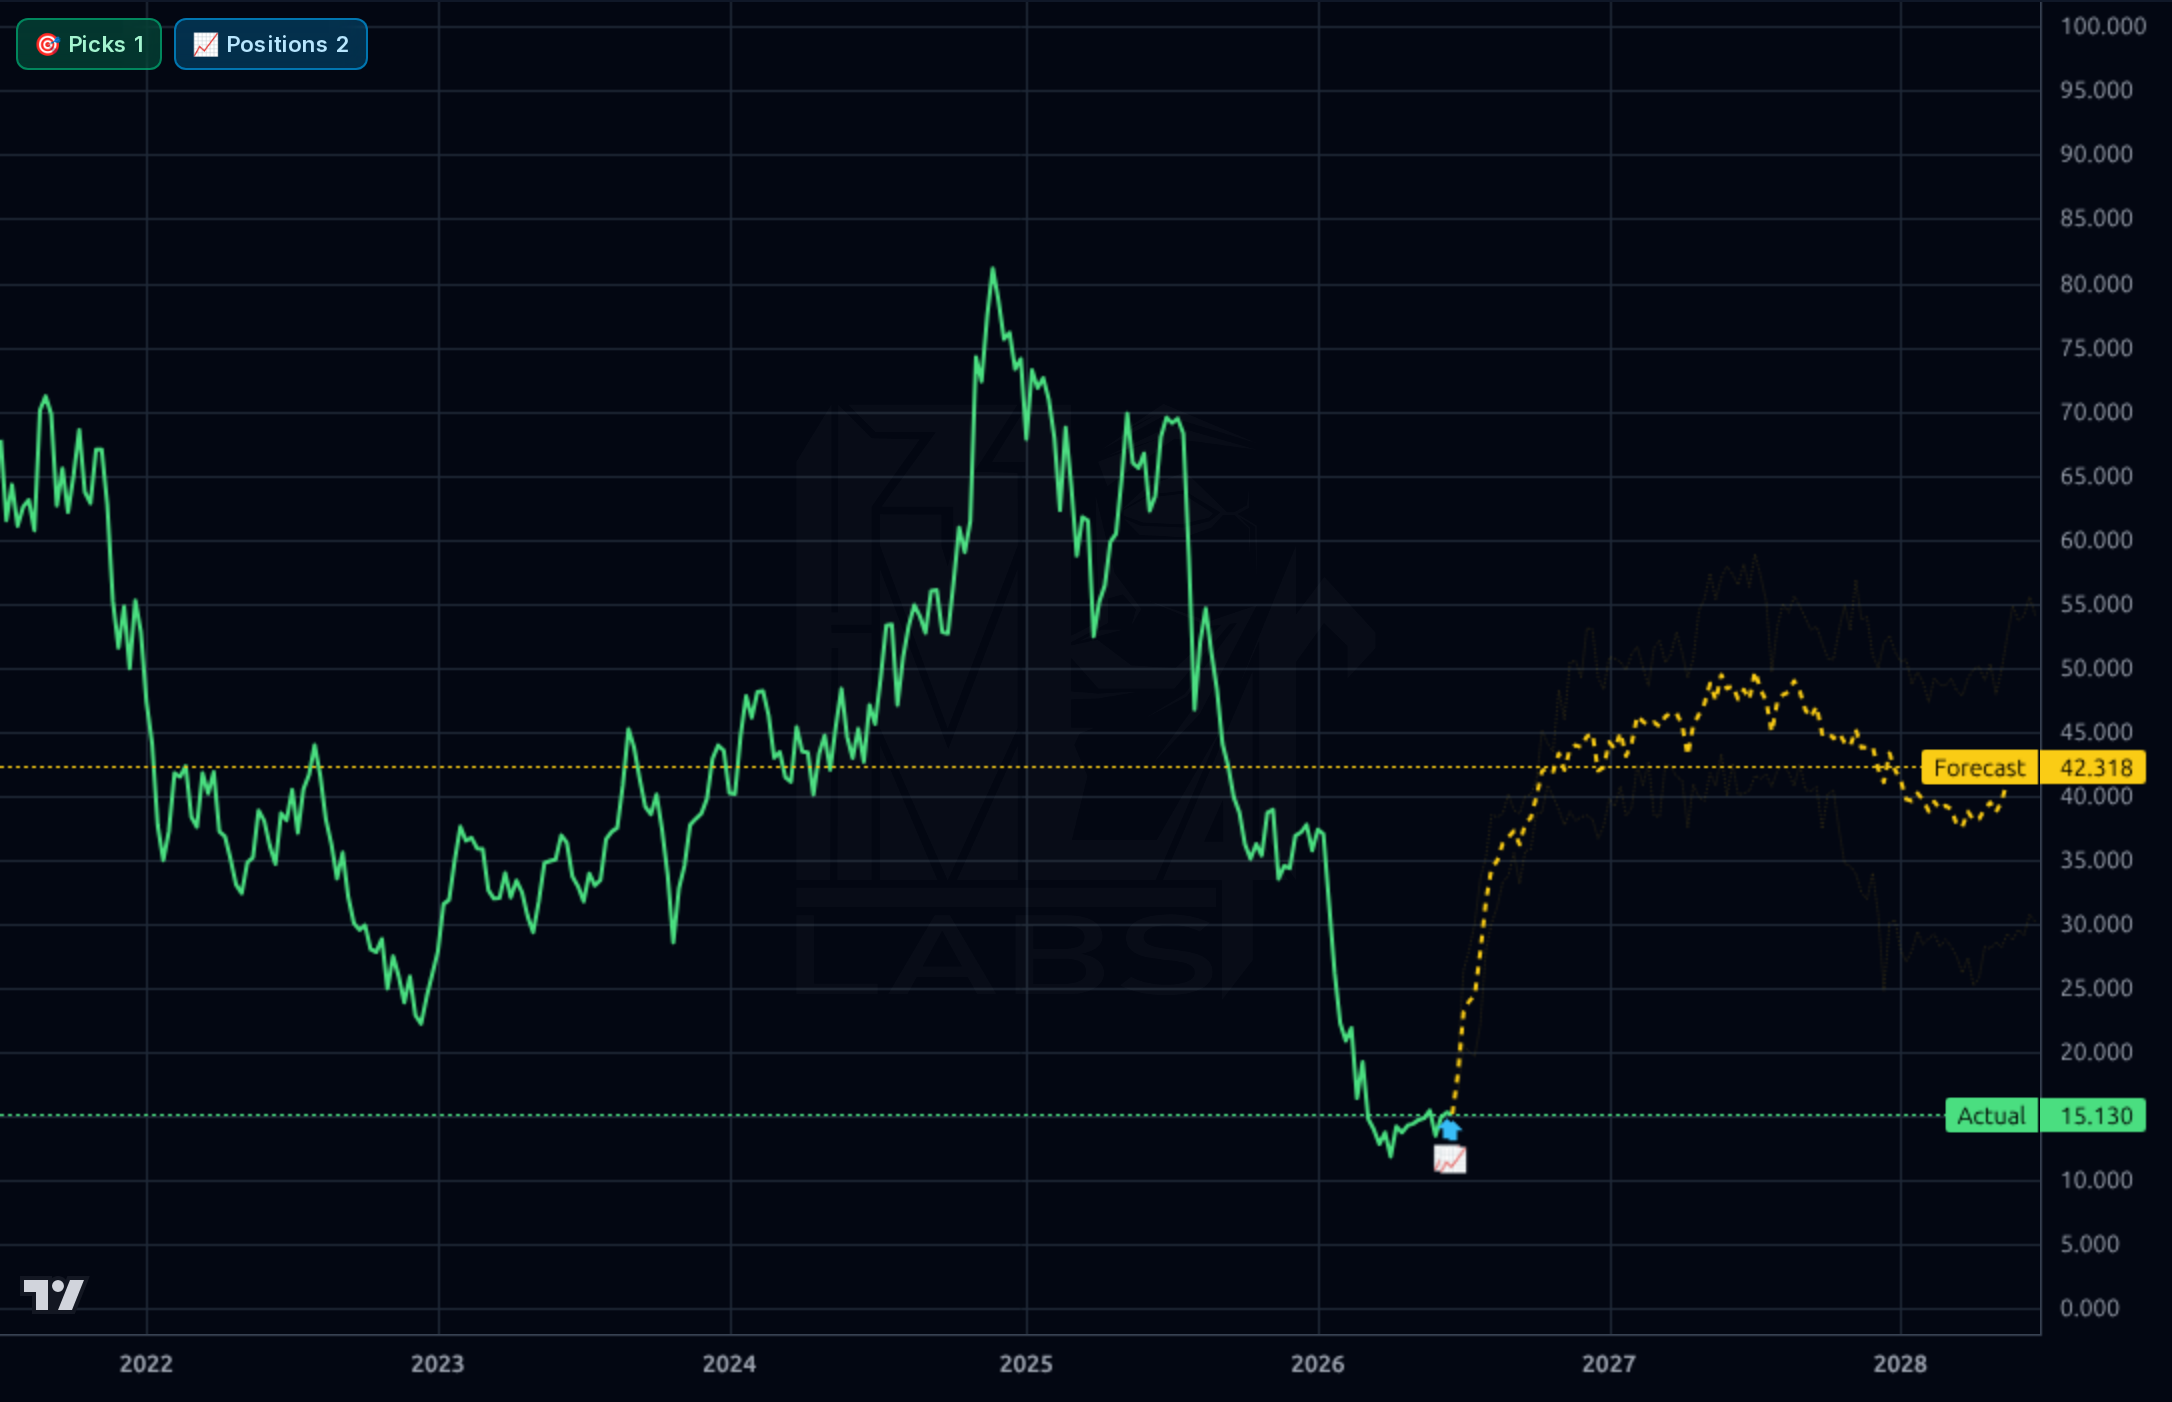
The stock is in a severe downtrend across all timeframes: -76.5% over the past year, -57.6% YTD, -42.3% below the 200-day SMA, sitting at $15.38 vs a 52-week high of $72.15 (-78.7%). The weekly chart shows a multi-year topping pattern from the 2024 peak near $80 down to a recent low of $11.59. However, near-term technicals show stabilization: +4.4% above 20-SMA, +6.8% above 50-SMA, RSI of 55.4 (neutral-bullish), and +8.4% MoM / +9.5% QoQ performance. The 1h chart shows price consolidating in the $14.50–$15.70 range with the Kronos forecast band projecting a near-term pullback to ~$13.50–$14.00 before recovery to $16.08. The 4h and 1d Kronos forecasts are strikingly bullish, projecting a multi-month grind higher toward $35–$43, which would be a 2–3x move. The weekly forecast shows mean-reversion to ~$42 by 2027–28. The 1d/1wk forecasts show a wide high/low band, signaling low confidence — typical of beaten-down small caps. Bullish probability model is pegged at 1.0, which is suspicious and should be discounted.
Newsflow has turned constructive on the margin. On June 9, JPMorgan upgraded PAR from Underweight to Neutral and raised its target from $12 to $16, attributing the prior bearish call to a 'technical error' in their May 29 initiation — that initiation had triggered the -3.1% drop on May 29. Voss Capital's Q1'26 letter (-11.4% for the quarter) flagged positive developments at PAR, suggesting deep-value/special-sit holders are accumulating. A Motley Fool comparison piece (June 20) frames PAR as a scaled hospitality tech player serving 140,000+ sites — useful narrative for a rerating. Broader market news (Bessent's 3-3-3 plan, oil normalization, prediction markets) is irrelevant to PAR specifically. The signal: sentiment trough may be behind us, with the JPM upgrade removing a meaningful overhang. The noise: no actual earnings beat or guidance raise has been confirmed; the next earnings catalyst is the next quarterly print.
- Punchh + PAR Ordering loyalty/engagement cloud cross-sell — Sales Q/Q +19.4% suggests engagement cloud attach is working
- International expansion via Plexure platform — adds geographic diversification beyond US restaurants
- PAR Pay merchant services monetization — payments attach to existing 140,000+ site base is a high-margin lever
- Analyst rerating cycle following JPM upgrade (June 9) — average PT $26.38 vs spot $15.38 implies ~71% upside if consensus holds
- Potential short-covering catalyst: 26.92% short float + 7.21 days-to-cover means any positive earnings surprise can force a squeeze
- EPS swing from -$1.88 TTM to forward $1.29 (forward P/E 11.95) — if achieved, drives multiple expansion
- Persistent operating losses: Q1'26 operating margin -11.2%, 4 straight quarters of net losses totaling ~$76M
- Balance sheet stress: $433.8M debt vs $77.2M cash; negative operating cash flow returning in Q4'25 and Q1'26
- Short interest at 26.92% of float signals institutional bears with high conviction in further downside
- Insider ownership only 1.60% — limited skin in the game
- Inst Trans -6.94% — institutions were net sellers recently
- Competitive pressure from Toast, Olo, Block, Lightspeed in restaurant tech
- Kronos AI forecast accuracy is limited: 30d MAPE of 11.9% and only 66.7% directional hit rate — forecast should not be over-trusted
- Going-concern / dilution risk if cash burn continues at $15–20M/quarter pace; potential equity raise at depressed prices
- Stock has lost 78.5% over 5 years and 76.5% over 1 year — secular value destruction is the base case until proven otherwise
Get AI analysis on any stock
This is one of hundreds of Kronos AI reports — scored fundamentals & technicals, bull/base/bear price targets, a multi-horizon plan, and continuously-updated forecasts across the market. Create a free account to explore them all.
Create your free account →Already a member? Sign in · Join our Discord