PTC— AI Stock Forecast & Price Targets
Published 6/29/2026 · A free sample of K3vl4r’s AI-powered analysis.
Kronos price forecasts, scored fundamentals & technicals, and a multi-horizon plan.
View the live PTC price forecast →
PTC has been crushed ~47% from its 52-week high to $115.72 on what appears to be a violent re-rating despite the underlying SaaS-like CAD/PLM franchise still printing 84% gross margins, 41% net margins, and ~$986M FCF. The Kronos forecast is aggressively bullish across timeframes but its 1d directional accuracy (11% vs 89% naive baseline) is unreliable in this regime — the technical damage is real, yet valuation (fwd P/E ~13.4, P/FCF 14.4) and analyst target of $181 create an asymmetric setup for patient accumulators.
1-4 weeks: Stock is oversold (RSI 33.6) and basing $110-$118, but trend is firmly down on all timeframes and the Kronos 1d forecast is statistically unreliable here. Approach: small starter position (¼ of intended size) only on a reclaim of $120 with volume, or a tag of $108-$110 with a bullish daily reversal candle. Hard invalidation: close below $108.50 (52-wk low) — that opens $95-$100. Avoid chasing into $130 BNP target without confirmation.
1-6 months: Thesis is mean-reversion in a high-quality software compounder trading at ~13x fwd EPS and ~14x FCF with 40%+ operating margins. Catalysts: next earnings (May 6 AMC per snapshot — though that date appears stale; watch the actual Q3 print), Orbit adoption metrics, potential M&A given the post-IoT-divestiture cash. Expected return range in base case: +15-35% to $130-$155. What changes my mind: a guidance cut to ARR growth below mid-teens, or evidence the discrete CAD seat business is structurally decelerating.
1-3 years: PTC remains a top-3 PLM franchise with high switching costs in regulated/complex manufacturing (Windchill, Codebeamer for ALM). Multi-year drivers: SaaS conversion of installed base (Onshape, Arena), AI-infused PLM workflows (Orbit), and operating leverage as the model matures. At 11x trailing earnings on $10.48 TTM EPS with 32-40% historical EPS growth, this is statistically cheap if the franchise holds. Biggest structural risk: displacement by Autodesk Fusion / Dassault 3DEXPERIENCE in cloud-native CAD for SMB and a slowing enterprise digital-thread spend cycle.
PTC's underlying business quality remains strong: TTM revenue ~$3.0B with 27.75% Y/Y sales growth, gross margins at 84.7%, operating margin 41.6%, net margin 41.6%, and ROE 34.6%/ROIC 24.1%. The most recent quarter (Mar-26) printed $774M revenue, $660M gross profit, and $591M net income — though the net income figure is inflated relative to operating income ($296M), suggesting a one-time tax/divestiture benefit (consistent with the reported IoT-related transactions referenced in SeekingAlpha). Free cash flow generation is high quality: $318M FCF in Mar-26 quarter, $267M prior, and ~$986M trailing. Capex is negligible (~$2-3M/quarter), validating the capital-light software model. Balance sheet is workable but levered: $1.38B total debt vs only $439M cash, D/E 0.36, current ratio 1.23 — adequate but not pristine. Capital allocation has historically favored buybacks over dividends (payout 0%). The franchise (Windchill, Creo, Codebeamer, Arena, Onshape) remains a sticky PLM/CAD platform — what's 'broken' is sentiment and possibly forward bookings visibility, not the unit economics.
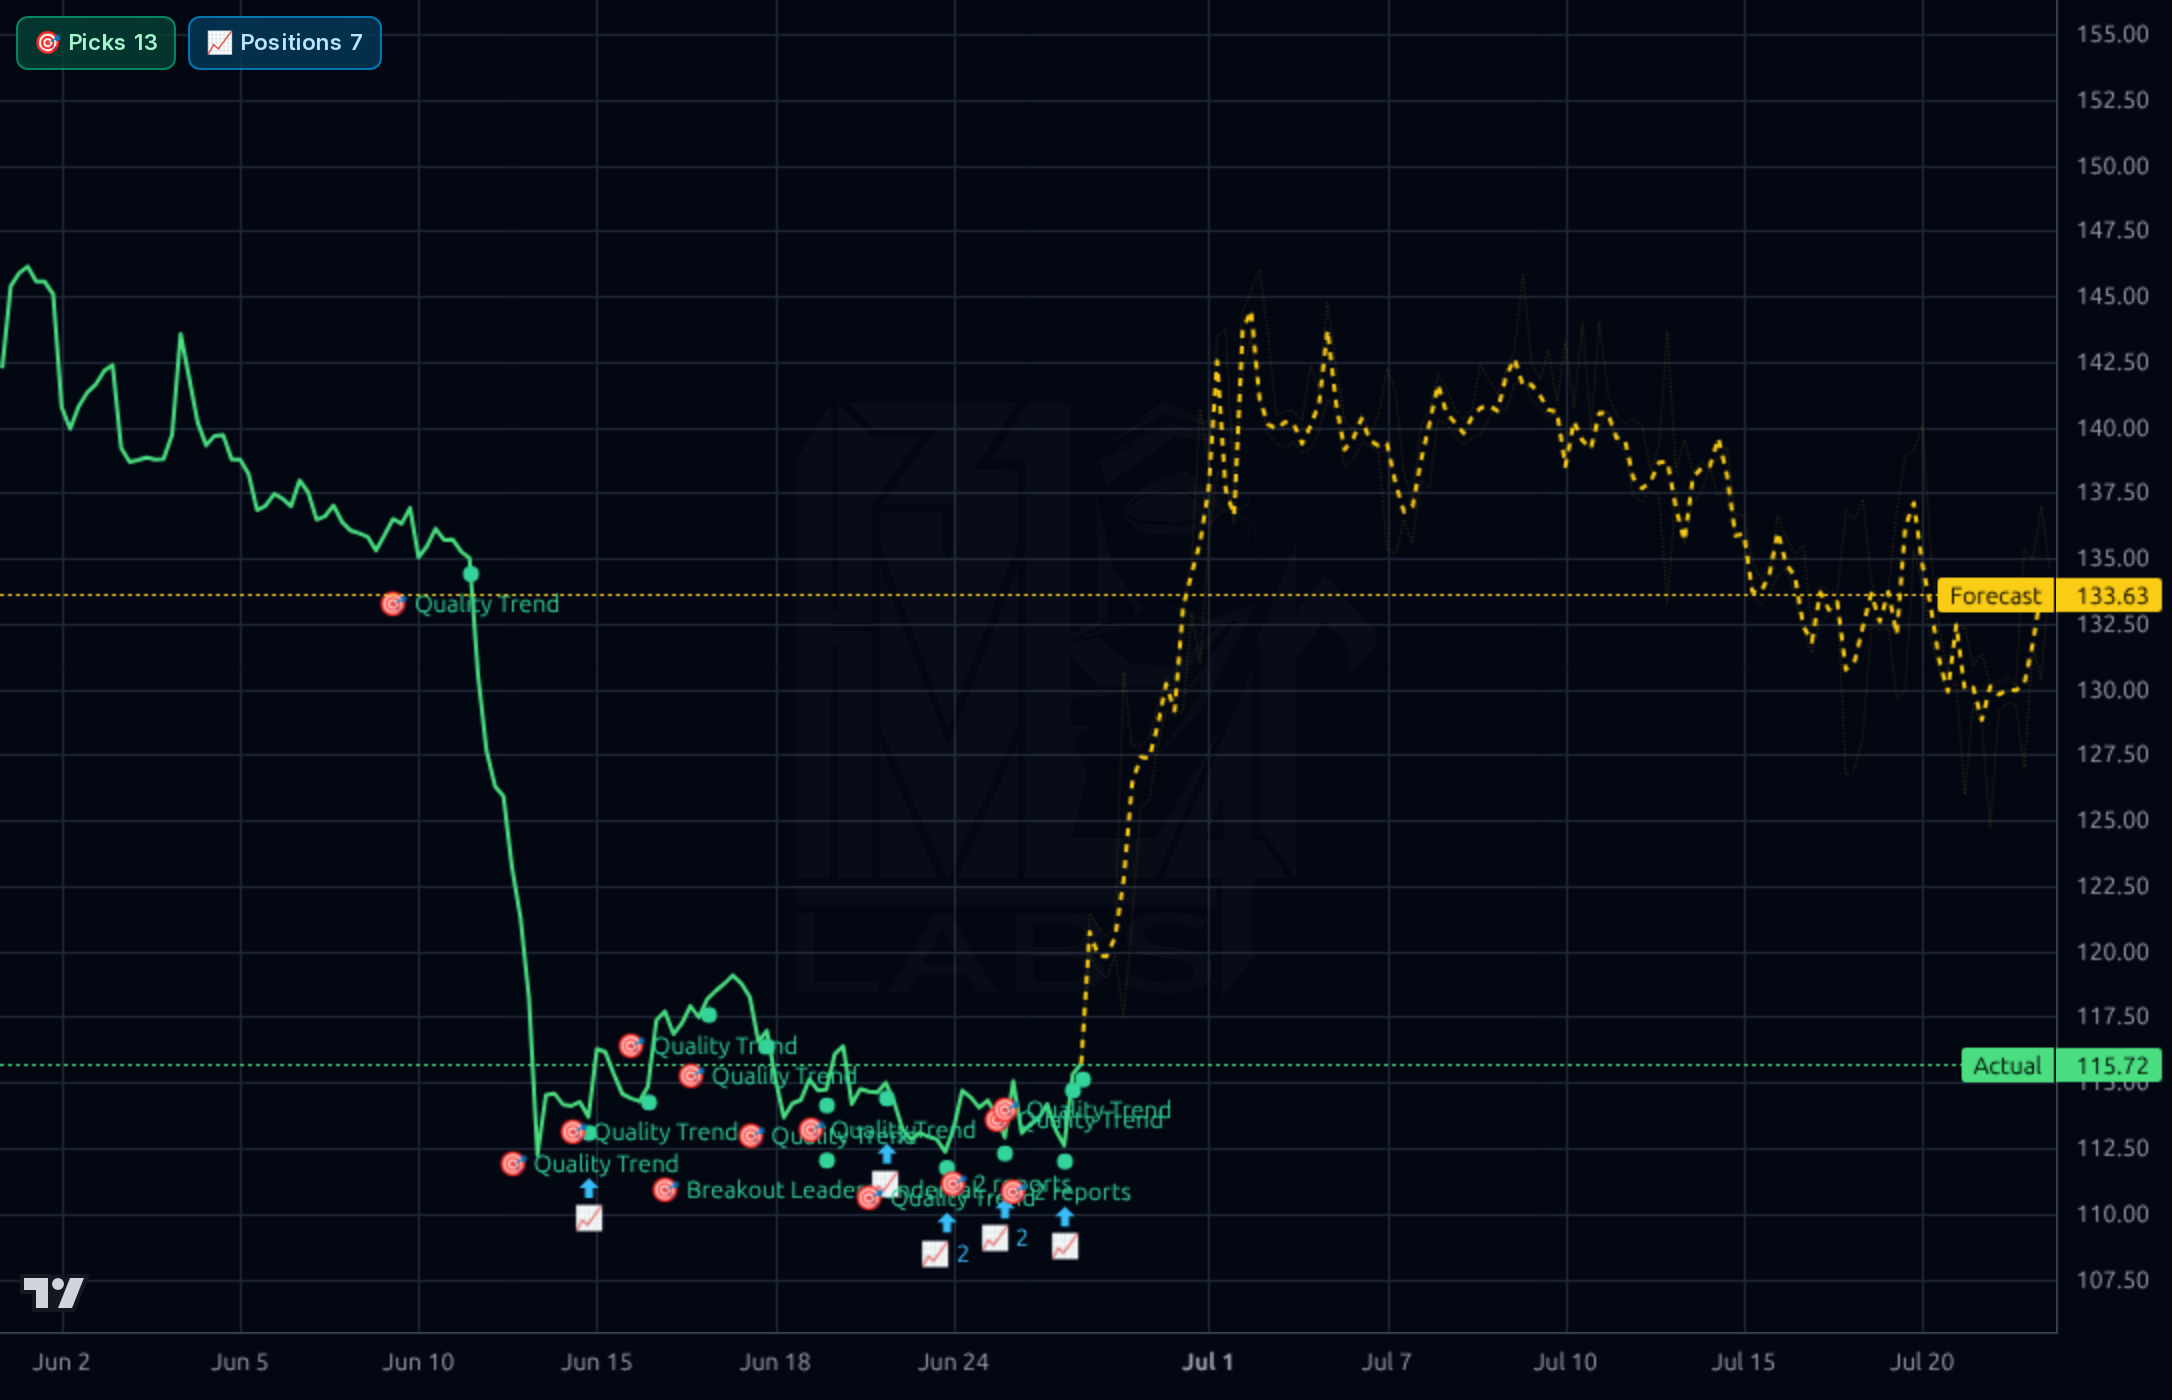
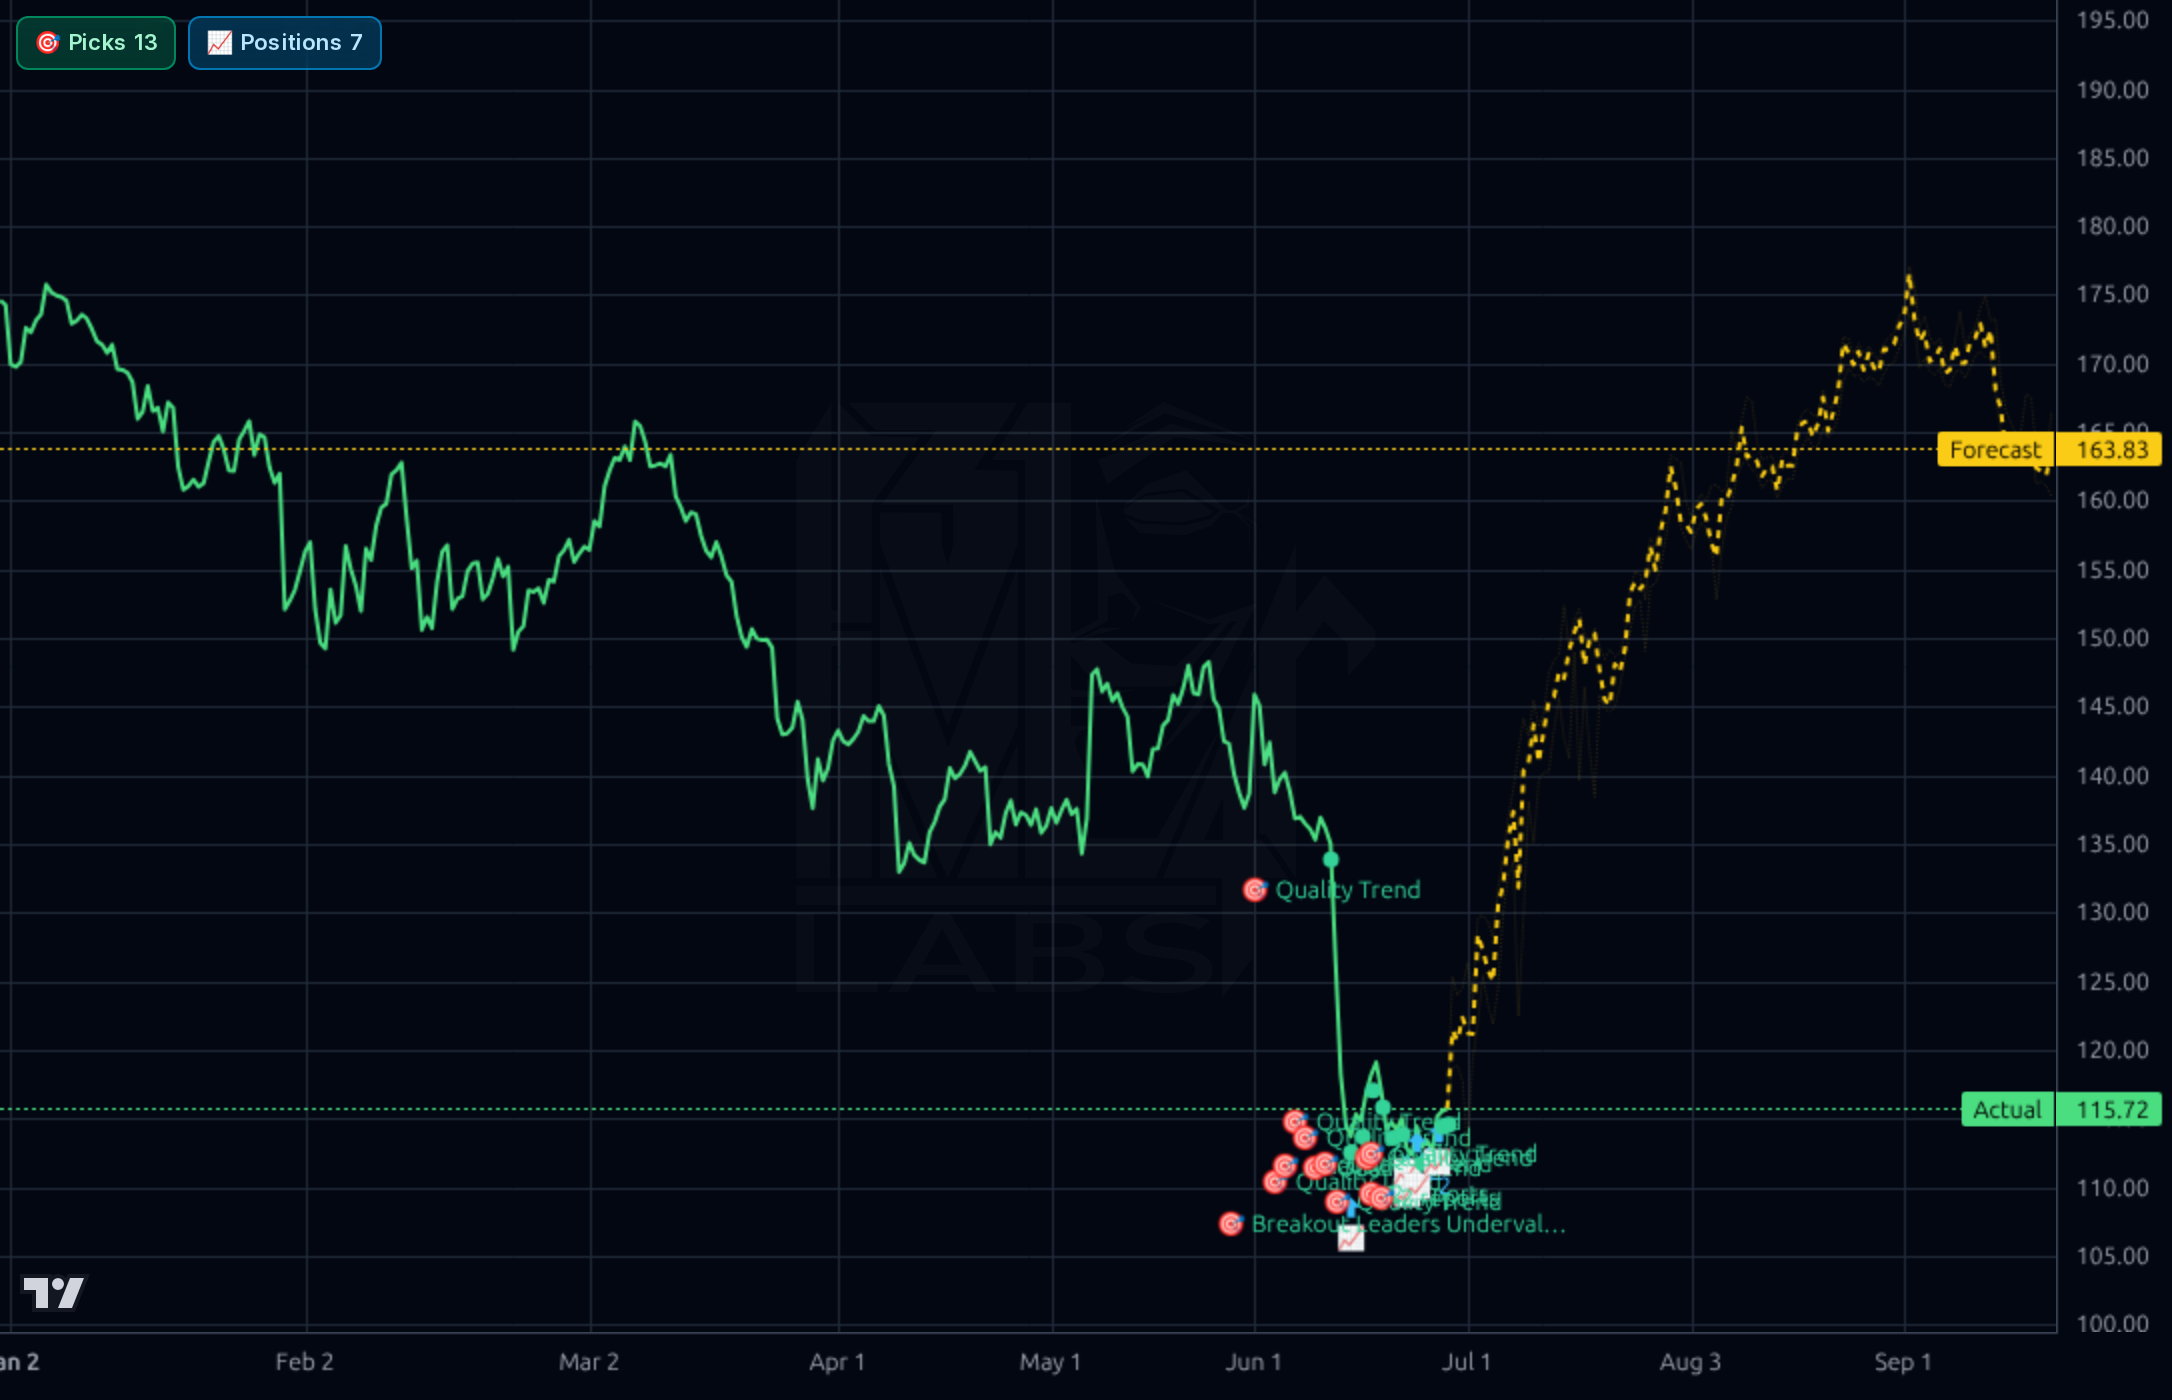
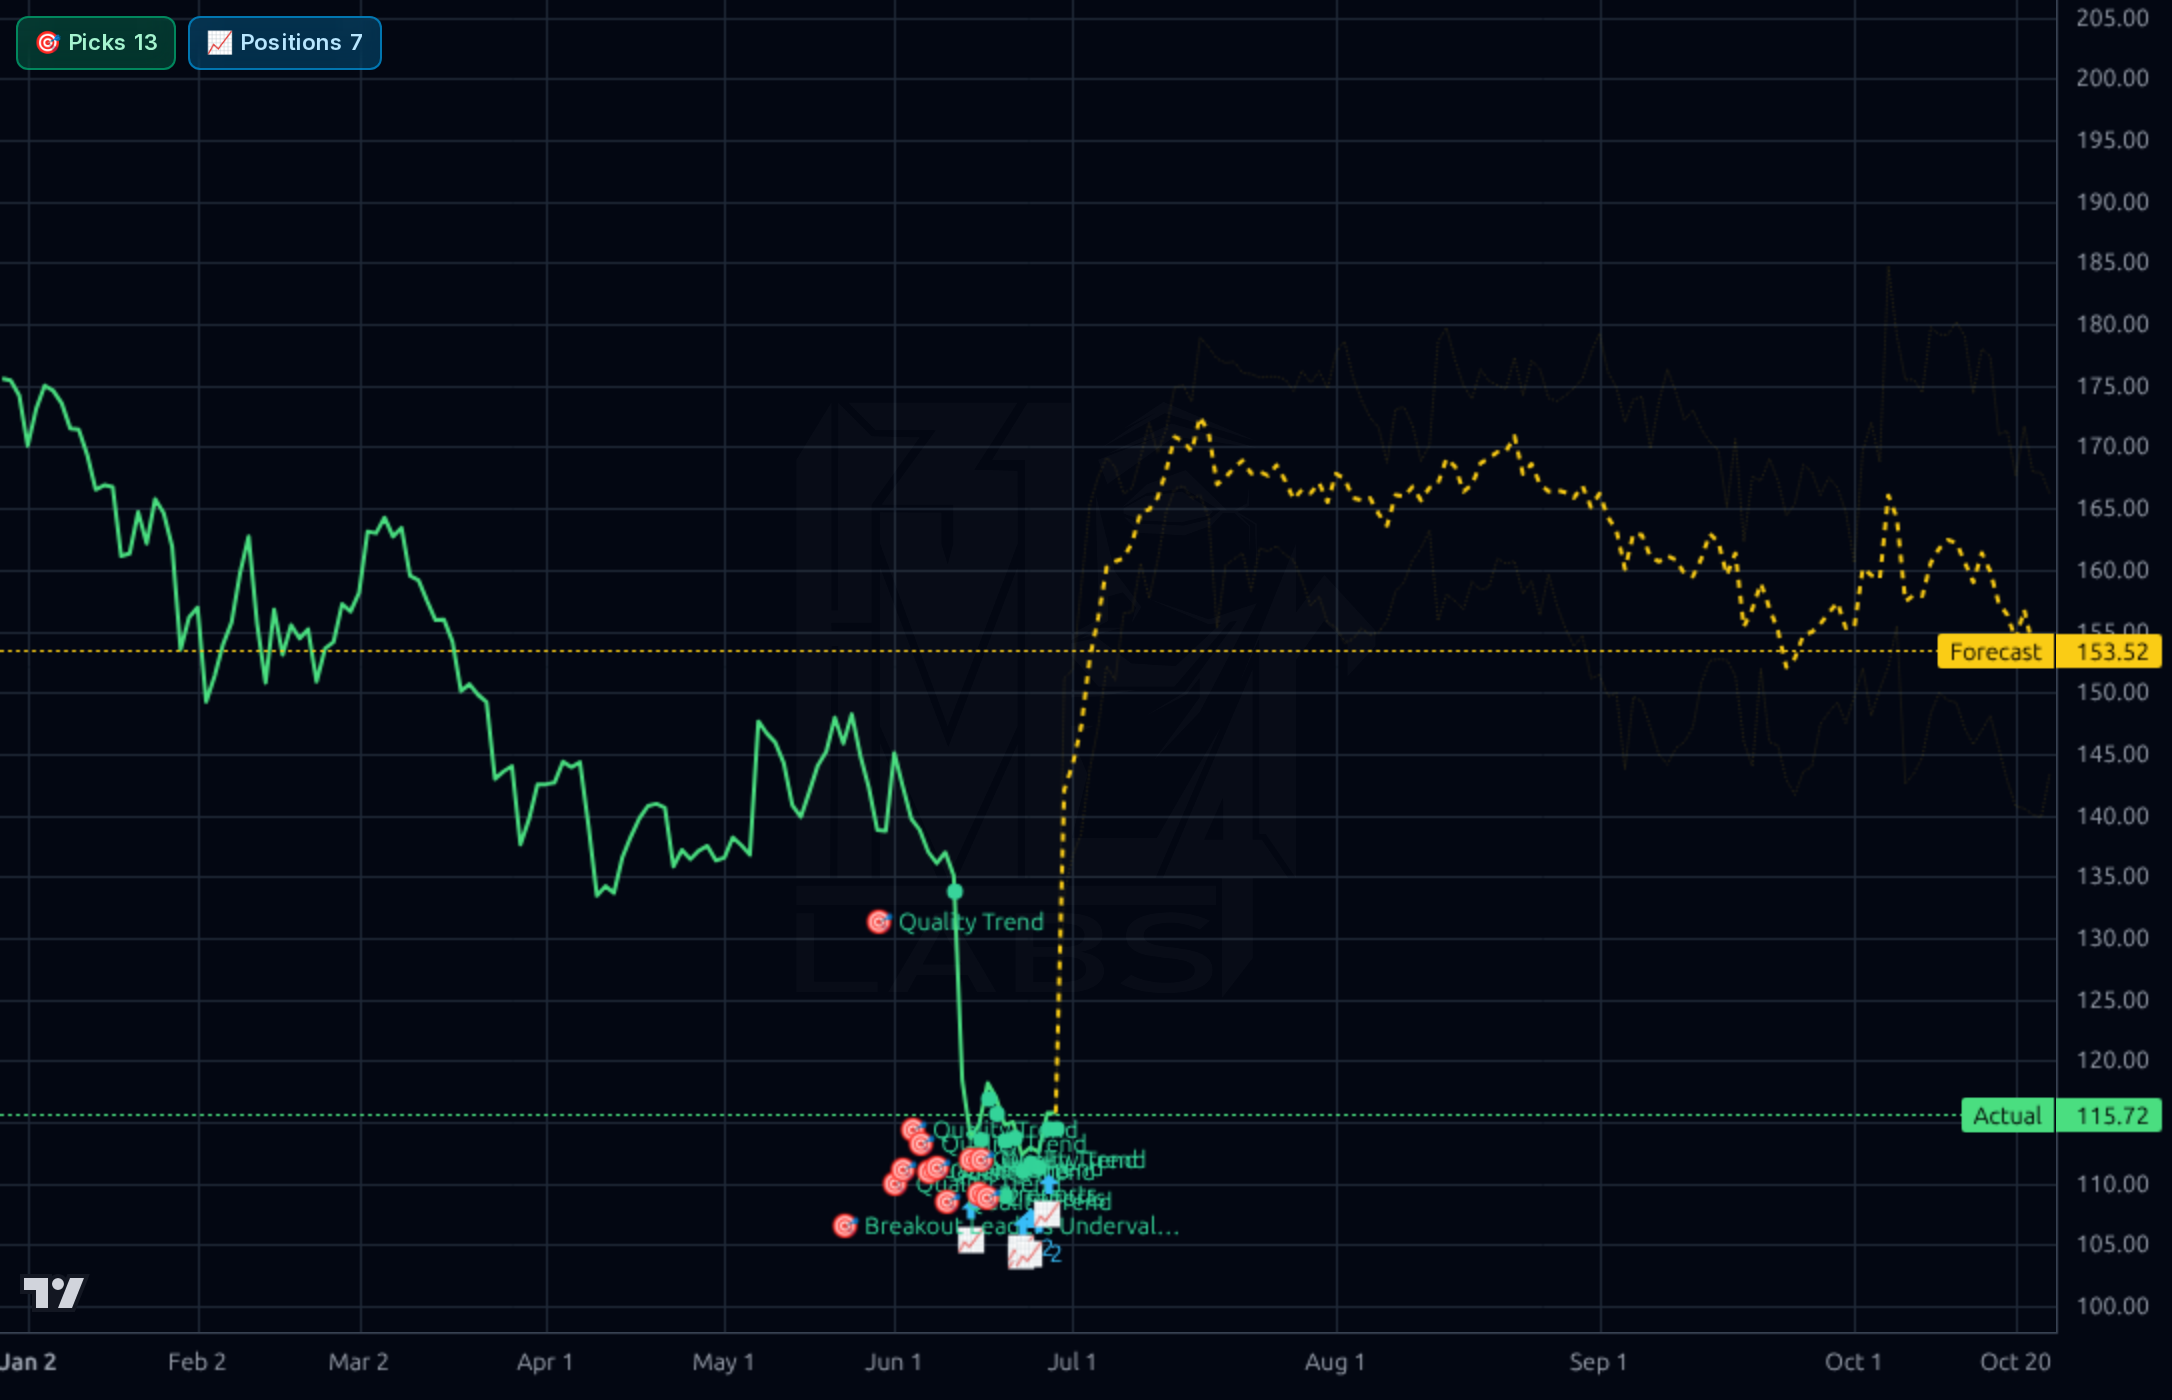
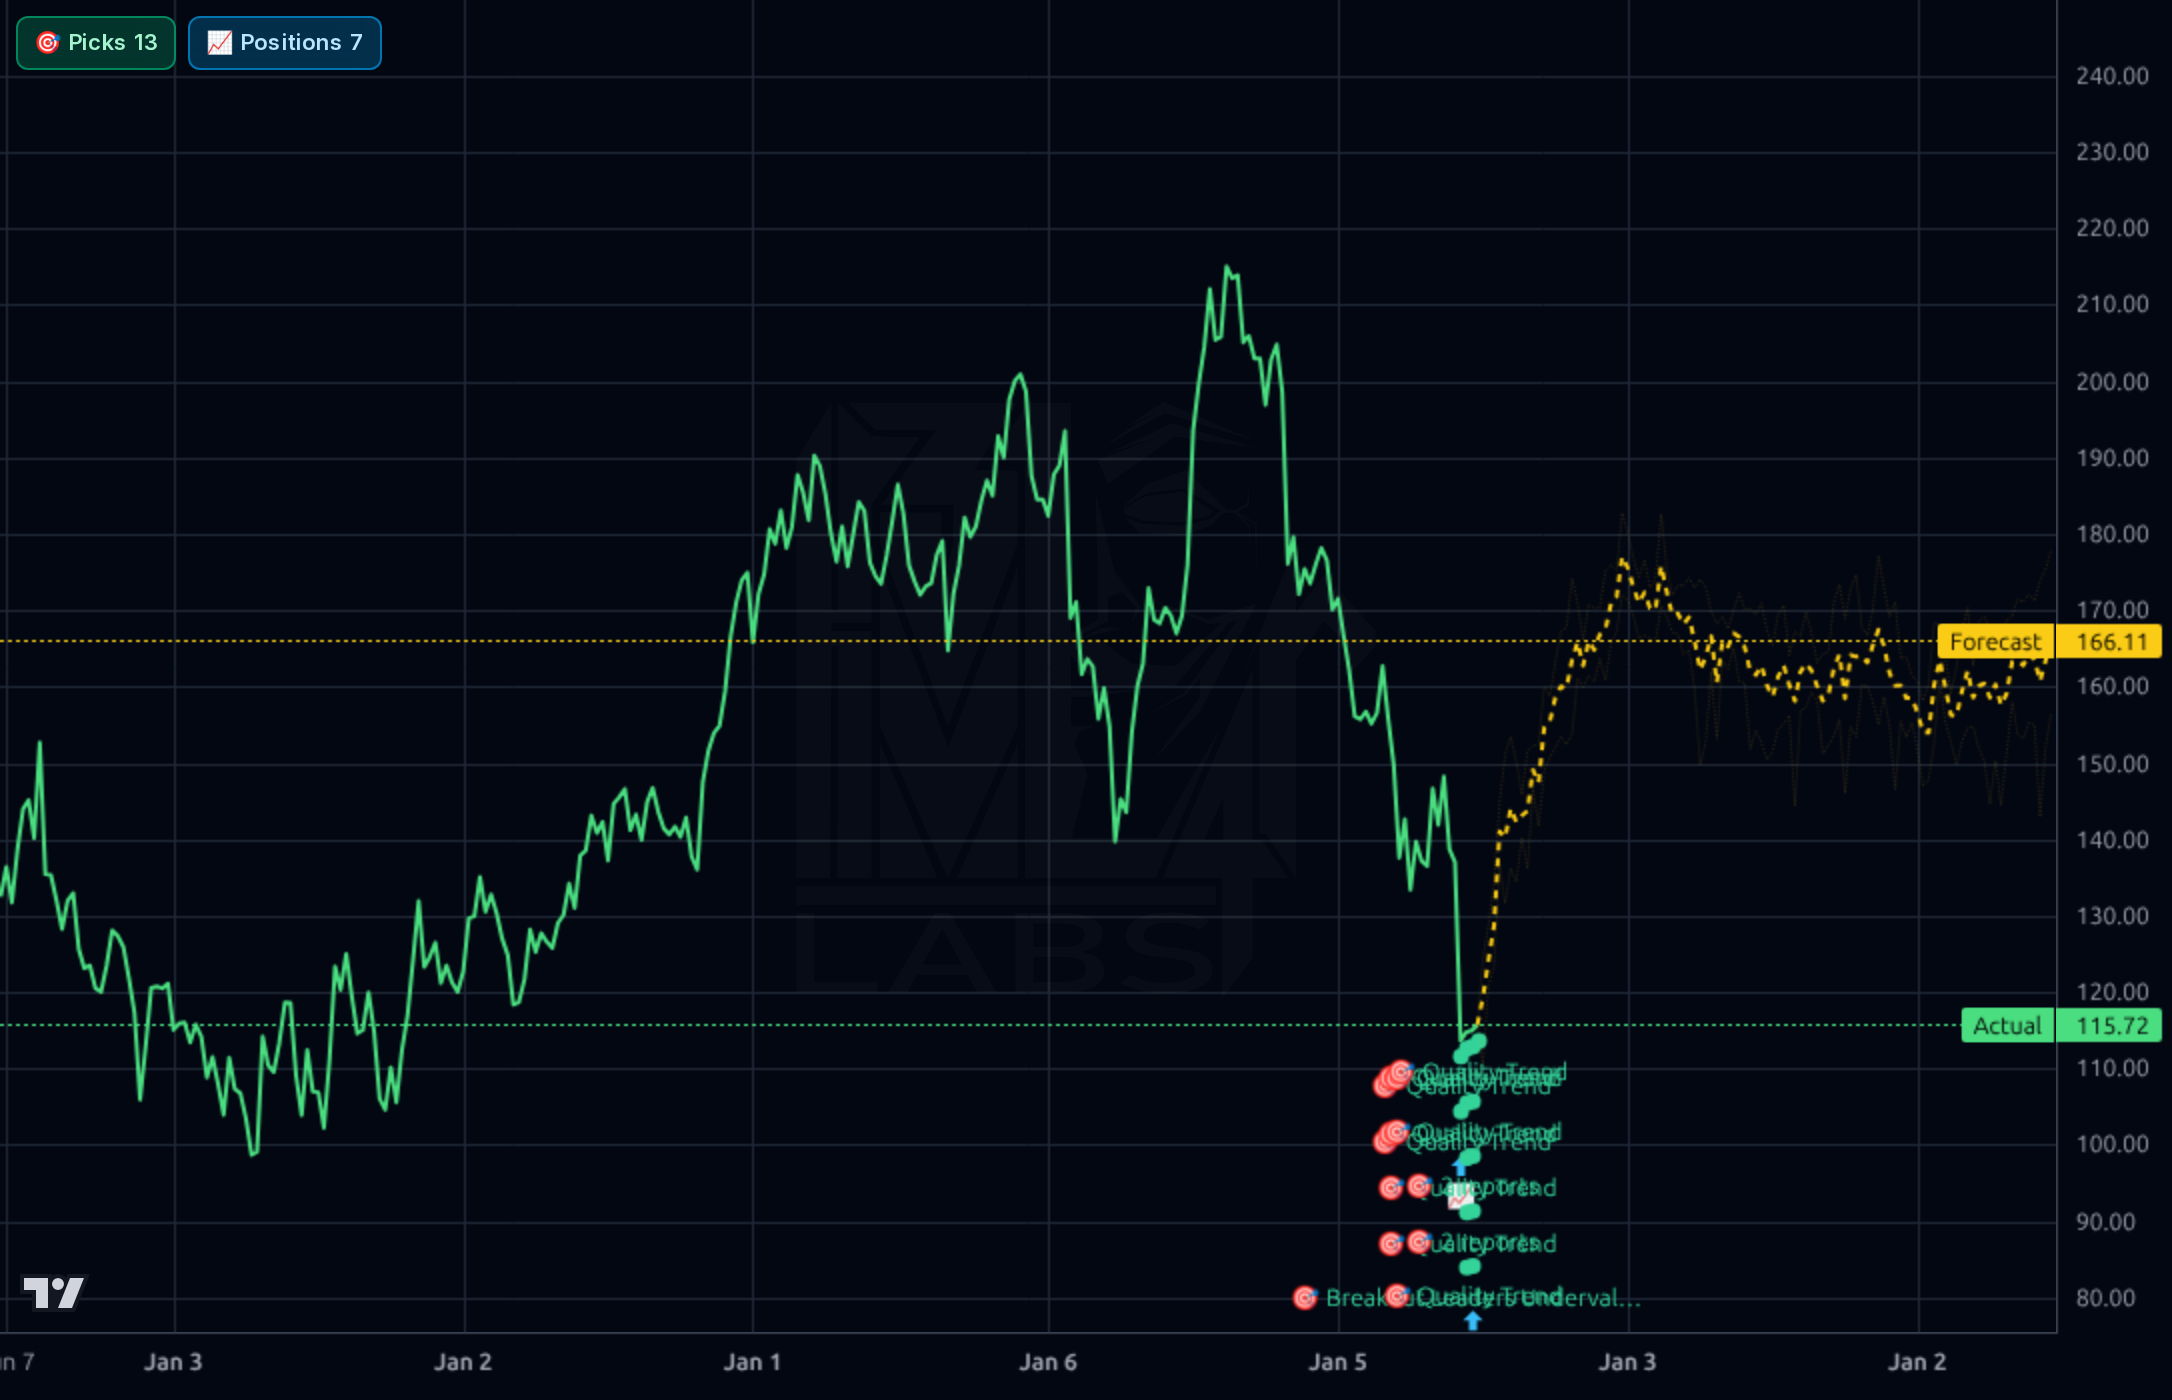
Across every timeframe the price action is severely damaged. The weekly chart shows a complete failure from ~$215 highs in early 2025 down to $115.72, breaking through $150 and $130 support with no meaningful bounce. The daily and 4h charts show a capitulation gap in mid-June from ~$135 straight to ~$115 with limited recovery — classic post-earnings/news shock pattern. SMA20 -7.98%, SMA50 -14.27%, SMA200 -29.32% confirms downtrend on every horizon. RSI 33.6 is approaching oversold but not extreme. The 1h chart shows price stabilizing in a tight $110-$118 range with multiple 'Quality Trend' picks clustering here — basing behavior but no confirmed reversal. The Kronos forecast bands project a sharp V-recovery to $130-$165, which contradicts the realized 11% directional accuracy on the 1d horizon (worse than naive); I would treat the yellow forecast as aspirational rather than predictive. Key levels: support at $108.50 (52-wk low), then air below; resistance at $130 (gap fill / BNP target), then $145-$150 (prior consolidation).
The signal-laden items: (1) BNP Paribas initiated coverage at Neutral with a $130 PT on Jun 18 — that's only ~12% upside and below the broader sell-side consensus target of $181, suggesting analyst dispersion is widening post-drawdown. (2) PTC launched 'PTC Orbit' on Jun 11, a cloud-native 'as-maintained' system of intelligence unifying PLM/ERP/CRM/IoT/EAM/FSM data — a credible AI-era product launch that extends the platform story. (3) SeekingAlpha (Jun 16) frames the pullback as interesting given recurring CAD/PLM SaaS cash flows and a post-IoT-sale strategy, hinting at portfolio rationalization. (4) ChartMill flags the name as a Peter Lynch GARP candidate (PEG 0.47 their calc, P/E 12, ROE 32%). Noise: generic 'stocks to own for decades' listicles and the Barchart underperformance recap. Net: news is constructive on product and valuation, but there's no clear catalyst to reverse the technical damage near-term.
- PTC Orbit (launched Jun 11) — cloud-native 'as-maintained' intelligence layer unifying PLM/ERP/CRM/IoT/EAM/FSM, positioning PTC for the AI-enabled enterprise data fabric narrative
- Post-IoT-sale capital reallocation (referenced in SeekingAlpha Jun 16) — divestiture proceeds could fund buybacks at depressed price or bolt-on AI/PLM acquisitions
- SaaS migration of CAD installed base via Onshape and Arena — Sales Y/Y TTM at 27.75% suggests ARR conversion is still in early innings
- Codebeamer ALM cross-sell into regulated industries (auto, medical, aerospace) where software-content-per-product is rising
- Servigistics / ServiceMax service-lifecycle bundle as recurring revenue layer on top of the design tools
- Technical damage is severe: -47% from 52-wk high, -33.6% YTD, -29.3% vs 200-day SMA — capitulation may not be complete and a retest of $108 low is plausible
- Kronos AI forecast directional accuracy on 1d is 11% vs 89% naive baseline — model is actively unreliable in this regime, do not trust the V-recovery shape
- Q1 FY26 (Dec-25) operating income only $221M on $686M revenue vs Q2 $296M on $774M — quarterly lumpiness in bookings/perpetual license recognition can spook the market again
- $1.38B debt vs $439M cash; while D/E 0.36 is fine, rising-rate refinancing risk if a recession hits enterprise software budgets
- Competitive pressure from Autodesk, Dassault Systèmes, Siemens in PLM/CAD, and from hyperscalers building generative-design AI natively
- BNP Paribas Neutral with $130 PT (Jun 18) signals at least one credible sell-side house sees limited upside even from these levels
- Inst Own at 102% (snapshot anomaly, but indicates very crowded institutional positioning) — further forced selling if any large holder exits could cascade
Get AI analysis on any stock
This is one of hundreds of Kronos AI reports — scored fundamentals & technicals, bull/base/bear price targets, a multi-horizon plan, and continuously-updated forecasts across the market. Create a free account to explore them all.
Create your free account →Already a member? Sign in · Join our Discord