SUN — AI Stock Forecast & Price Targets
Published 7/6/2026 · A free sample of K3vl4r’s AI-powered analysis.
Kronos price forecasts, scored fundamentals & technicals, and a multi-horizon plan.
View the live SUN price forecast →
Sunoco LP trades at $68.28, near 52-week highs, riding post-NuStar integration momentum with Q1 2026 revenue +106% Y/Y and a 5.49% distribution yield backed by a ≥5% growth commitment. However, the setup is stretched: 21.7x forward P/E, 158% payout ratio, 1.85x D/E, and TTM FCF of only ~$115M against multi-hundred-million distribution obligations. With a binary August 4 earnings print ~29 days out and price rejecting the $72.88 high, HOLD is the disciplined stance.
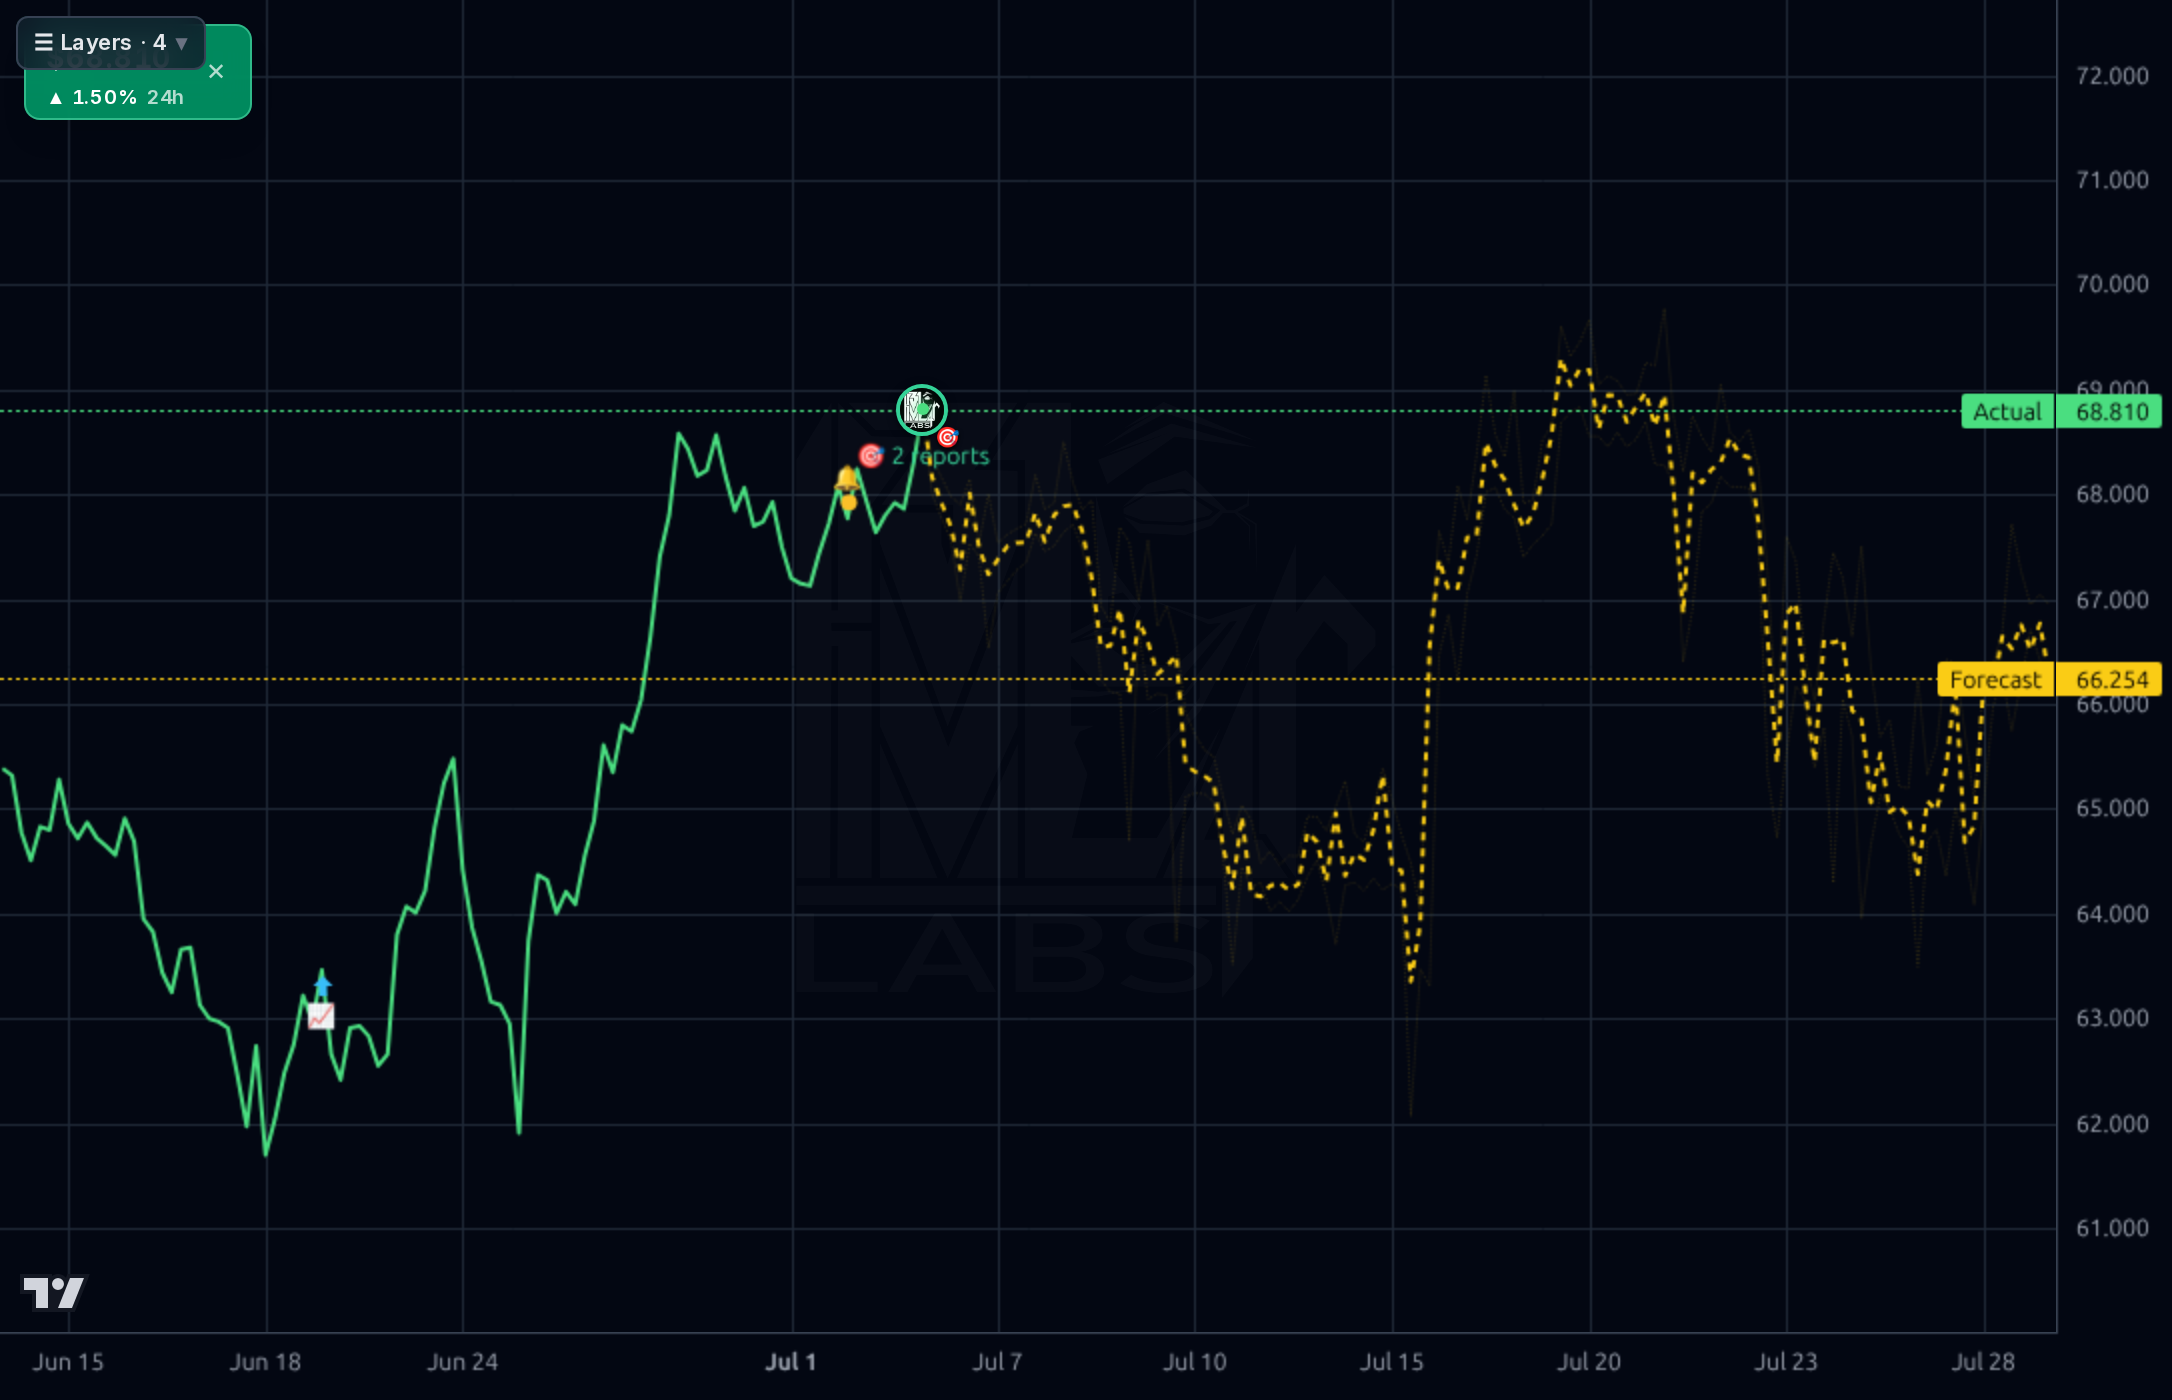
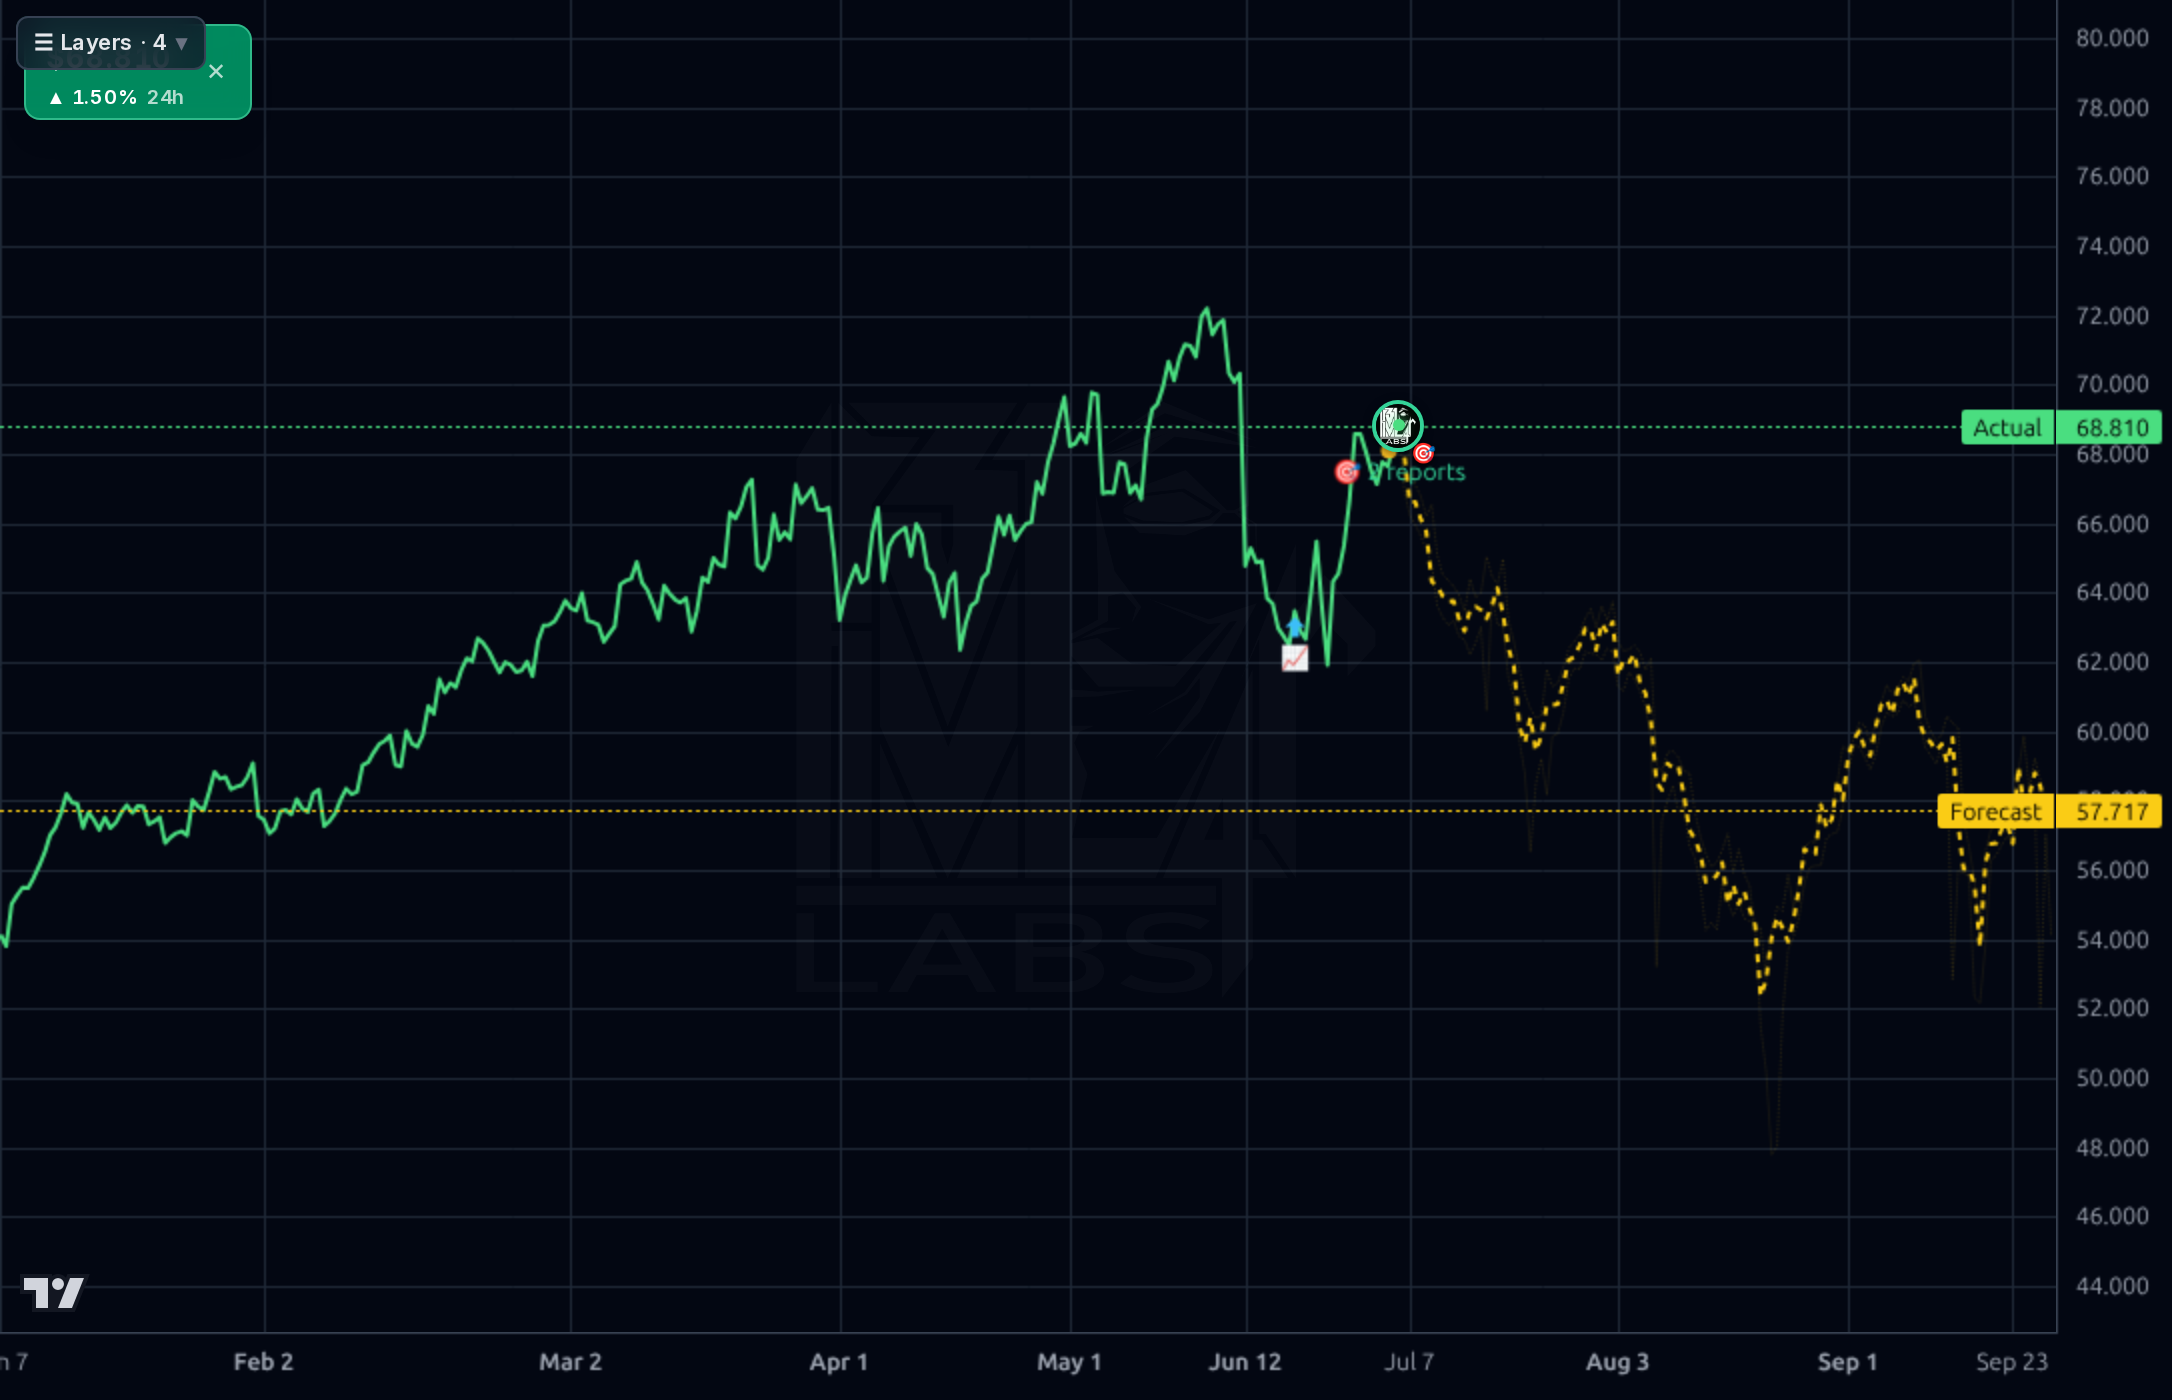
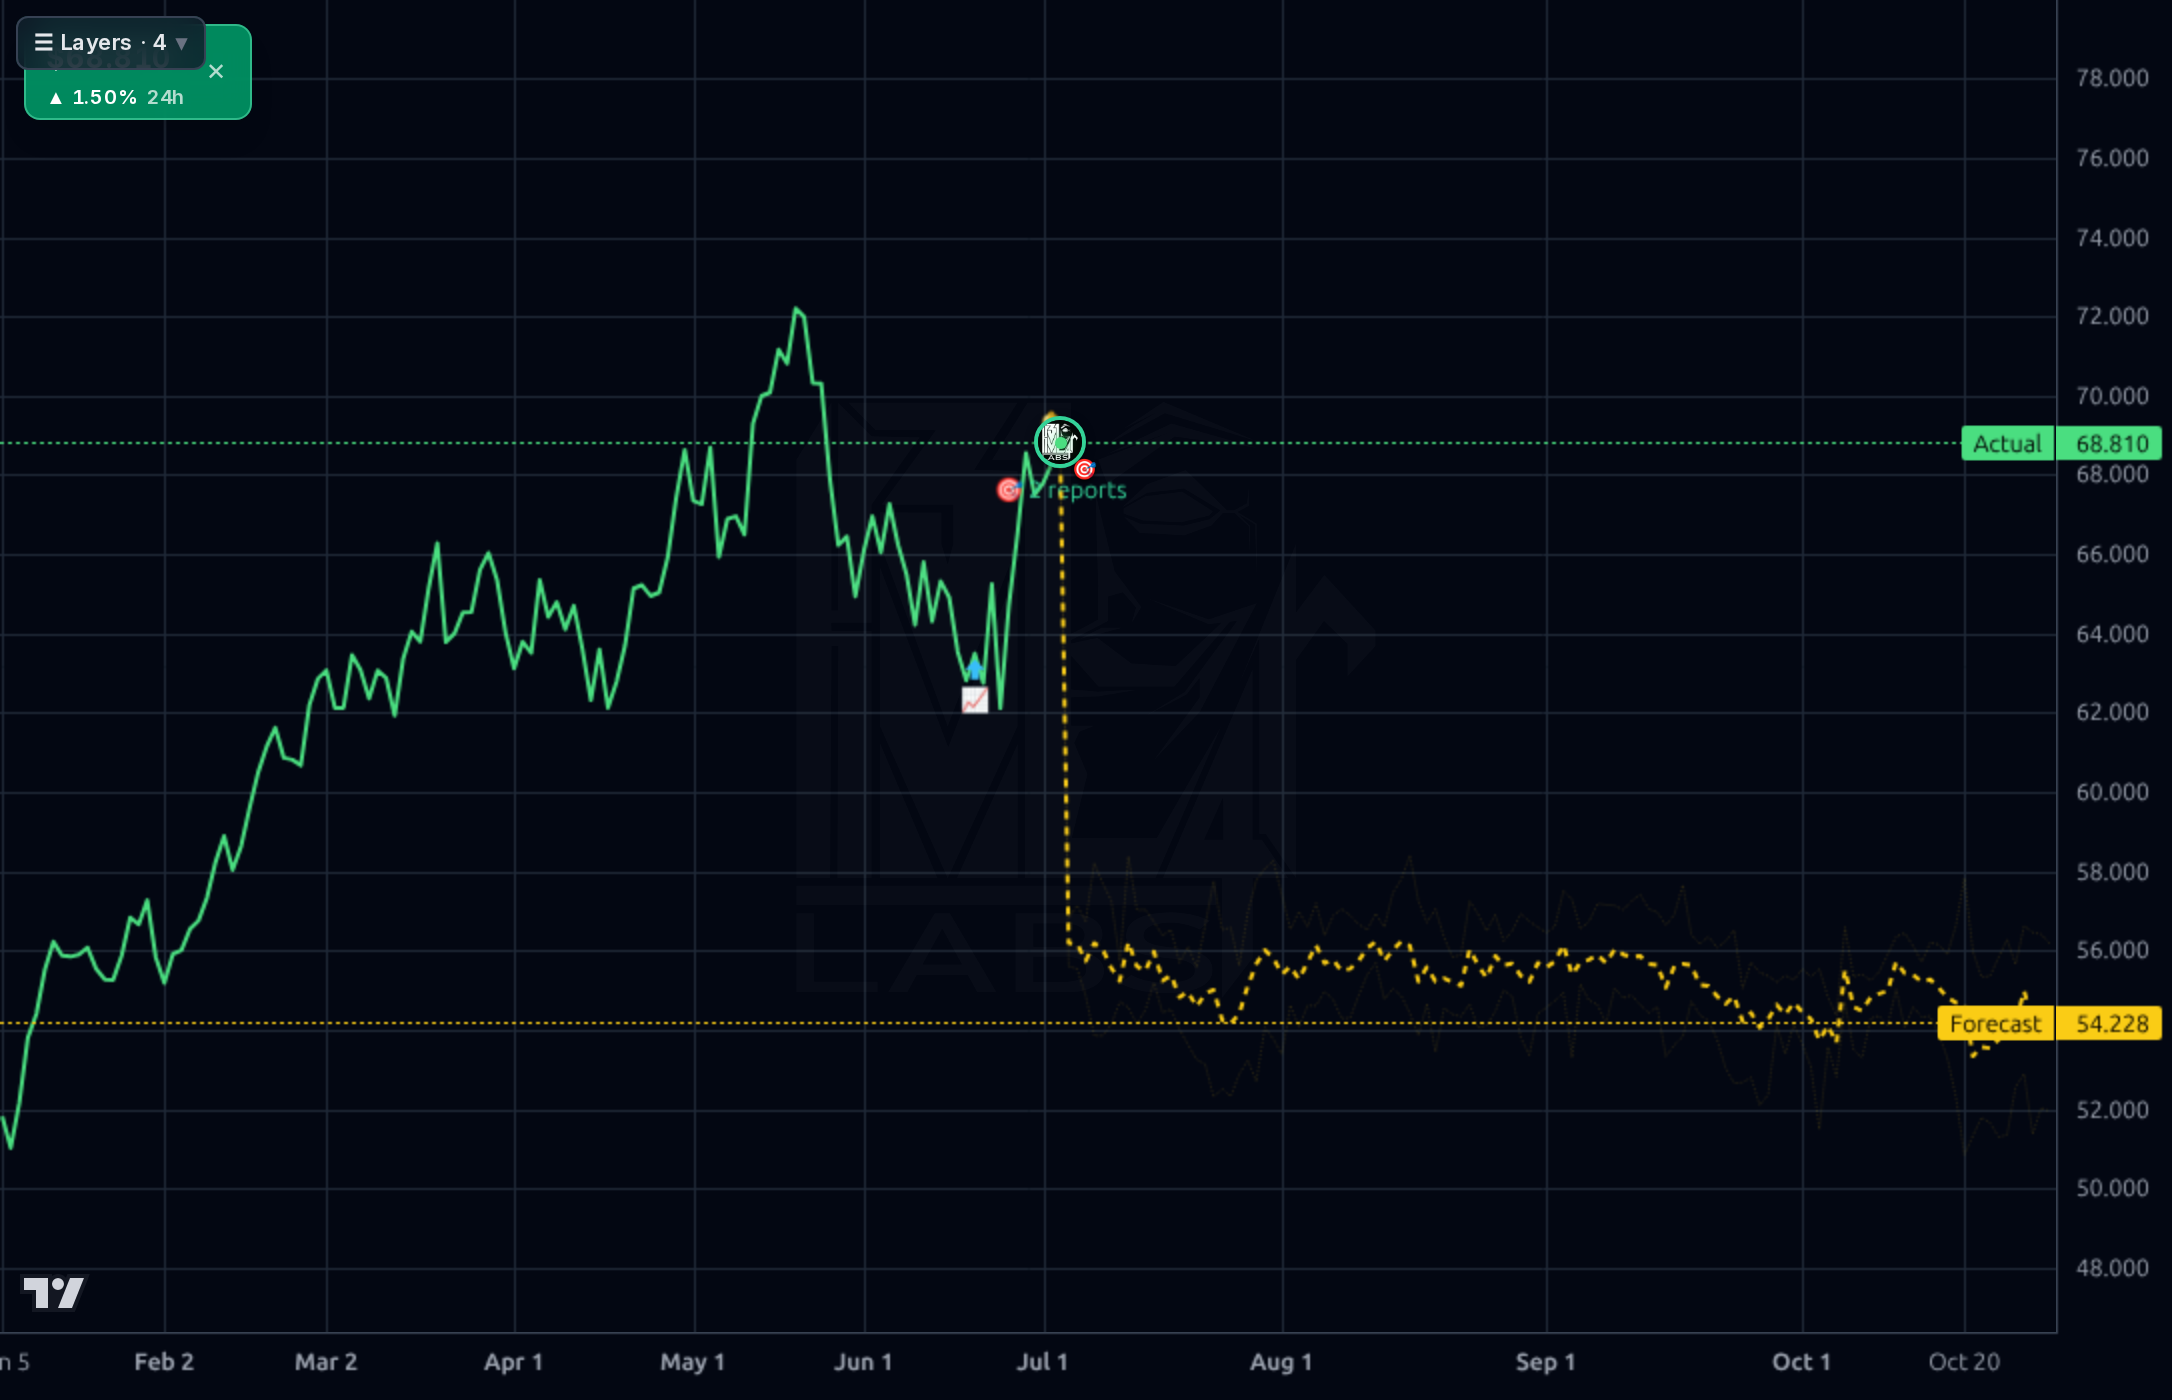
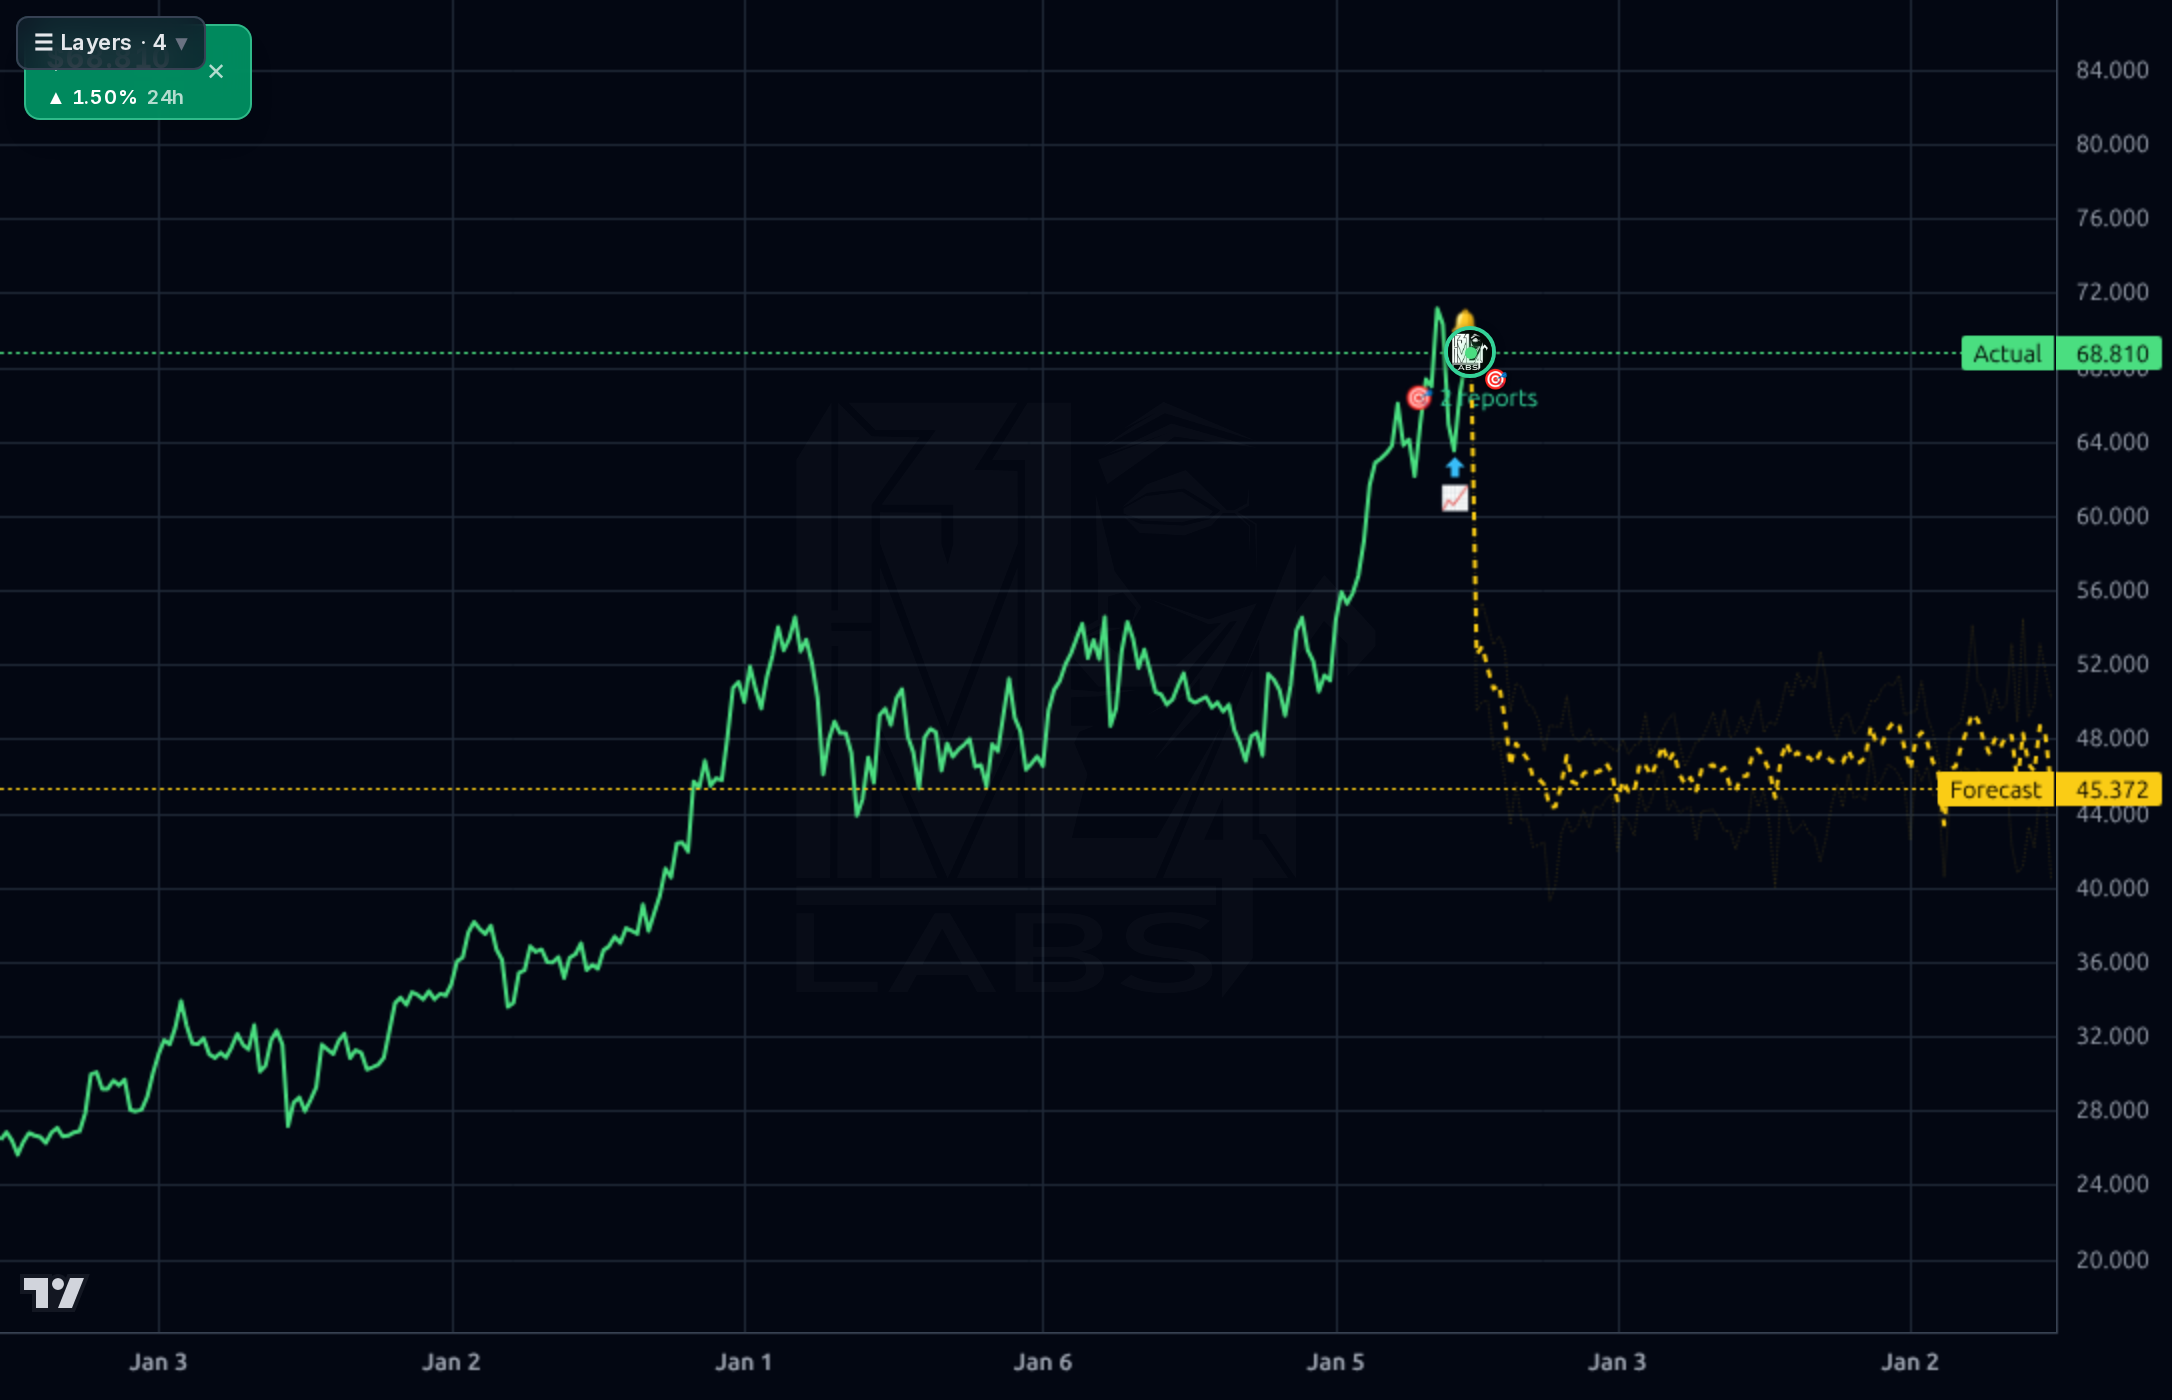
1-4 week view: HOLD into the August 4 earnings print (~29 days away). This is a binary catalyst with implied volatility likely to expand into and crush after. No edge in initiating either direction here: technicals bullish, valuation stretched, and the AI bearish forecast has been unreliable in this regime. Existing holders: consider trimming 10-20% if price tags $71-72 (52W high rejection zone) to fund a potential post-earnings re-entry. Invalidation for the constructive setup: a daily close below $65 (breakout support); a break of $62 opens $60. Do NOT chase >$70 pre-print.
1-6 month view: The base case is that SUN grinds sideways to modestly higher into the earnings print, then trades on the beat/raise vs coverage-ratio narrative. If Q2 confirms the EBITDA guide ($3.10-3.30B) AND management shows organic DCF/distribution coverage improving toward parity, the stock can re-rate toward $76-80. If forward EPS decline ($3.14 vs $3.92 trailing) is confirmed and coverage stays deteriorated, expect multiple compression toward $60-62. Expected return range: -10% to +15% over 6 months. Catalysts: Aug 4 earnings, bolt-on M&A announcements (magnitude and multiples paid), Fed rate path (D/E 1.85 makes SUN rate-sensitive). Change my mind: a decisive breakout above $73 on volume with a coverage-ratio upgrade would move me to ACCUMULATE.
1-3 year view: SUN is a leveraged income compounder whose terminal value depends on (1) whether NuStar synergies and midstream fee-based cash flows can grow DCF fast enough to cover the ~5.5% distribution organically without perpetual debt/equity issuance, and (2) whether the fuel distribution segment can defend volumes against a slow-motion EV transition. If management executes the >$500M/yr bolt-on cadence at reasonable multiples and closes the coverage gap by 2027, this is a $80-90 stock with a growing 5%+ yield — total return of 8-12% annualized. Biggest structural risk: a rate shock or credit-market seize-up that forces distribution cut, which would trigger 30-40% drawdown given the yield-buyer base. MLP K-1 tax structure also caps the institutional buyer pool.
The post-NuStar transformation is the dominant fundamental story: Q1 2026 revenue of $10.69B (+106% Y/Y), net income of $392M vs $45M in Q2 2025, and total assets expanded from $14.4B in June 2025 to $30.3B by March 2026. Operating margins improved to 8.09% in Q1 2026 from 3.7% in mid-2025, and EBITDA reached $1.17B in the quarter. However, quality-of-earnings concerns are real: trailing EPS of $3.92 is projected to fall to $3.14 forward (Finviz shows EPS next Y -16.87%), meaning current profitability likely includes non-recurring acquisition accounting benefits. The balance sheet is stretched — $15.4B total debt against only $718M cash, D/E of 1.85, and TTM FCF of just $115M cannot cover the $3.75/share TTM dividend (158% payout ratio) that consumes ~$513M annually. The gap is being funded by debt/equity issuance, which works while rates cooperate but is structurally fragile. ROE of 15.4% flatters the equity base after acquisition goodwill. This is a leveraged roll-up income vehicle, not a self-funding cash machine.
Across timeframes, the trend is constructive but extended. The weekly chart shows a multi-year uptrend from ~$28 in early 2023 to the current $68.28, with a clean higher-highs/higher-lows structure. The daily chart shows price consolidating just below the $72.88 52-week high after a sharp late-June rally from the $62 low. The 1h chart shows short-term topping behavior with a slight rejection from $69. Price sits +14.9% above SMA200, +4.5% above SMA20, and RSI at 56.57 — momentum positive but not overbought. Support tiers: $65 (recent breakout), $62 (late-June swing low), $60 (psychological). Resistance: $70 (near-term), $72.88 (52W high), then open air. The Kronos AI forecast bands are aggressively bearish across all timeframes (1d $66.25, 4h $57.71, 1d $54.22, 1wk $45.37), but realized directional accuracy is 28% on 1d and 0% on 1wk vs naive baselines of 72% and 100% — the model has been systematically wrong in this uptrend regime and should be heavily discounted. The signal I take is that the AI is pricing mean-reversion that the market keeps refusing to deliver.
The signal news is the 8-K filed today (July 6, 2026) redomiciling SUN from Delaware to Texas — a corporate housekeeping item with modest governance implications but no operational impact. The substantive story remains the Q1 2026 print: Simply Wall St reports SUN beat profit and revenue expectations, reaffirmed FY adjusted EBITDA guidance of $3.10–3.30B, confirmed >$500M of 2026 bolt-on M&A, and reiterated ≥5% annual distribution growth. Barclays raised its price target to $75 (from $73) on June 23, reflecting institutional confidence in midstream execution; the consensus target is $75.86. ChartMill flags a favorable technical setup with declining volatility near the 52-week high. Zacks notes an ABR of 1.50 (Buy). Noise to discount: retail sentiment includes crypto-token confusion (TRON's $SUN token) that inflates X/Stocktwits volume and misrepresents equity sentiment. Broader energy context is neutral to constructive.
- Execute >$500M in bolt-on M&A during 2026 as management guided — announcement cadence and multiples paid will drive re-rating
- Deliver on FY 2026 adjusted EBITDA guide of $3.10-3.30B (~24% growth), a key earnings catalyst on Aug 4
- Realize remaining NuStar integration synergies to lift Pipeline Systems/Terminals segment margins
- Grow the distribution by at least 5% annually per management commitment, sustaining income-buyer demand
- Diversify further into fee-based midstream cash flows to reduce sensitivity to fuel distribution volumes
- Texas redomiciliation (per July 6 8-K) may modestly benefit governance flexibility and tax posture
- Distribution coverage gap: 158% payout ratio with TTM FCF of only ~$115M — funded via debt/equity issuance, structurally fragile if rates rise
- Forward EPS ($3.14) projected below trailing ($3.92) — market may be pricing peak earnings; forward P/E 21.7x is not cheap on normalized EPS
- Leverage: $15.4B debt vs $718M cash, D/E 1.85 — highly sensitive to any long-end rate repricing
- Binary Aug 4 earnings catalyst with stock near 52-week high and +30% YTD; a beat is largely priced in, disappointment risk is asymmetric
- Secular EV adoption is a slow-burn headwind to fuel distribution volumes (revenue segment mix)
- MLP K-1 tax structure limits institutional ownership base (48.72% inst own is lower than a typical mid-cap C-corp)
- Concentration risk: 21.89% insider ownership creates governance dynamics that may not always align with public unitholders
Get AI analysis on any stock
This is one of hundreds of Kronos AI reports — scored fundamentals & technicals, bull/base/bear price targets, a multi-horizon plan, and continuously-updated forecasts across the market. Create a free account to explore them all.
Create your free account →Already a member? Sign in · Join our Discord