TCOM— AI Stock Forecast & Price Targets
Published 6/14/2026 · A free sample of K3vl4r’s AI-powered analysis.
Kronos price forecasts, scored fundamentals & technicals, and a multi-horizon plan.
View the live TCOM price forecast →
Trip.com trades at $46.47, near 52-week lows and ~41% off highs, despite robust fundamentals: 53% net margins, 21% ROE, ~$72bn cash vs $32bn debt, and 22.5% Q/Q sales growth. The disconnect between depressed price/sentiment (YTD -35%, RSI 35) and quality of the business creates an attractive risk/reward, though Kronos 1d/1wk forecasts suggest the bottoming process may be choppy with limited near-term upside.
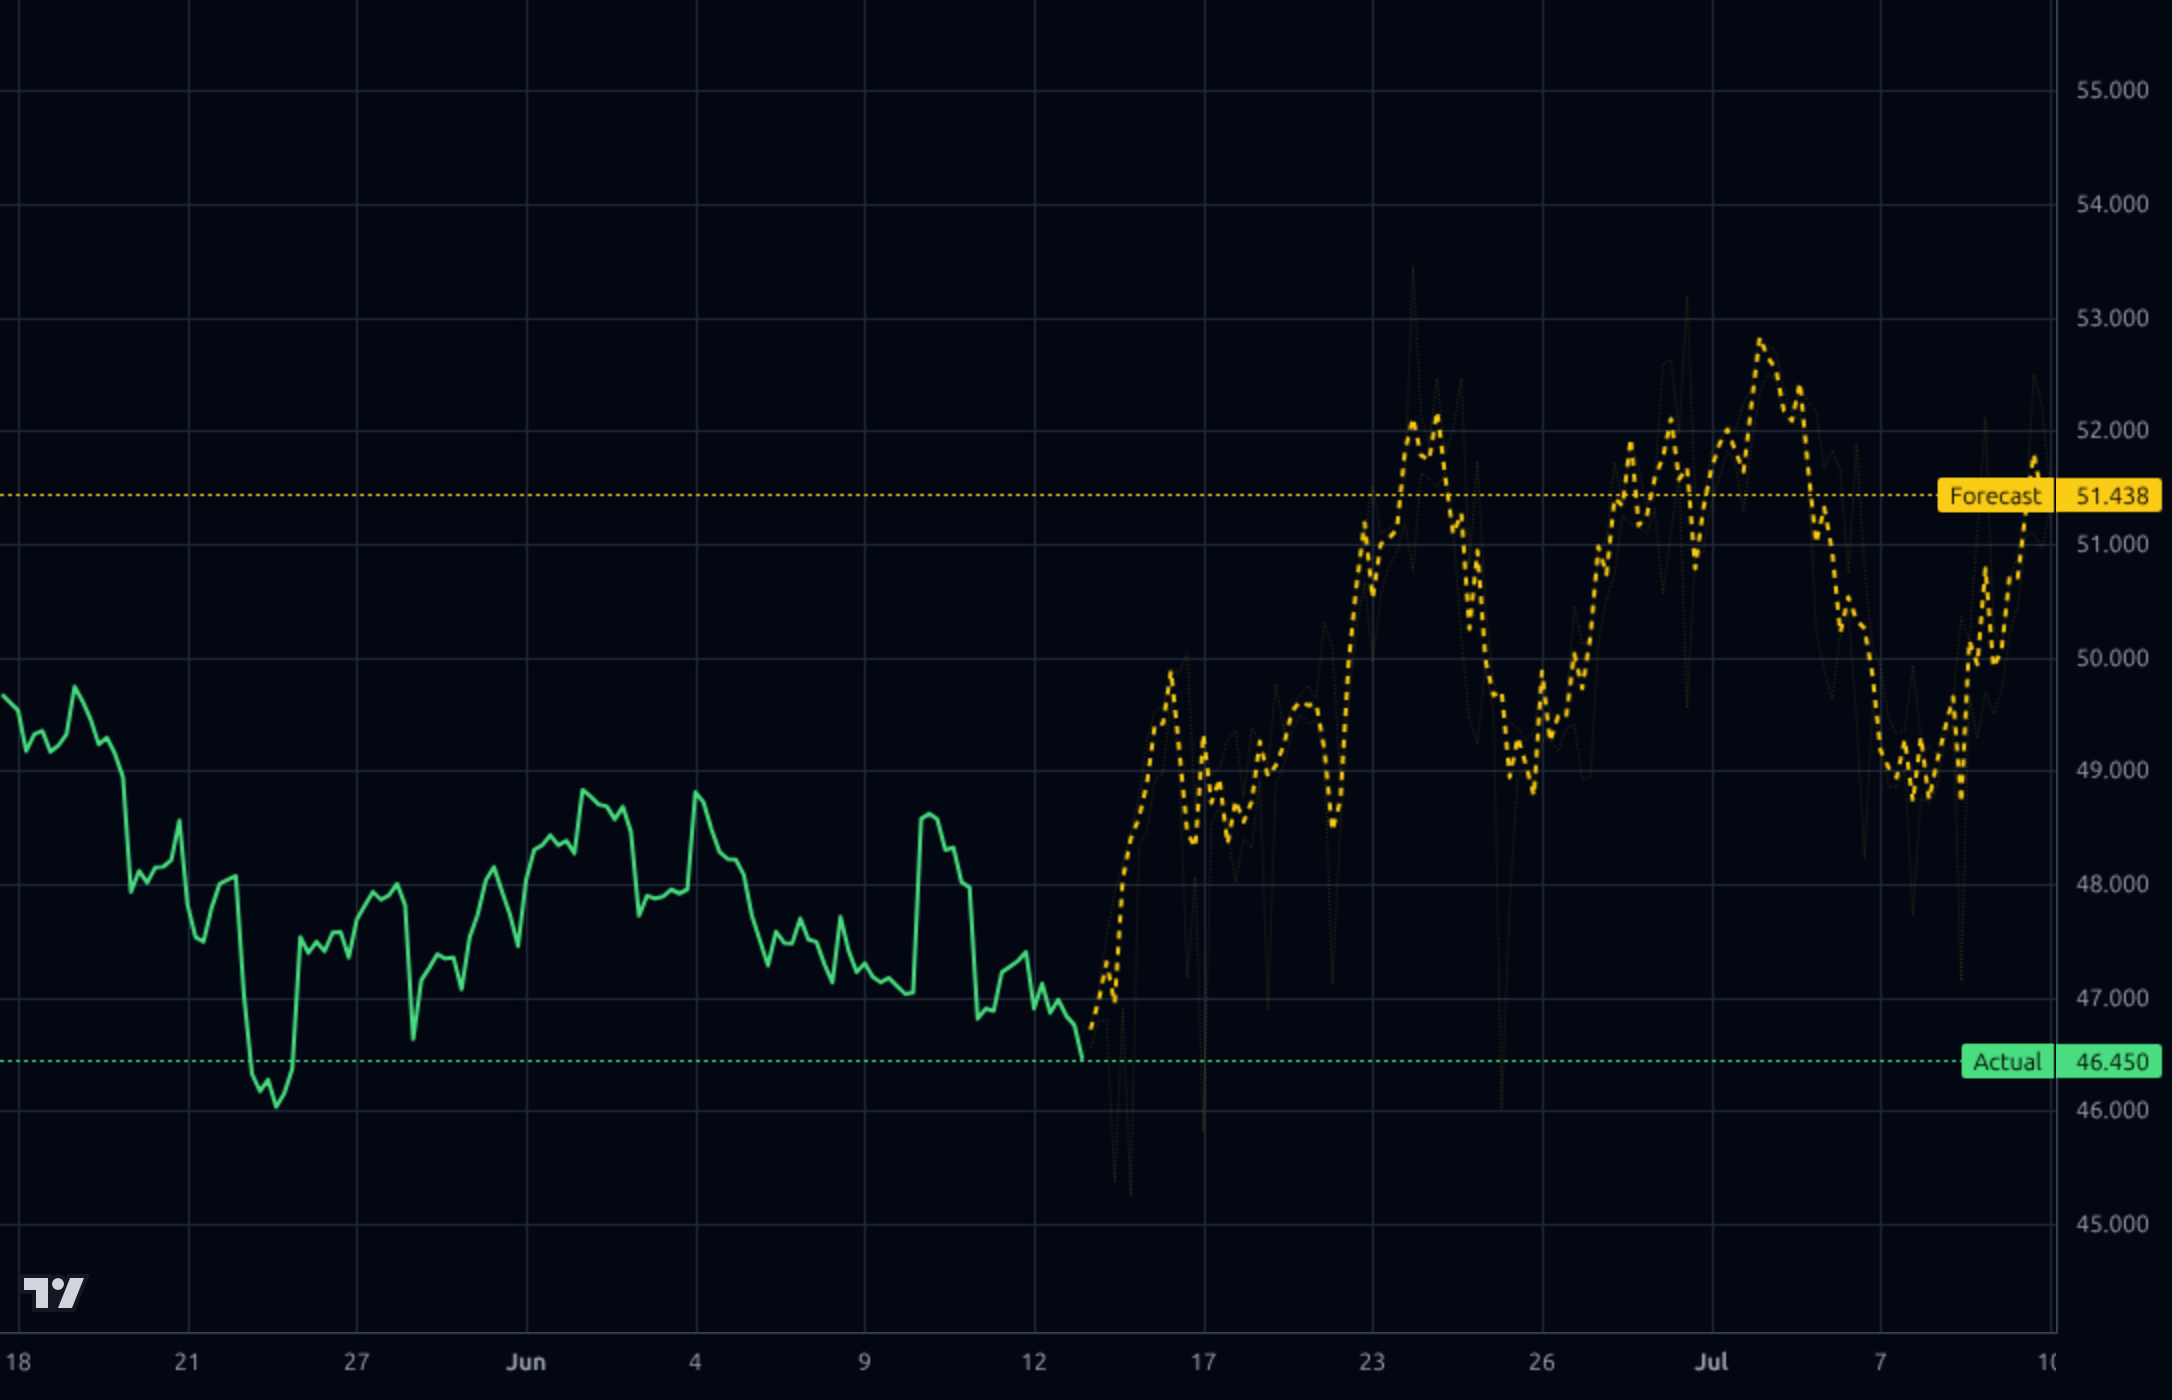
Tactical small long into the June 24 earnings print, with TCOM at $46.47 just above the 52-week low of $45.92. RSI 35.5 and the Kronos 1h forecast pointing to $51.44 support a mean-reversion trade. Size at 1/3 of full position; add on confirmation post-earnings. Stop below $45.50 (invalidates the double-bottom). Target $51-52 for first scale; trim half if reached pre-earnings.
Accumulate over 1-6 months on the thesis that travel demand remains structurally strong and TCOM's 6.6x trailing/9.9x forward P/E with 21% ROE is mispriced. Expected return range +20% to +40% to $55-65 if earnings confirm the growth trajectory and macro sentiment toward China consumer stabilizes. Catalysts: Q1 2026 earnings (Jun 24), Q2 print, summer travel season data, potential buyback or dividend increase (current yield 0.21% — capacity exists with CN¥40bn net cash). Thesis breaks if Q1 shows decelerating bookings, margin compression below 22% operating, or guidance cut.
1-3 year terminal view is constructive. Trip.com is the dominant Chinese OTA with growing international franchise (Skyscanner, Trip.com brand). Multi-year drivers: outbound Chinese tourism recovery (still below 2019 levels), international take-rate expansion, AI-driven travel personalization, corporate travel rebound via Trip.Biz. At ~10x forward earnings with 17%+ revenue growth, multiple re-rating to 14-16x is plausible if execution holds. Biggest structural risk: Chinese geopolitical/regulatory overhang (VIE structure, ADR delisting risk, Beijing policy on outbound travel), plus secular pressure on OTA take rates from direct booking and Google Travel.
TCOM's fundamentals are unambiguously strong and at odds with the stock's drawdown. TTM revenue of CN¥62.4bn with 17.3% Y/Y growth (Sales Q/Q +22.5%) and a 3-year sales CAGR of ~43% reflect a durable post-COVID travel recovery and international expansion via Trip.com/Skyscanner. Margin structure is exceptional: 80.6% gross, 25.3% operating, and 53.3% net margin (boosted by investment income but still quality). Q4 2025 showed CN¥15.4bn revenue, CN¥3.88bn operating income, and CN¥4.28bn net income — consistent with the run rate. Balance sheet is fortress-grade: CN¥71.9bn cash vs CN¥31.6bn total debt (net cash ~CN¥40bn, ~20% of market cap), LT debt/equity 0.07, current ratio 1.55. ROE 21.1%, ROIC 17.7%, and CN¥14.4bn operating cash flow vs CN¥2.2bn FCF (capex/investments heavy but manageable). Trailing P/E 6.6, forward P/E 9.9, P/B 1.23, EV/EBITDA 10.2 — cheap for the quality. The 'broken' element is EPS next 5Y estimated at -7.2%, suggesting analysts expect margin normalization after the post-COVID surge.
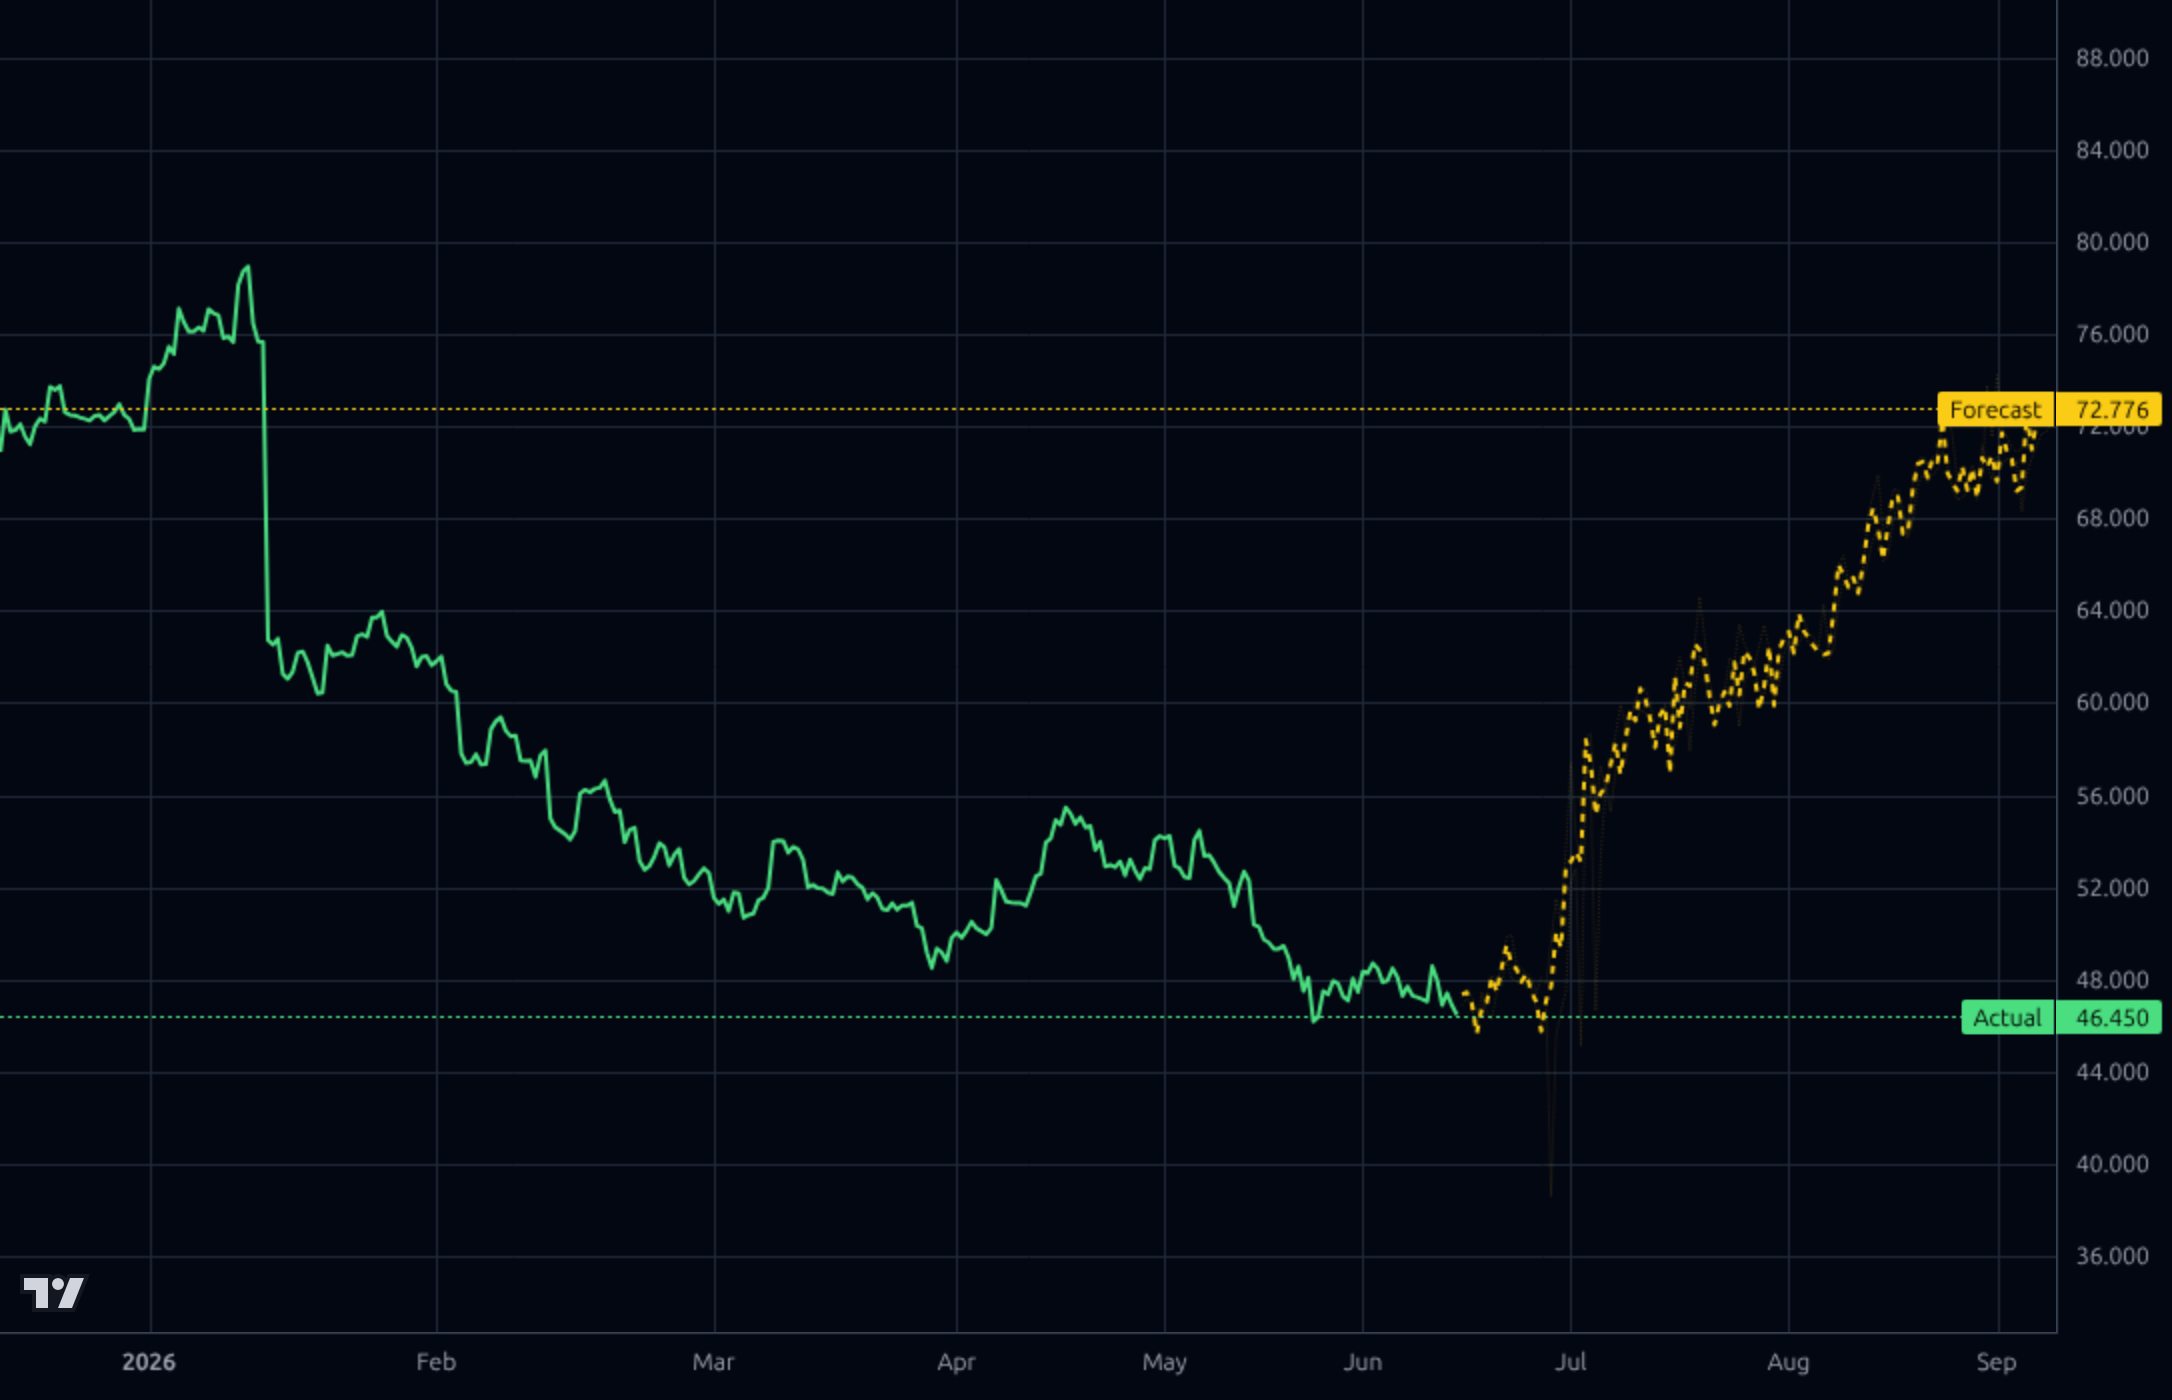
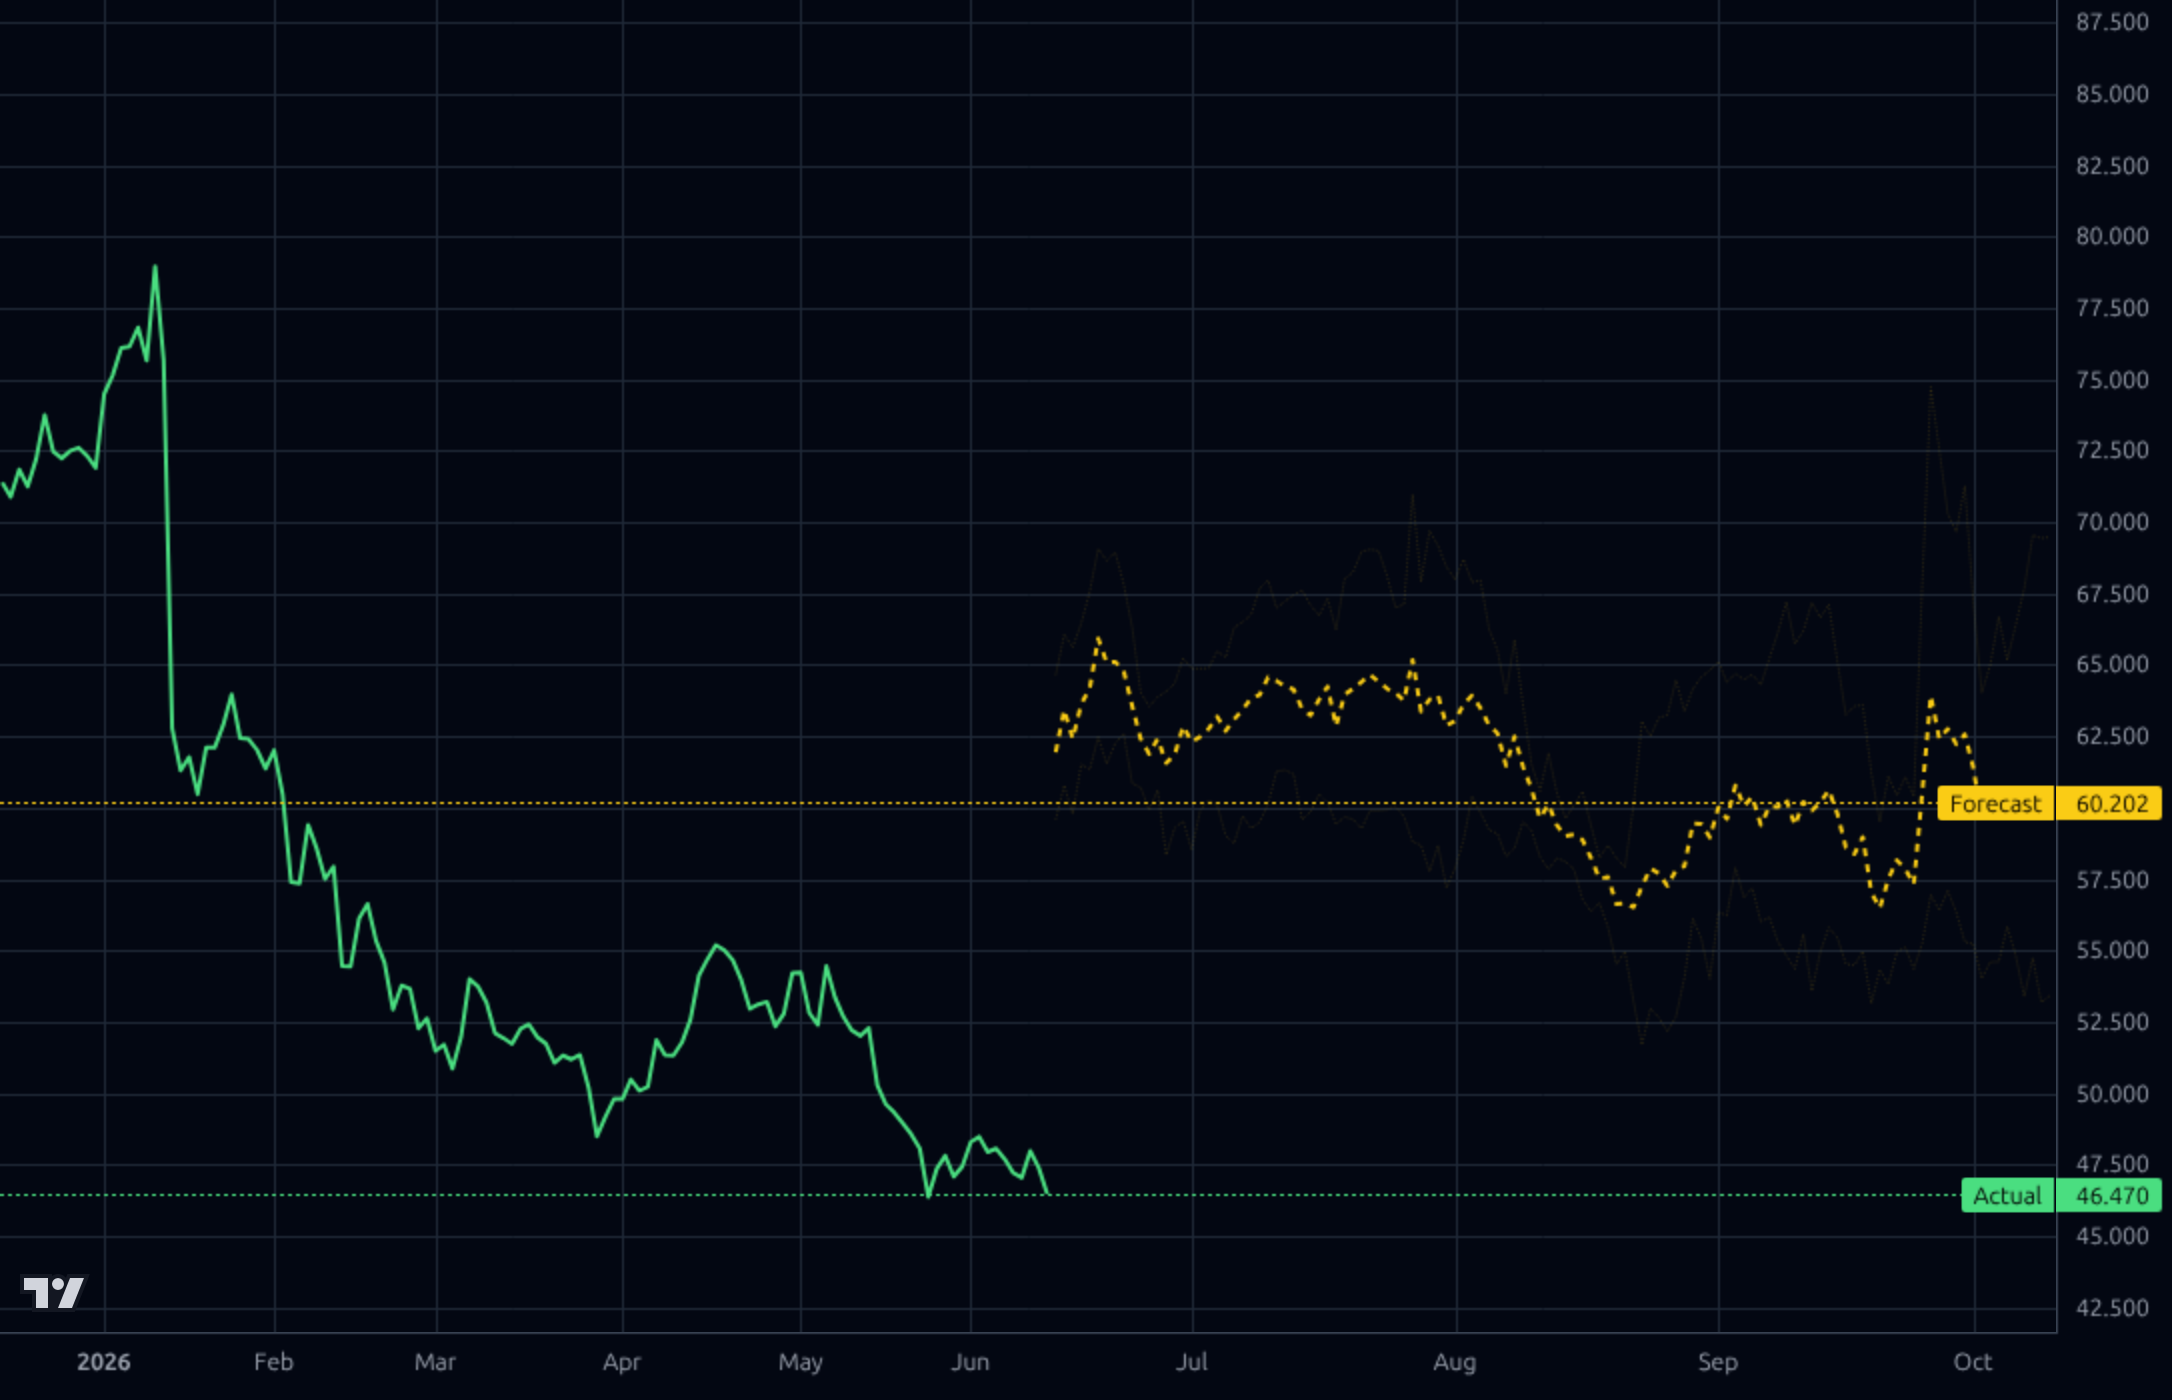
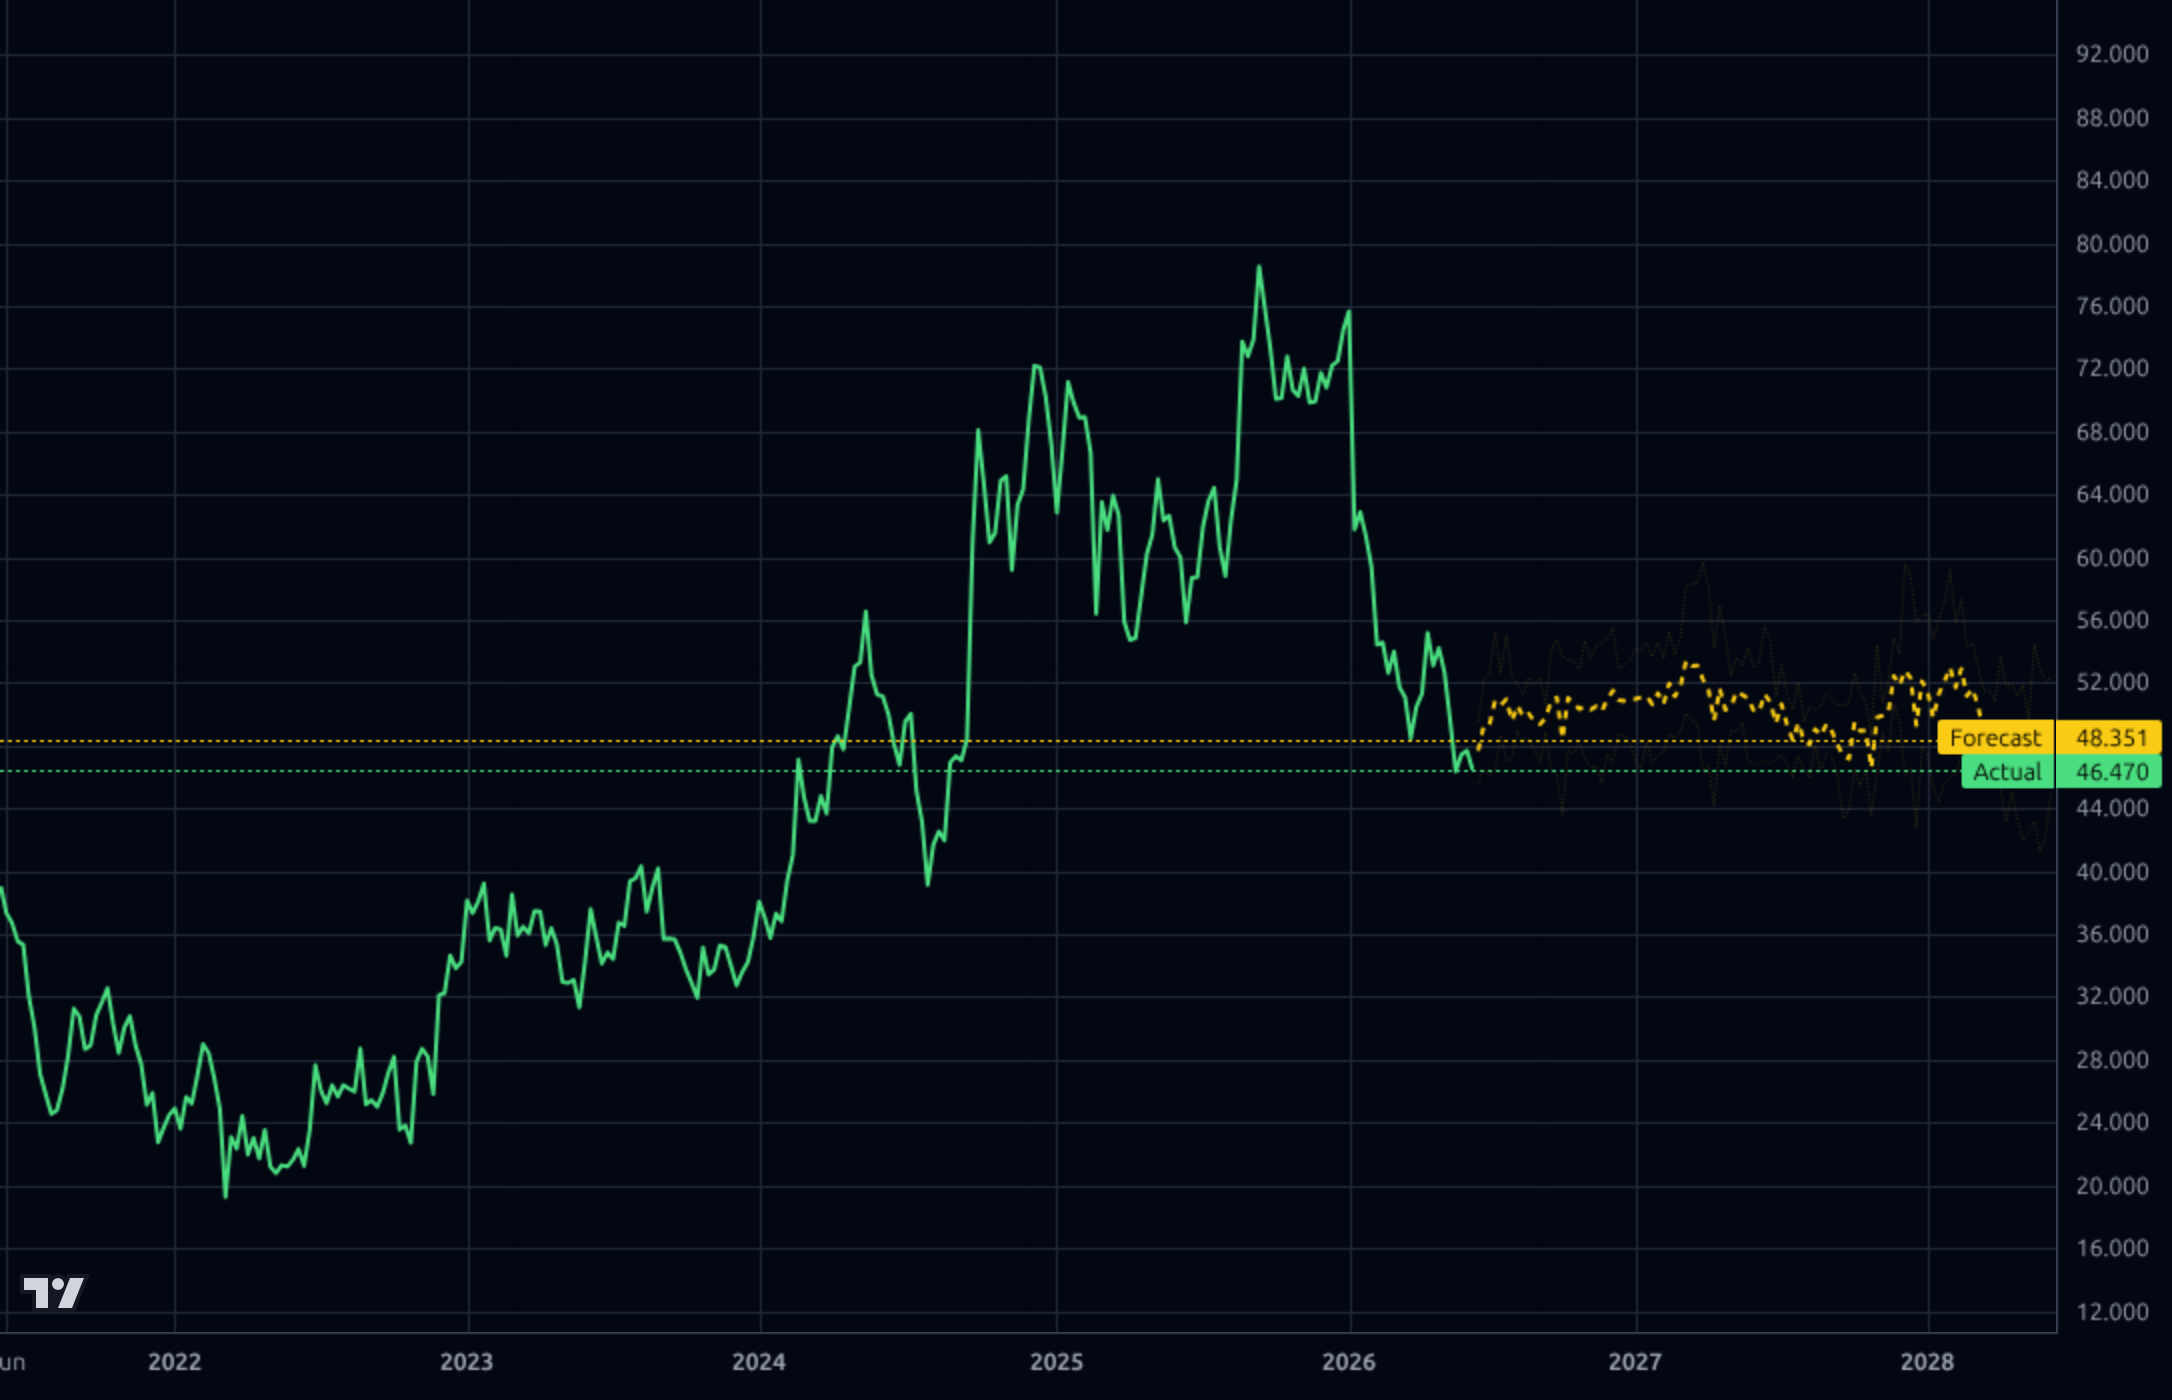
Technicals are clearly weak across timeframes. The 1wk chart shows price collapsed from a ~$79 peak in mid-2025 to $46.47, breaking through ~$55 support; the weekly Kronos forecast band is essentially flat at $48-52, implying basing rather than recovery. The 1d chart shows price wedging down to $46.47 with RSI 35.5 (near oversold), SMA20 -2.9%, SMA50 -8.5%, SMA200 -25.7% — every moving average overhead. The 4h forecast suggests a bounce attempt toward $60 over coming weeks, but the wide forecast band (low ~$45, high ~$70) signals high uncertainty. The 1h chart is more constructive — Kronos predicts mean reversion from $46.45 toward $51.44 (+10.7%) over the short term, consistent with oversold bounce. Key levels: support at $45.92 (52-week low) — a break invalidates the bottoming thesis; resistance at $52 (1h forecast), then $55, then $60 (SMA50 area). The directional accuracy of the model on this name is only 47.6% with high MAE — treat forecasts as directional, not surgical.
News flow is mixed-to-cautious. The most material item is the Q1 2026 earnings release on June 24 — a near-term catalyst that will either confirm sustained travel demand or validate the sell-off. Simply Wall St. and Zacks note the year-to-date 38% decline and 23% one-year drawdown, framing TCOM as either a value setup or a broken stock. ChartMill flags a 'strong growth meets a critical technical setup' framing — a healthy pullback near support. There are no negative company-specific catalysts in the headlines (no guidance cut, no regulatory action, no executive departures), suggesting the decline is sentiment/macro-driven (China consumer concerns, broader ADR de-rating) rather than fundamental. Signal: oversold technicals plus a binary earnings event in ~10 days. Noise: the broader market headlines (SpaceX, crypto, SEC tokenization) are irrelevant context.
- Q1 2026 earnings release June 24 — binary catalyst with Q4 showing 22.5% sales Q/Q growth and CN¥4.28bn net income momentum
- International segment expansion via Trip.com brand and Skyscanner — driver of revenue mix shift visible in 17.3% TTM sales growth
- Outbound Chinese tourism normalization toward pre-COVID levels — structural multi-year tailwind
- Trip.Biz corporate travel management — diversifies away from consumer cyclicality
- CN¥71.9bn cash hoard enables potential buybacks/M&A — current dividend yield only 0.21%, significant capital return optionality
- China consumer/macro weakness — YTD -35% performance suggests market is pricing in deteriorating outlook
- ADR-specific risk: VIE structure, potential delisting, geopolitical tension with US/China
- Analyst EPS next 5Y estimate of -7.2% implies expected margin normalization from post-COVID peak — 53% net margin is not sustainable
- Technical breakdown risk: a close below $45.92 52-week low opens path to high-30s with no clear support
- Kronos model directional accuracy only 47.6% on TCOM with MAE of $13 — forecasts are noisy
- Forward P/E 9.9 vs trailing 6.6 implies earnings step-down already expected by sell-side
Get AI analysis on any stock
This is one of hundreds of Kronos AI reports — scored fundamentals & technicals, bull/base/bear price targets, a multi-horizon plan, and continuously-updated forecasts across the market. Create a free account to explore them all.
Create your free account →Already a member? Sign in · Join our Discord