UWMC— AI Stock Forecast & Price Targets
Published 6/29/2026 · A free sample of K3vl4r’s AI-powered analysis.
Kronos price forecasts, scored fundamentals & technicals, and a multi-horizon plan.
View the live UWMC price forecast →
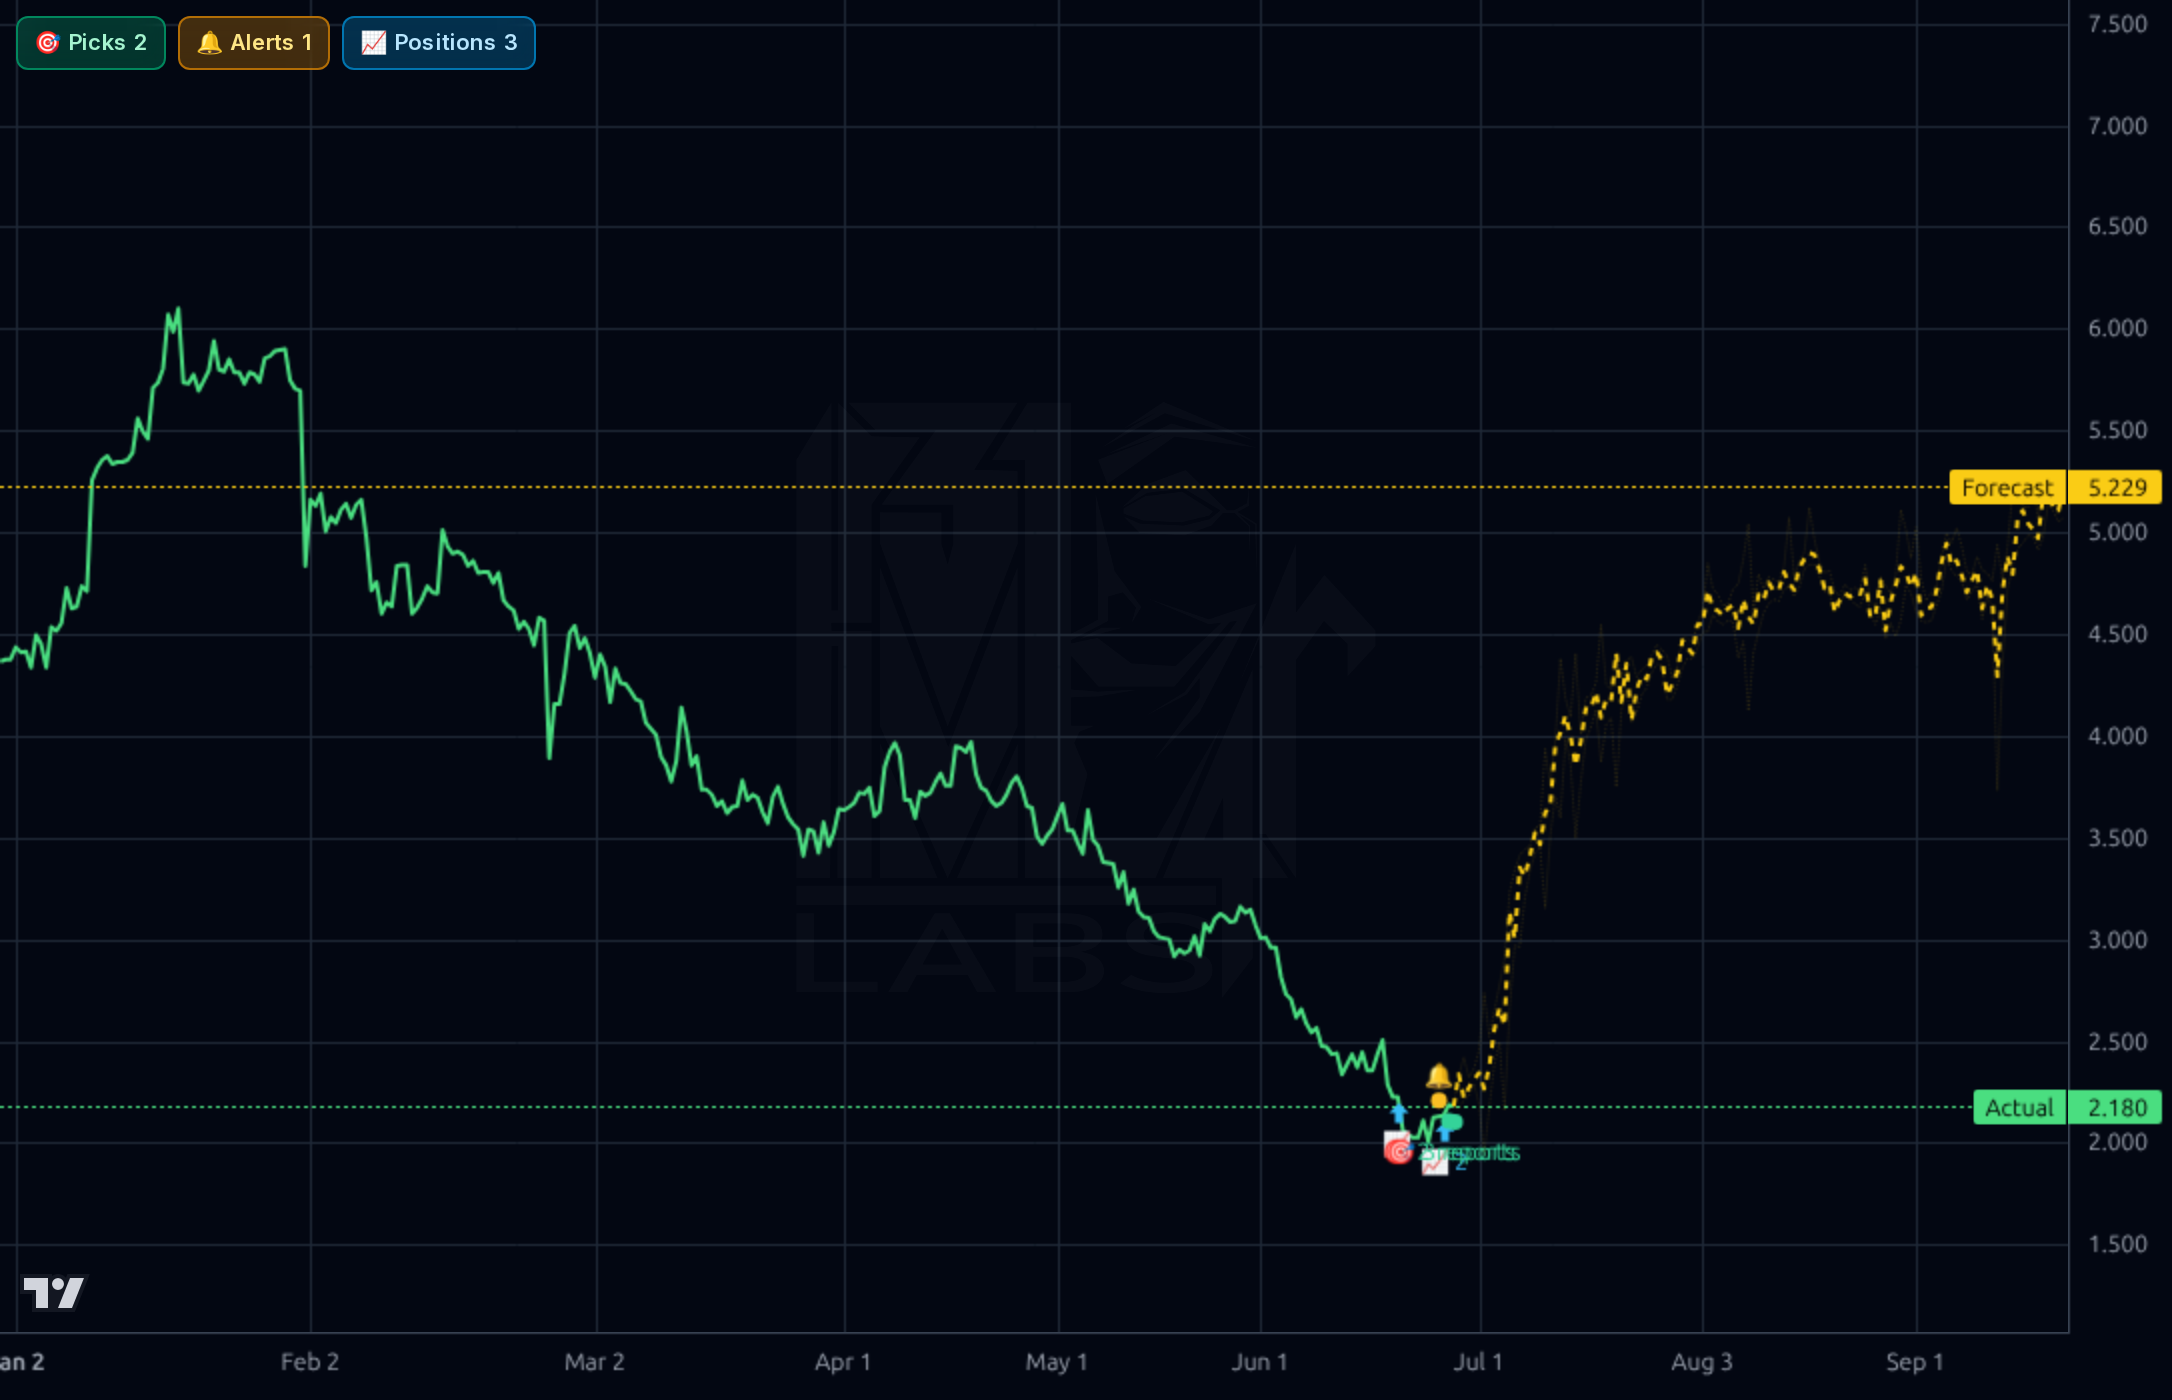
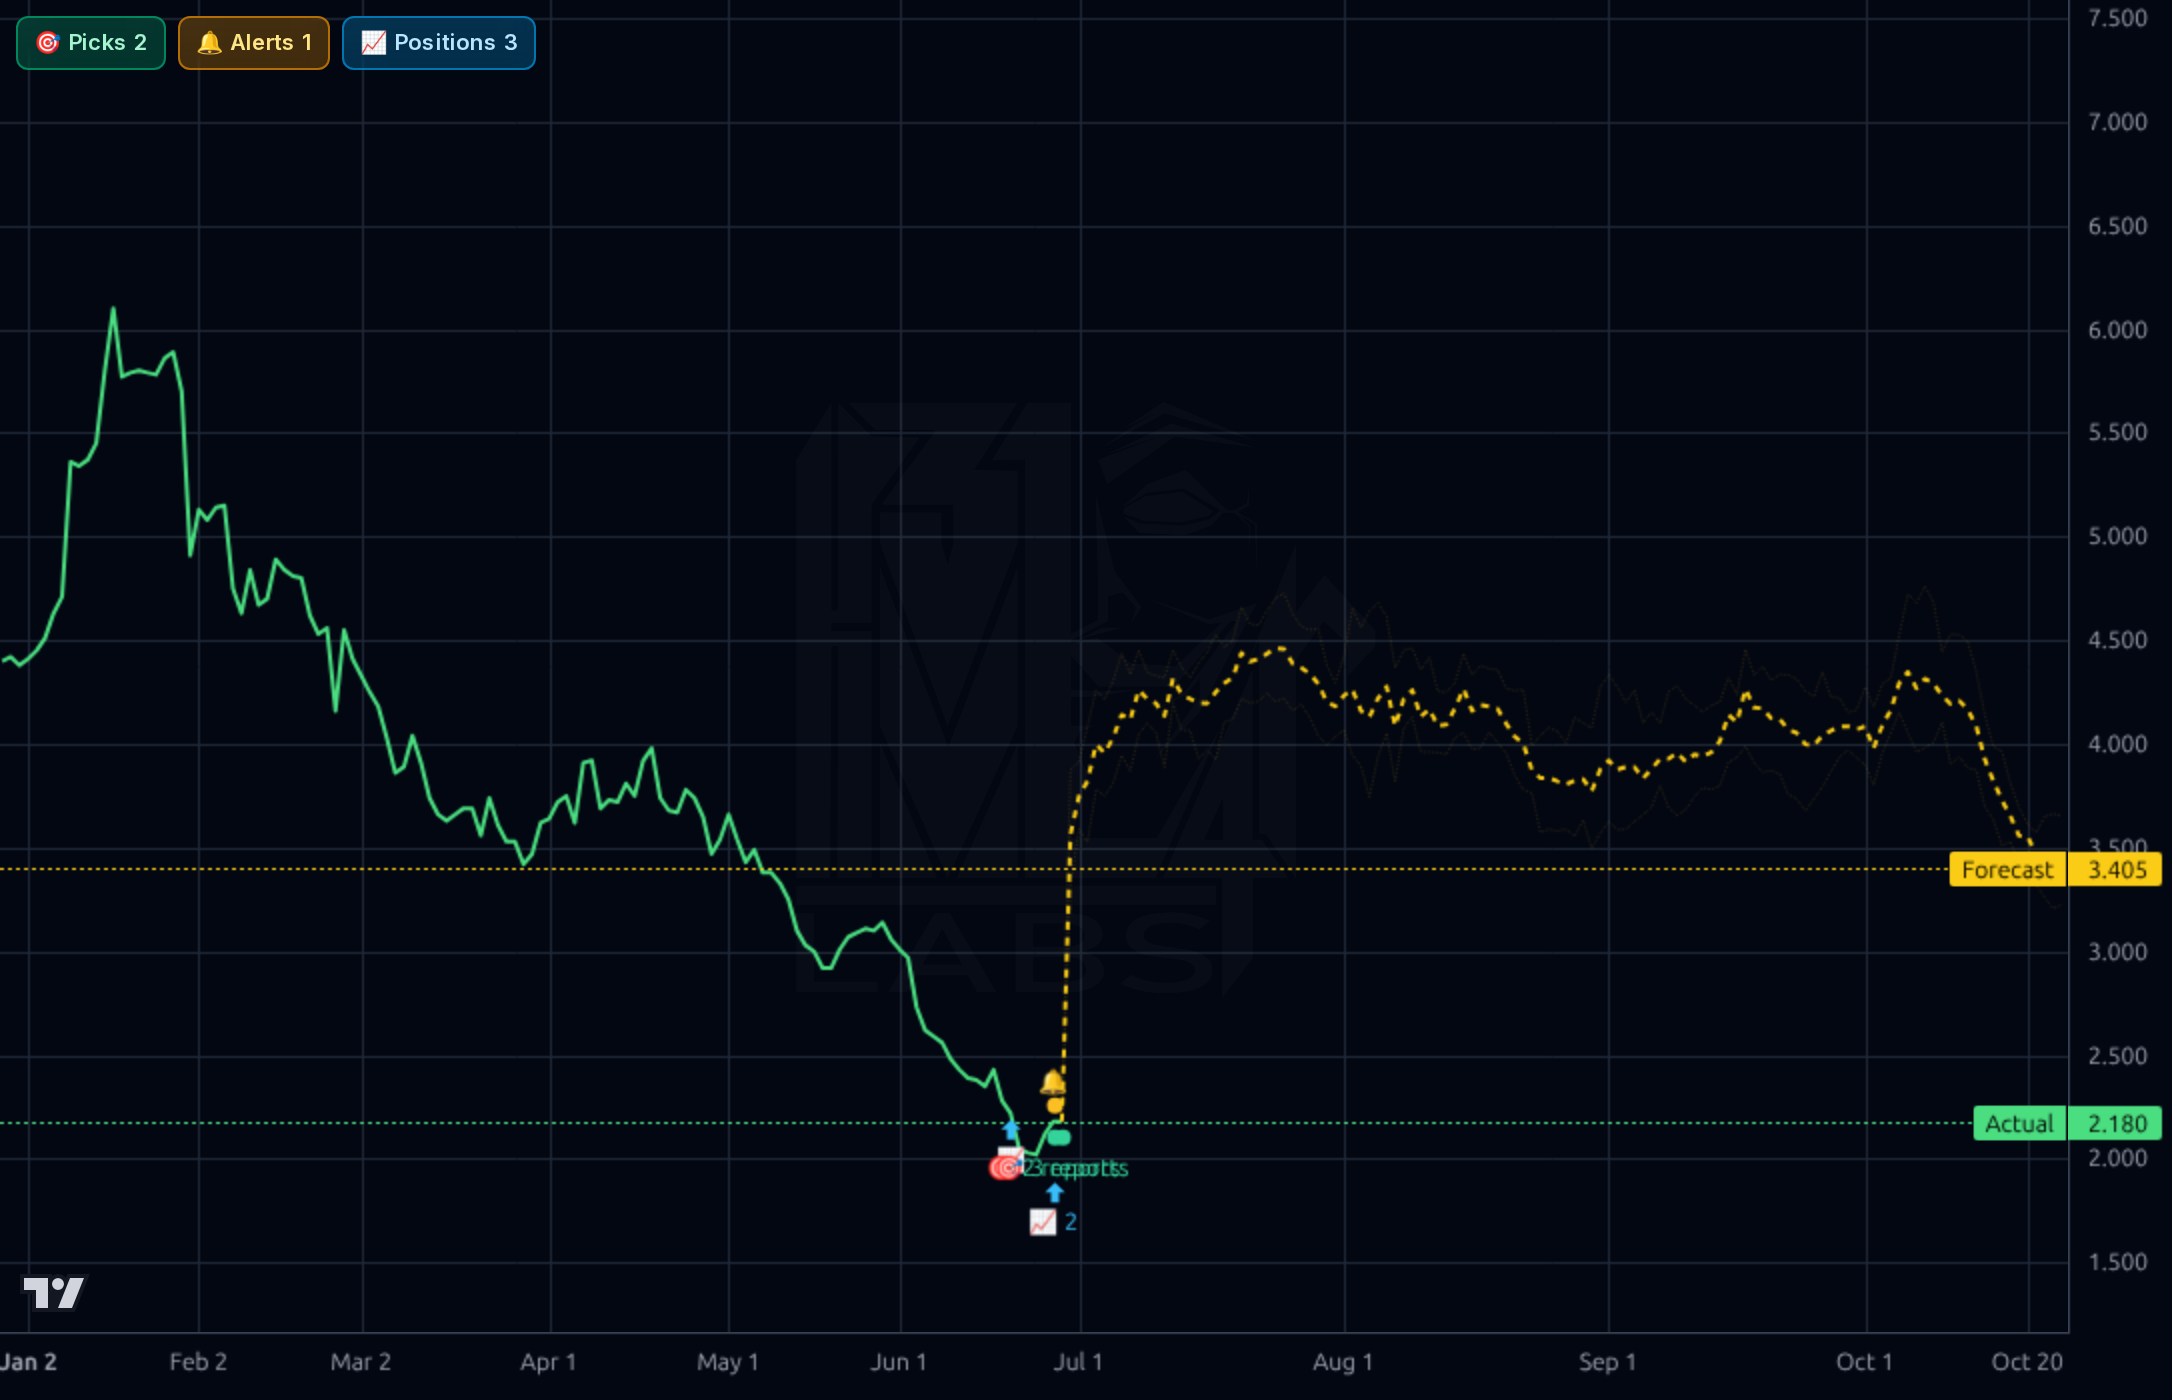
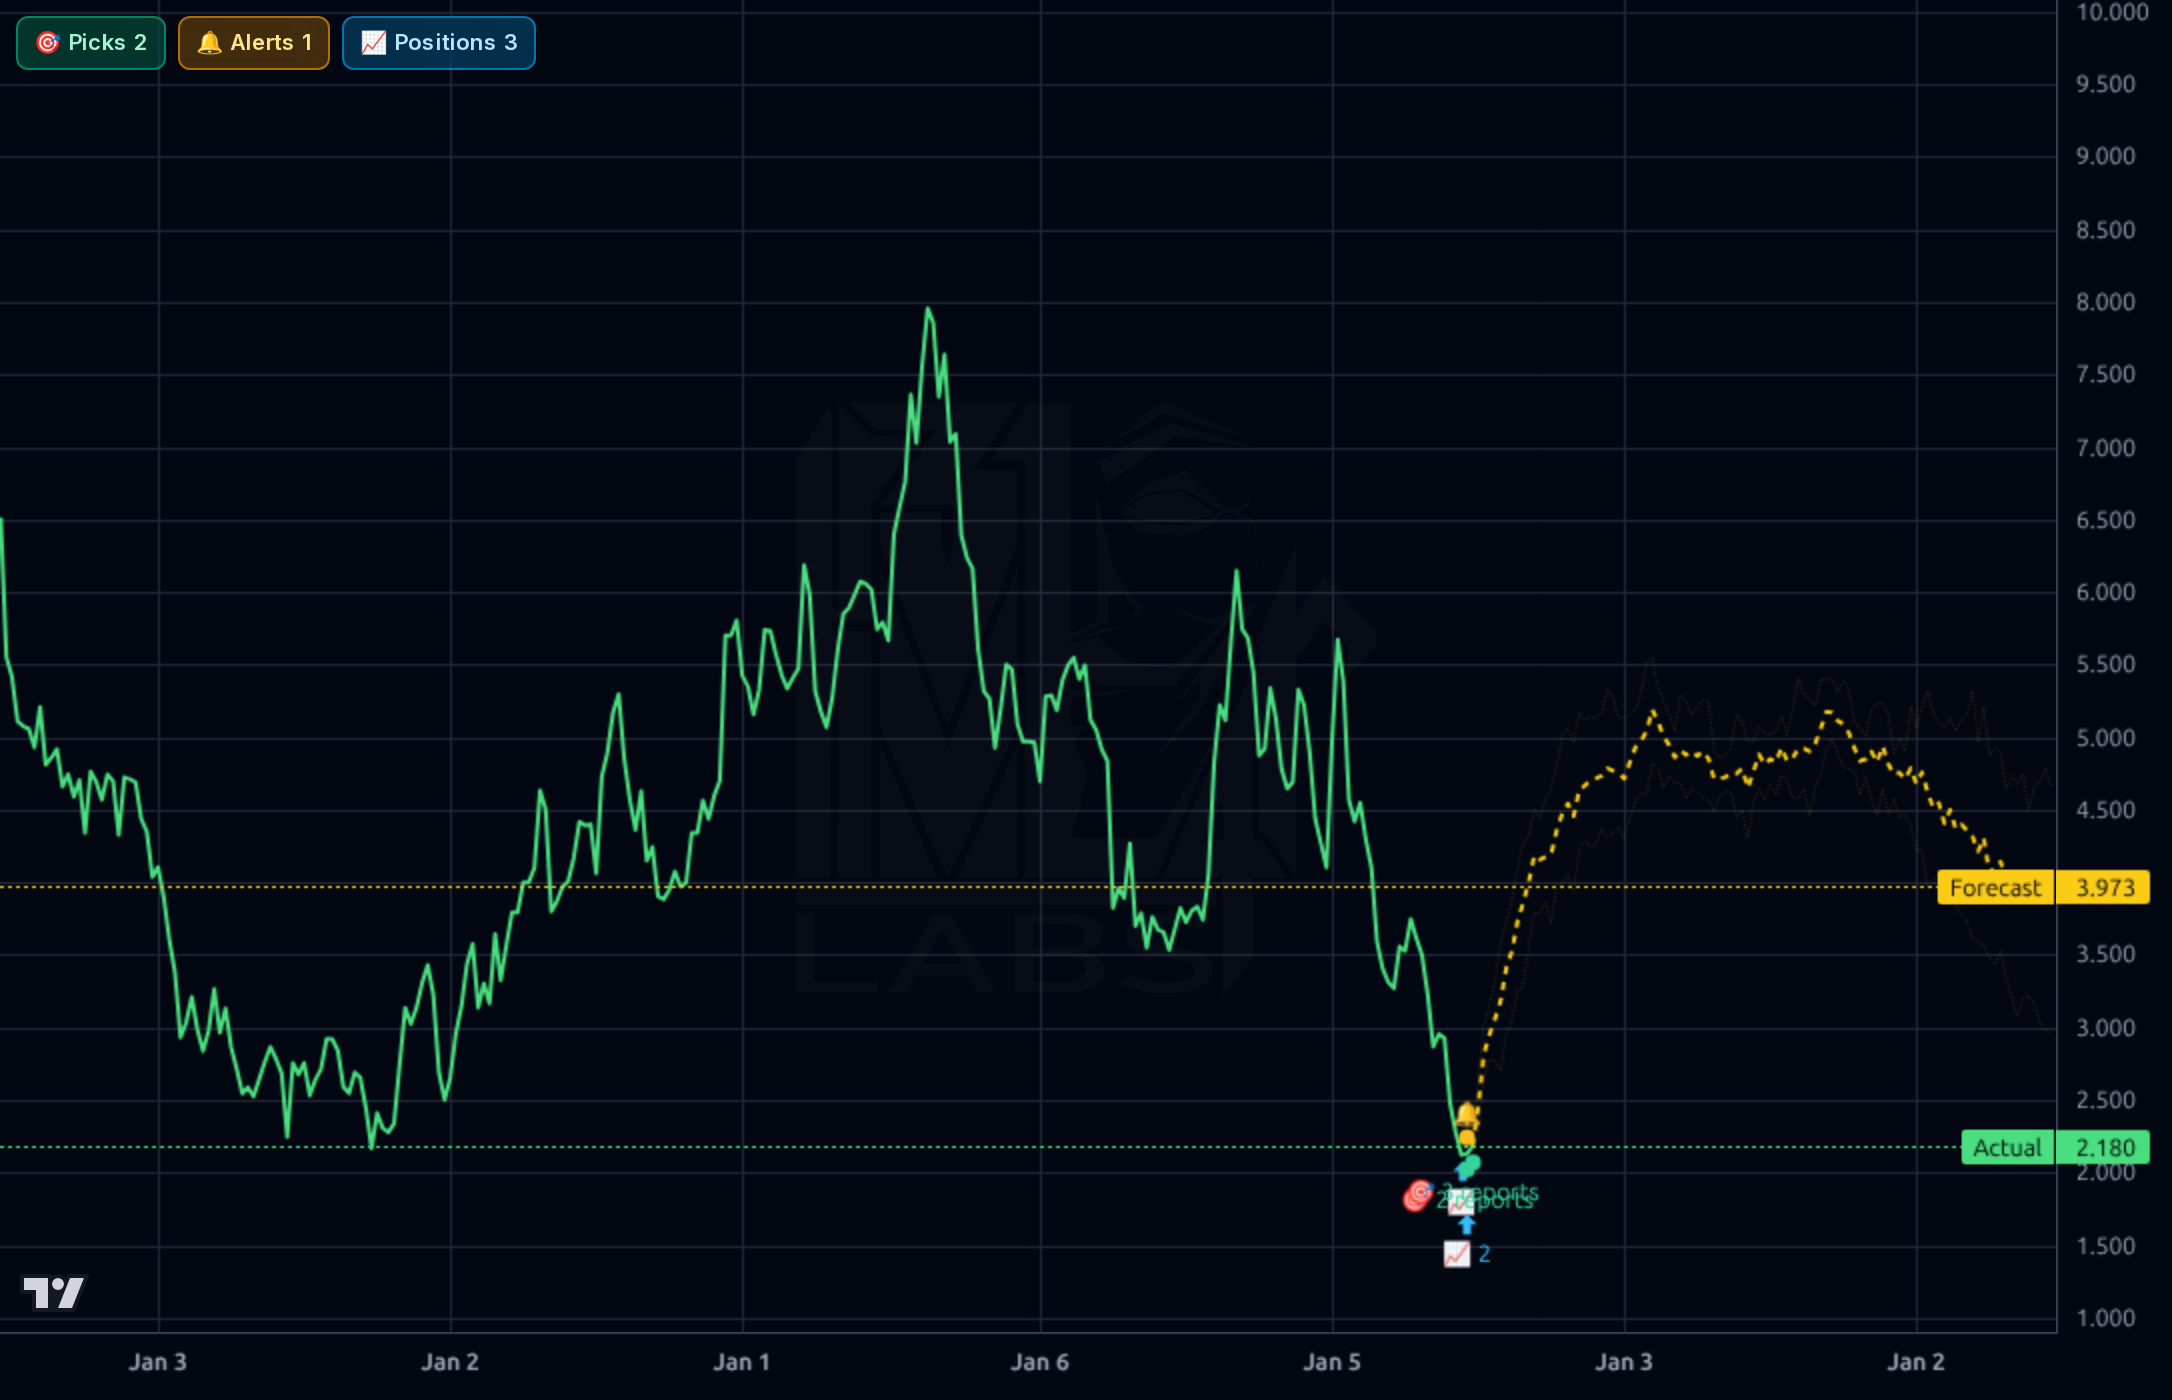
UWMC sits at a cyclical trough ($2.18, near 52w low of $2.00, down 50% YTD) with the Kronos AI forecasting a sharp V-shaped recovery to $3.40-$5.23 across timeframes — but the model's realized 1d/1wk directional accuracy (18%/33%) is materially worse than naive baseline, so that forecast must be heavily discounted. The setup is a deep-value, high-yield (18% dividend, payout ratio 329%), high-short-interest (16.6%) mortgage originator levered to rate cuts, recently upgraded by KBW but with deteriorating cash flow and an unsustainable dividend.
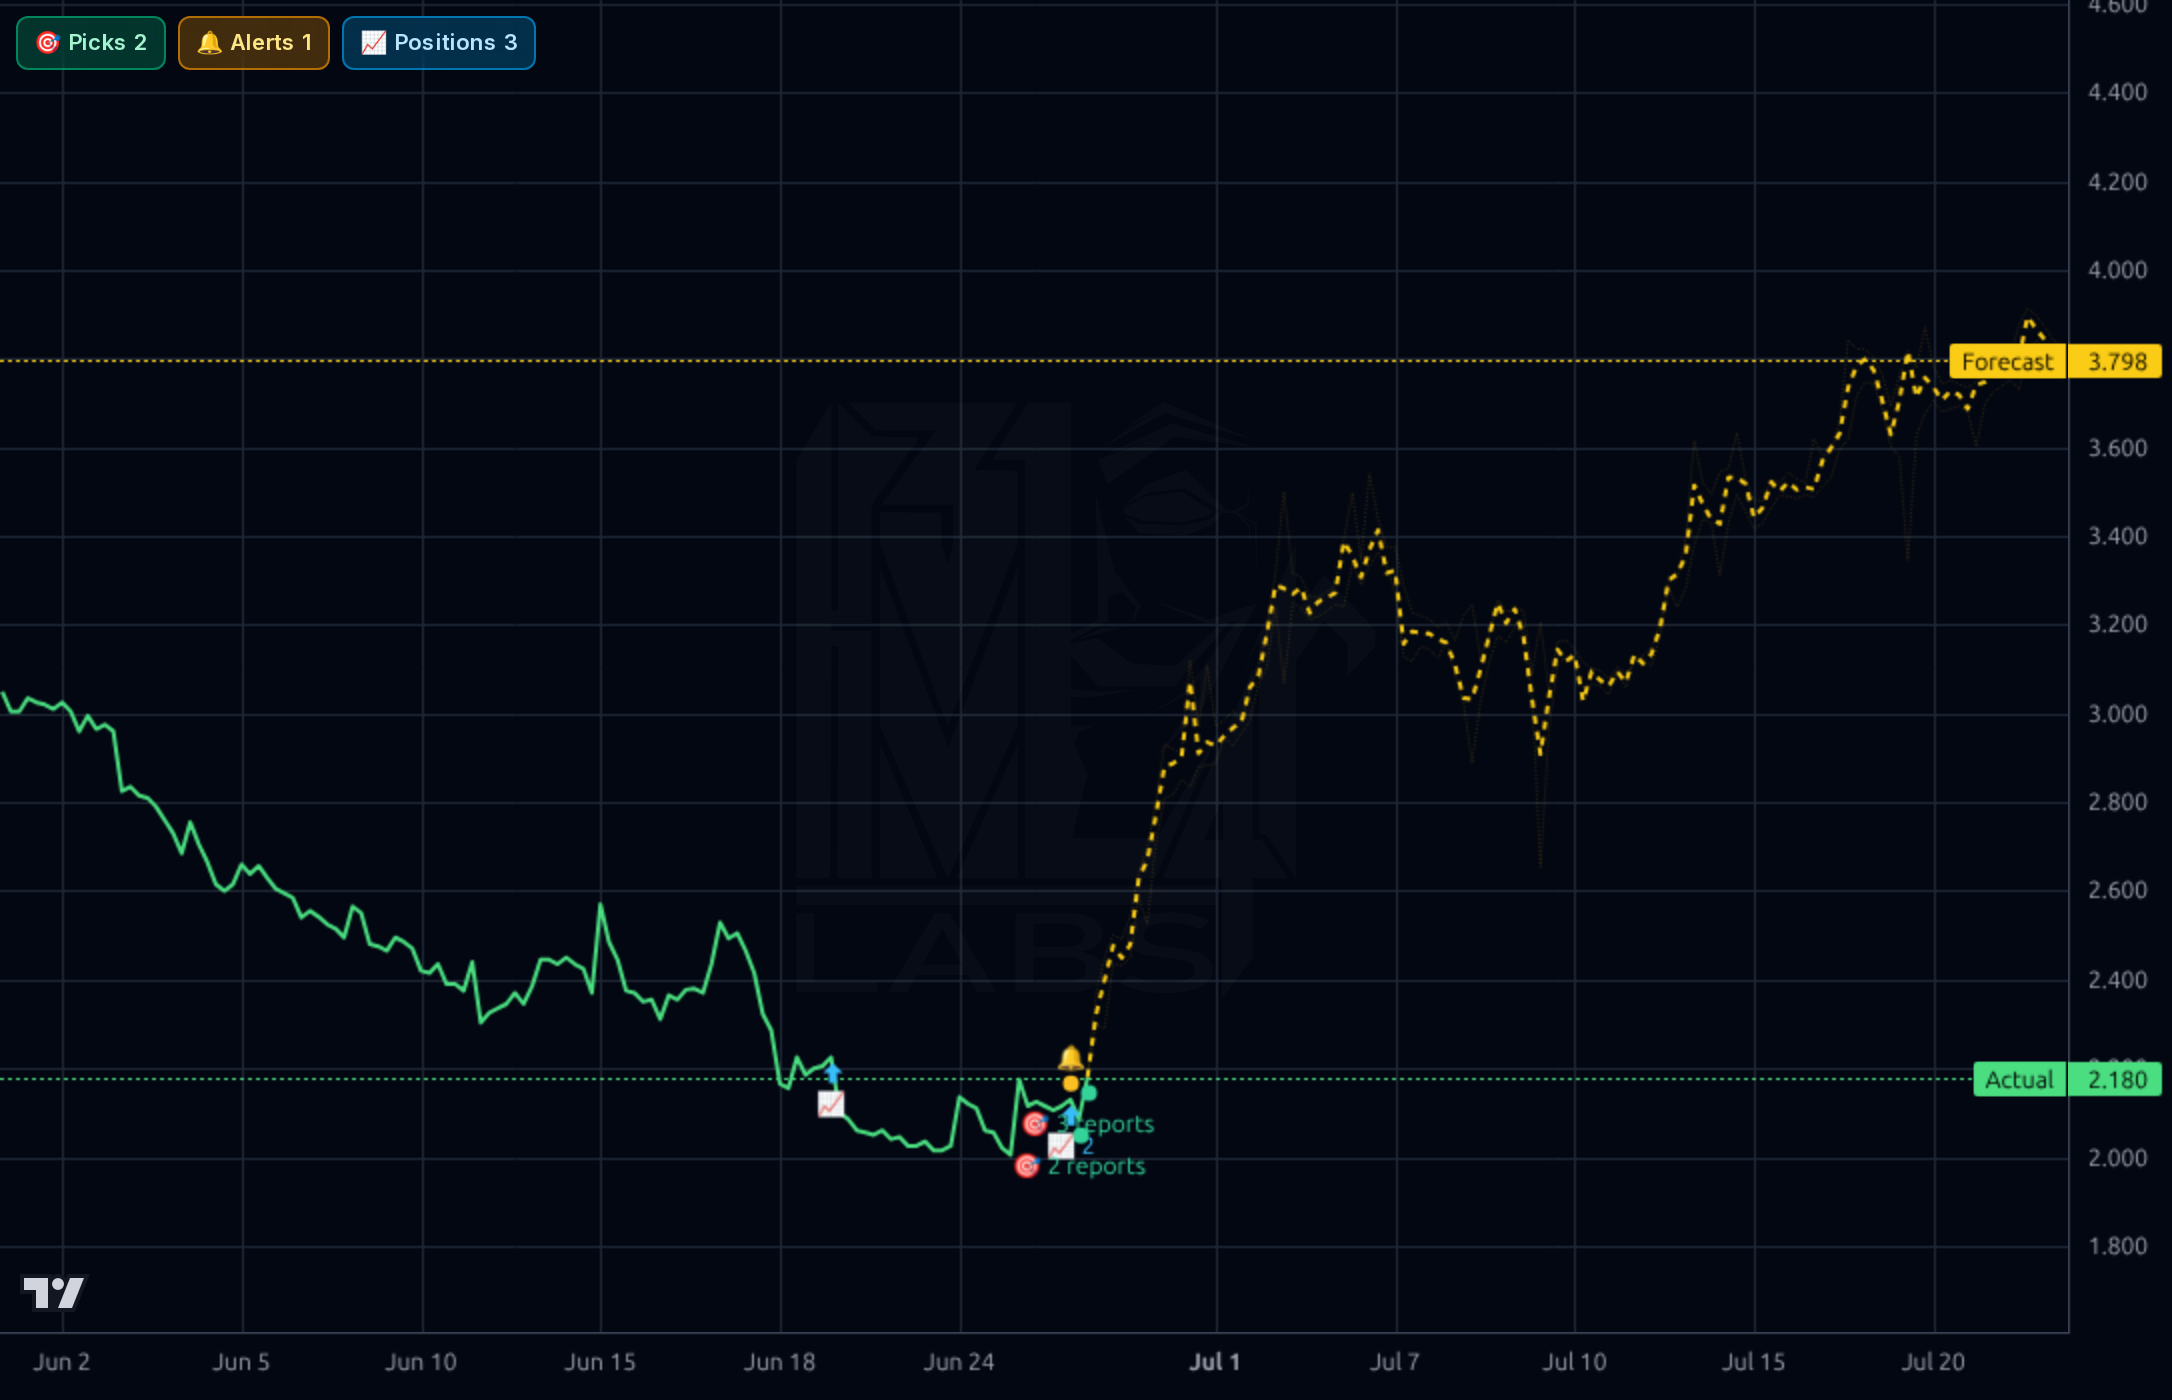
1-4 weeks: tactical long off oversold RSI 29 and capitulation at the $2.00 52w-low double bottom. Entry $2.10-2.20, stop below $1.95 (loss of the low invalidates), first target $2.40 then $2.60. Keep size small (1-2% portfolio) — 16.6% short float and 2.87 short-ratio can fuel a squeeze but the trend is firmly down. Do NOT trust the Kronos $3.40-$5.23 targets given 18%/33% realized accuracy.
1-6 months: this is a rate-cut option. If the Fed cuts and the 30Y mortgage rate breaks lower, refi volumes spike and UWMC re-rates toward analyst targets ($3.75-$4.75). If rates stay sticky, the dividend (329% payout) gets cut and shares can revisit $1.50-1.80. Expected return range -30% to +80%, skewed bimodal. Mind-changers: dividend cut announcement (bearish near-term, bullish long-term), 30Y mortgage rate breaking below 6%, or merger newsflow. HOLD/ACCUMULATE only on weakness with strict risk management.
1-3 years: UWM is the #1 wholesale mortgage originator with structural scale advantages, but it is a deeply cyclical, capital-markets-dependent business with $16.5B of debt against $229M of equity. Terminal value requires a normalized rate environment AND a sustainable capital structure (likely a dividend reset). Multi-year drivers: housing turnover recovery, broker channel share gains vs retail (Rocket), tech platform monetization. Biggest structural risk: if rates remain elevated for years, the equity is a residual on a heavily leveraged balance sheet that may need to be recapitalized — dilution risk is real.
Revenue is cyclical and improving off the bottom: Q1'26 revenue $504.5M with net income $25.3M (5.0% net margin), versus a Q3'25 loss, and TTM sales +37% Y/Y. However, quality is poor: operating cash flow was -$2.23B in Q1'26 and -$3.08B in Q3'25, free cash flow -$2.25B last quarter — these swings are driven by mortgage loan originations on the balance sheet, but they expose enormous warehouse-line dependency. The balance sheet is extremely levered: $16.5B total debt vs only $229M stockholders' equity (D/E 1033 per Yahoo, 70.65 per Finviz on a different basis), and total assets jumped from $13.9B to $19.3B in three quarters as the company built loan inventory. ROE of 33-40% looks great but is a function of paper-thin equity. The 18.35% dividend yield with a 329% payout ratio is the loudest red flag — it is being funded by debt/capital, not earnings, and is a prime candidate for a cut. Forward P/E of ~4.3x and PEG 0.06 look optically cheap but only matter if the rate cycle cooperates.
Across all four timeframes the price action is decisively broken: the 1wk chart shows a multi-year downtrend from ~$8 to a fresh low at $2.18, with the stock sitting -52% below the 200-SMA and -27.7% below the 50-SMA. The 1d chart shows price compressing into the $2.00-2.20 zone with RSI 29.4 (oversold) — this is the only constructive technical, hinting at exhaustion near the 52w low. The 1h chart shows a textbook capitulation-then-bounce off $2.00 with multiple analyst reports clustered at the low, which is often a near-term tradeable bottom. Kronos forecasts a vertical move to $3.40-$5.23 across horizons, but the model's directional accuracy is 18% (1d) and 33% (1wk) — both BEATEN by naive baseline with 63% MAPE on 1d — so the magnitude/timing of that V-shape is not credible. Realistic resistance: $2.40 (June consolidation), $2.85 (50-SMA reclaim), then a yawning gap to $3.50-4.00. Loss of $2.00 opens air down to ~$1.60.
The signal: KBW upgraded UWMC to Outperform on June 25 but cut the price target to $3.75 (from $4.50), and BTIG reiterated Buy on June 24 with a $4 target (previously slashed from $10 on June 16). The bull case is rate-cycle-driven — analysts see UWM as a leveraged play on a mortgage-refi recovery — but the magnitude of the PT cuts (BTIG $10→$4) tells you the 2026 rate environment has been materially worse than expected, which is consistent with the chart and the $2.38 all-time low referenced in Insider Monkey. The fundamental-change signals confirm this: short float rose 13.2%→16.6% over 45 days and consensus PT slipped $5.59→$4.84. There is also unverified retail chatter about a potential 'TWO deal' (Two Harbors / CCM merger speculation) — treat as noise until confirmed. Broader market headlines (crypto, MiCA) are irrelevant.
- Rate-cycle leverage: Q1'26 net income already swung positive to $25.3M with Sales Q/Q +24.4% as origination volumes recovered modestly
- Two analyst upgrades/reiterations in late June (KBW Outperform, BTIG Buy) suggest sell side seeing trough fundamentals
- EPS Y/Y TTM +572% and EPS next-Y growth est +31.6% reflects the operating leverage if volumes normalize
- Potential M&A optionality referenced in retail chatter around a 'TWO deal' — unverified but a watch item
- Wholesale channel share gains: 9,100 employees and #1 wholesale position give scale advantage as smaller originators exit
- Dividend at $0.40 TTM with 329% payout ratio is not covered by earnings or cash flow — cut is a question of when, not if
- Operating cash flow -$2.23B in Q1'26 and -$3.08B in Q3'25; business consumes cash when originating, dependent on warehouse credit
- Total debt $16.5B vs stockholders' equity $229M — extreme leverage; small NAV moves can wipe equity
- Short float 16.6% (rising from 13.2%) reflects bearish institutional view; 'crowded short' cuts both ways
- Kronos forecast directional accuracy 18% (1d) and 33% (1wk) — both worse than naive baseline; do not trade off model price targets
- Stock down 50% YTD, -52% vs 200-SMA — trend is decisively broken; bottom-fishing in mortgage originators historically punishing
- Analyst PT cuts (BTIG $10→$4, KBW $4.50→$3.75) signal deteriorating fundamental outlook even among bulls
- 100% bullish retail sentiment on Stocktwits is a mild contrarian warning at a 52w low
Get AI analysis on any stock
This is one of hundreds of Kronos AI reports — scored fundamentals & technicals, bull/base/bear price targets, a multi-horizon plan, and continuously-updated forecasts across the market. Create a free account to explore them all.
Create your free account →Already a member? Sign in · Join our Discord