UWMC— AI Stock Forecast & Price Targets
Published 7/6/2026 · A free sample of K3vl4r’s AI-powered analysis.
Kronos price forecasts, scored fundamentals & technicals, and a multi-horizon plan.
View the live UWMC price forecast →
UWMC sits at $2.22 near multi-year lows with extreme leverage ($16.5B debt / $229M equity), an unsustainable 329% dividend payout ratio, and Q1'26 operating cash flow of -$2.2B — a cyclical trough setup with binary earnings risk on Aug 6. The AI forecast projects sharp mean-reversion to $3.80-$4.20, but its realized directional accuracy (42% at 1d, 0% at 1wk) is worse than naive baseline, and past bullish targets on this name have systematically failed to print. Recommend HOLD with tight risk framing — the $2.00 floor is the entire trade, and no fundamental catalyst justifies chasing before earnings.
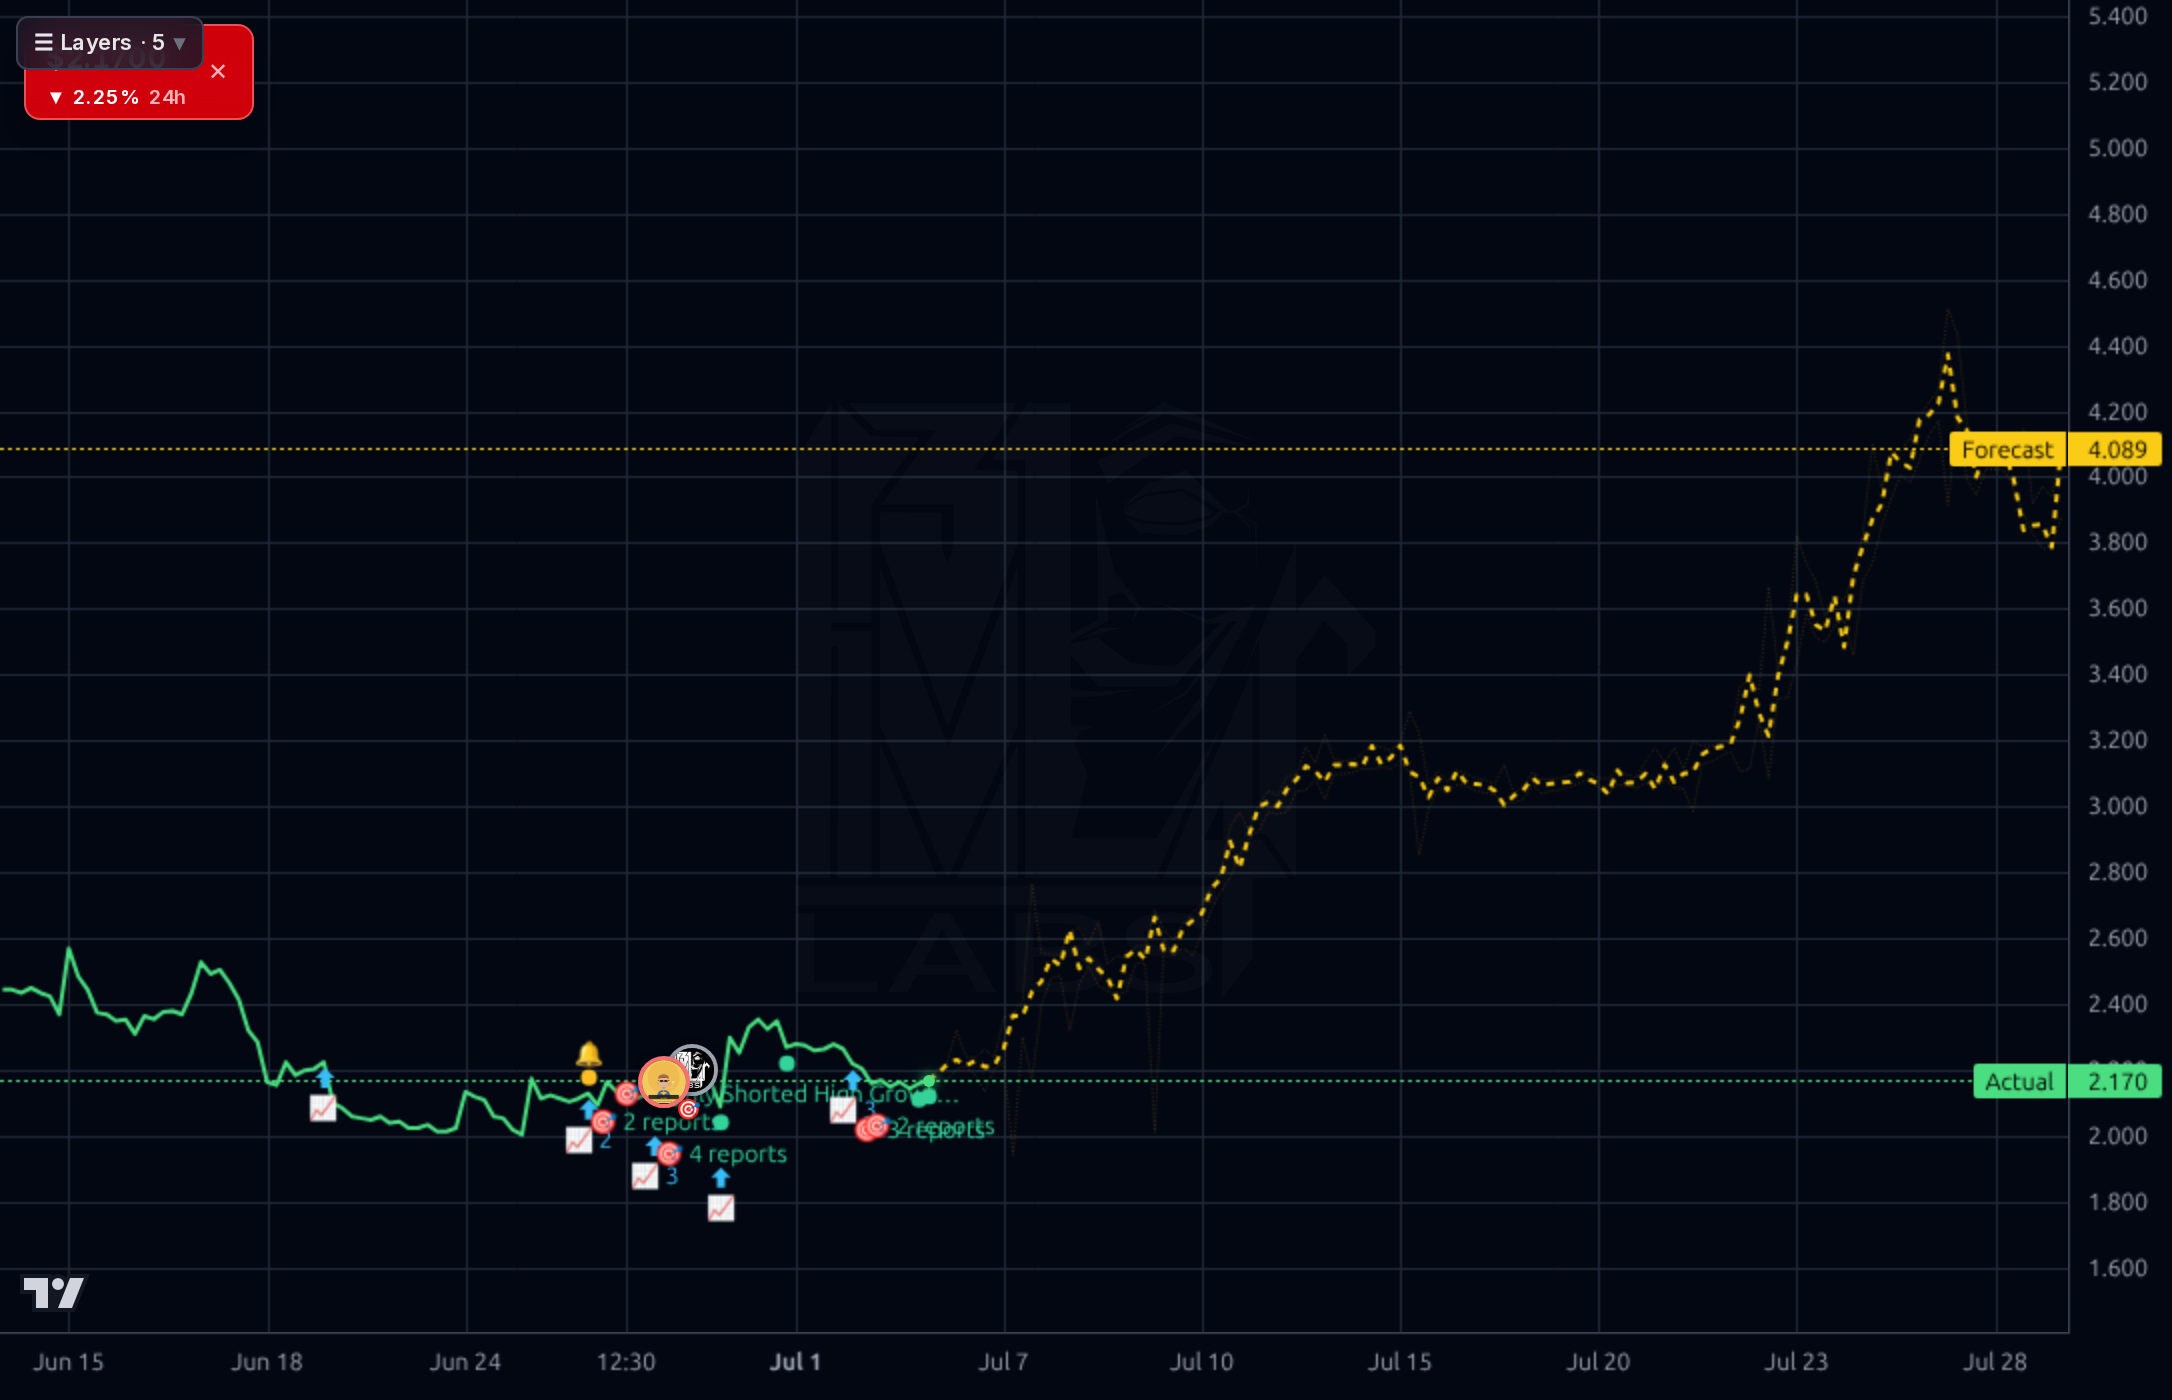
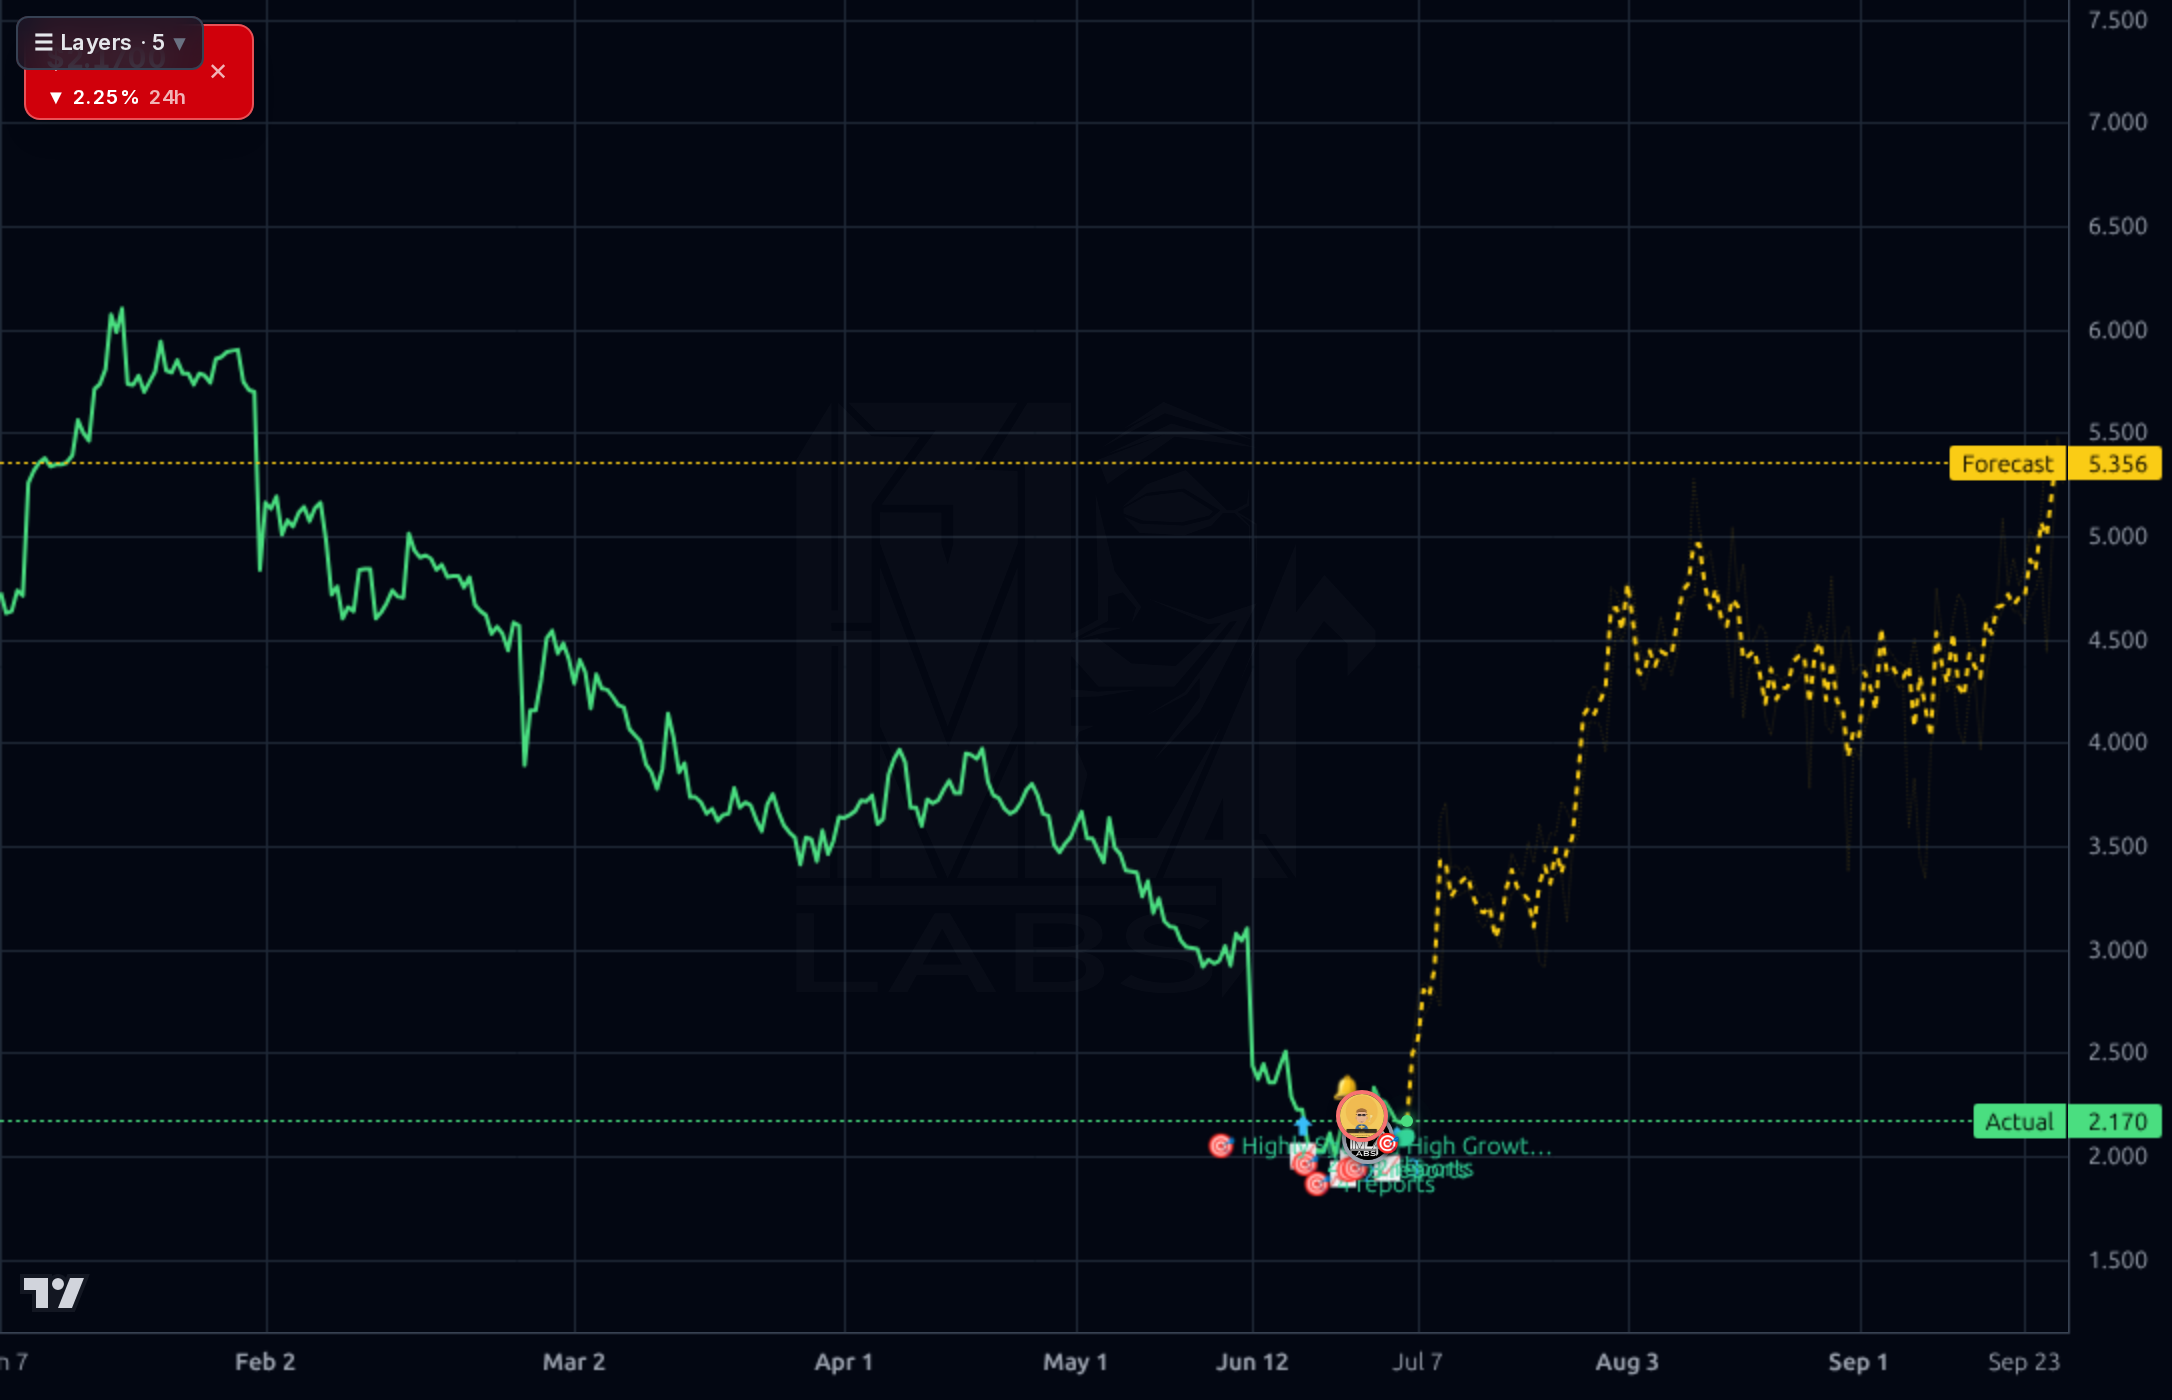
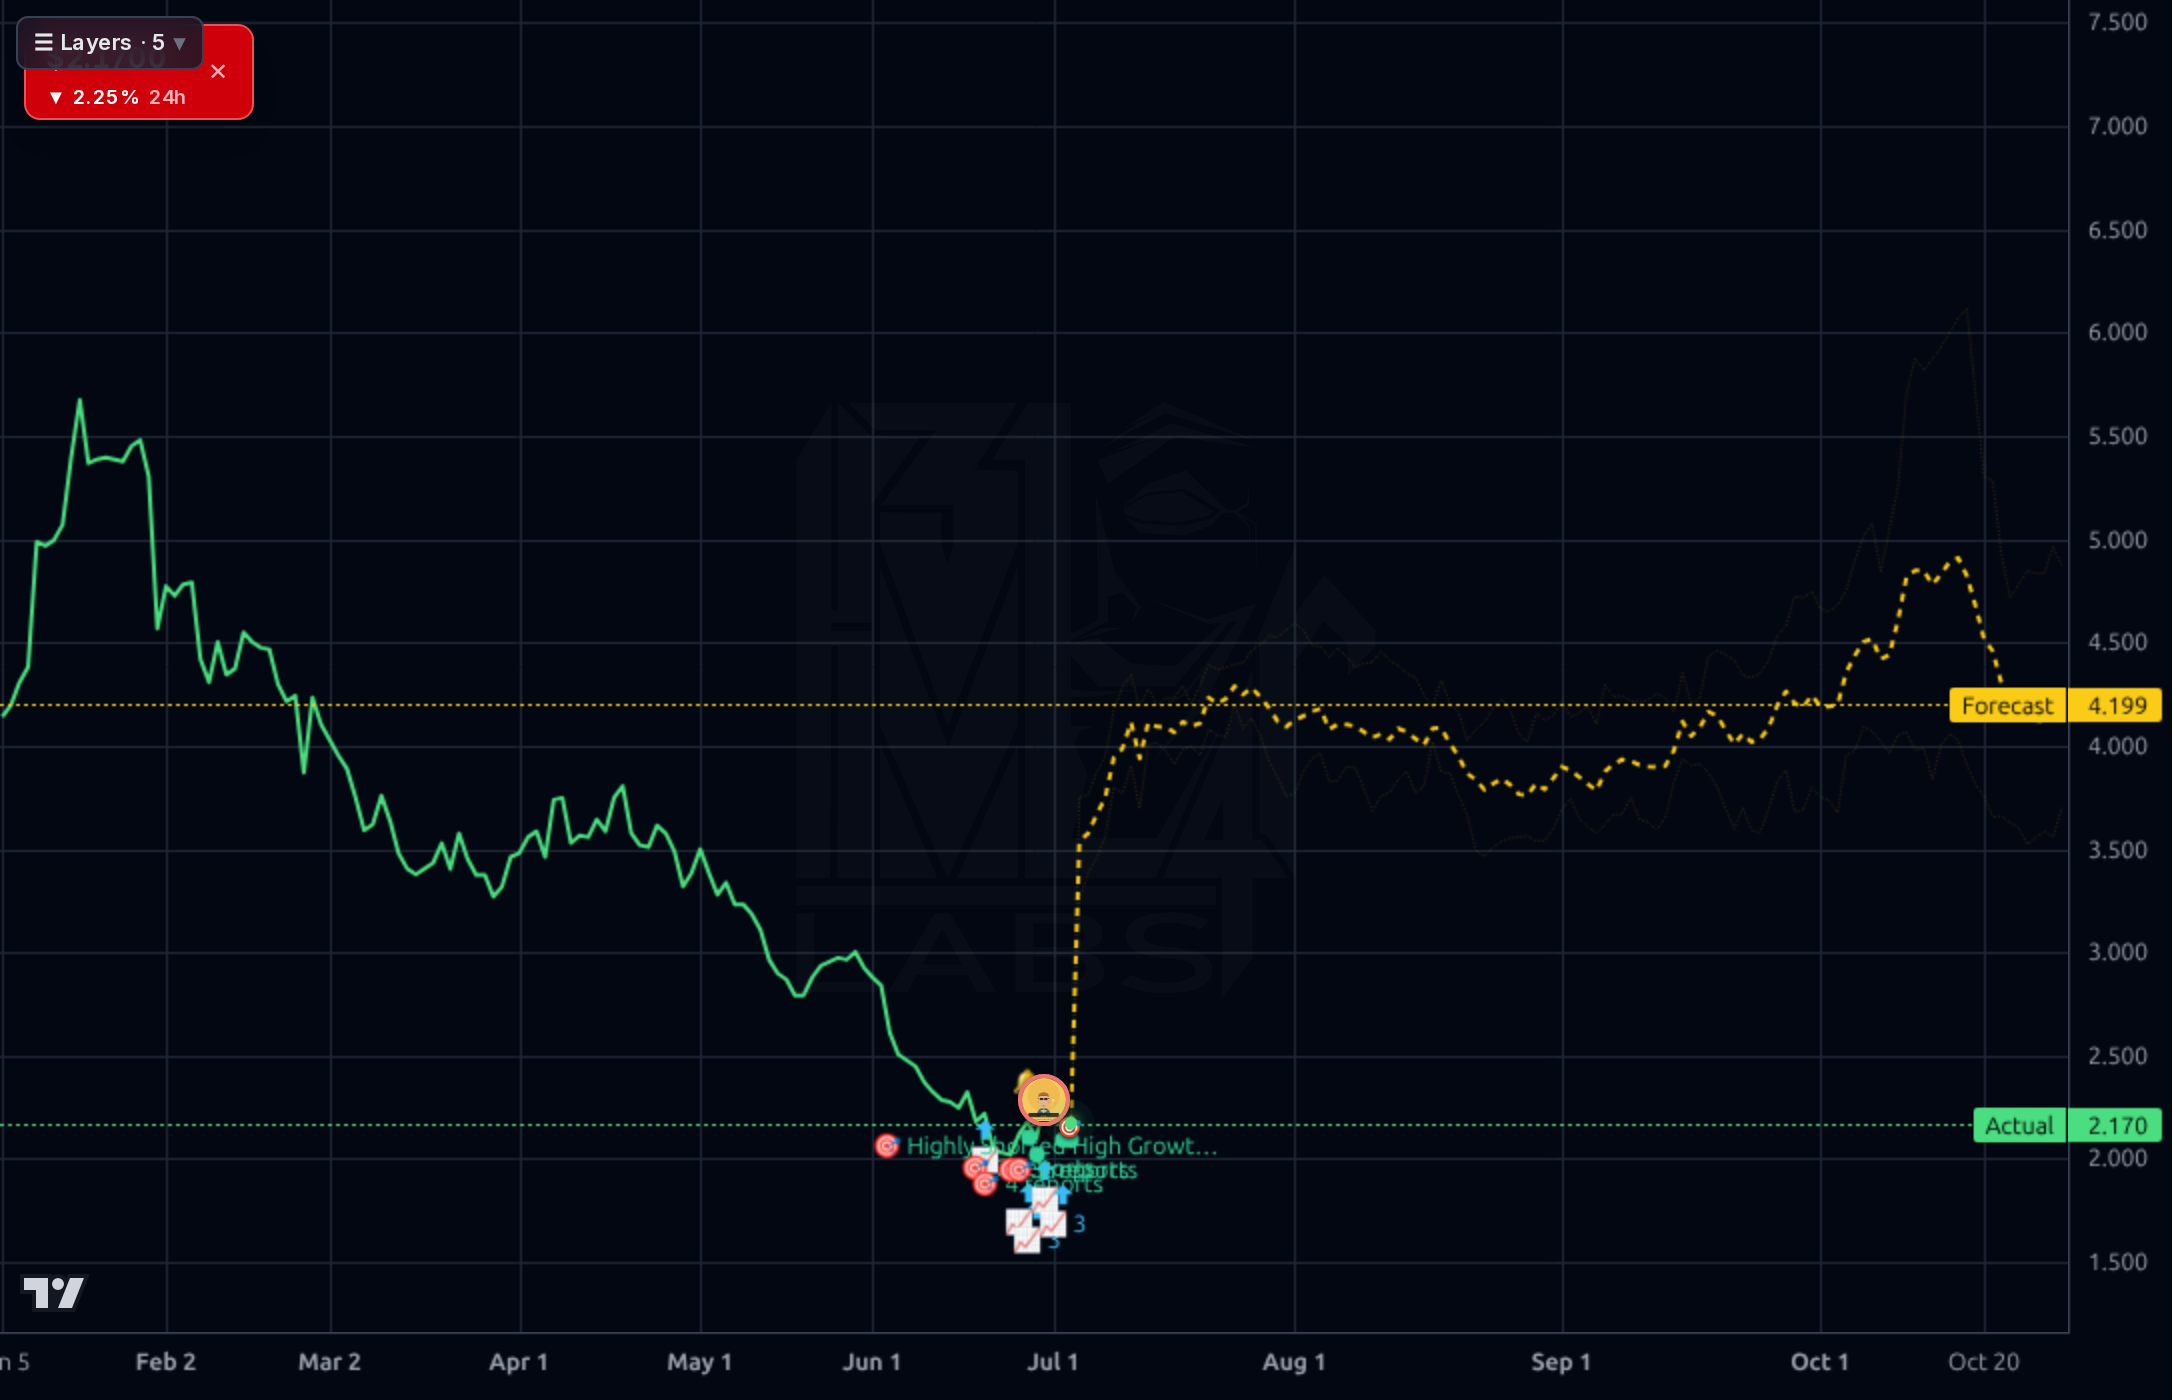
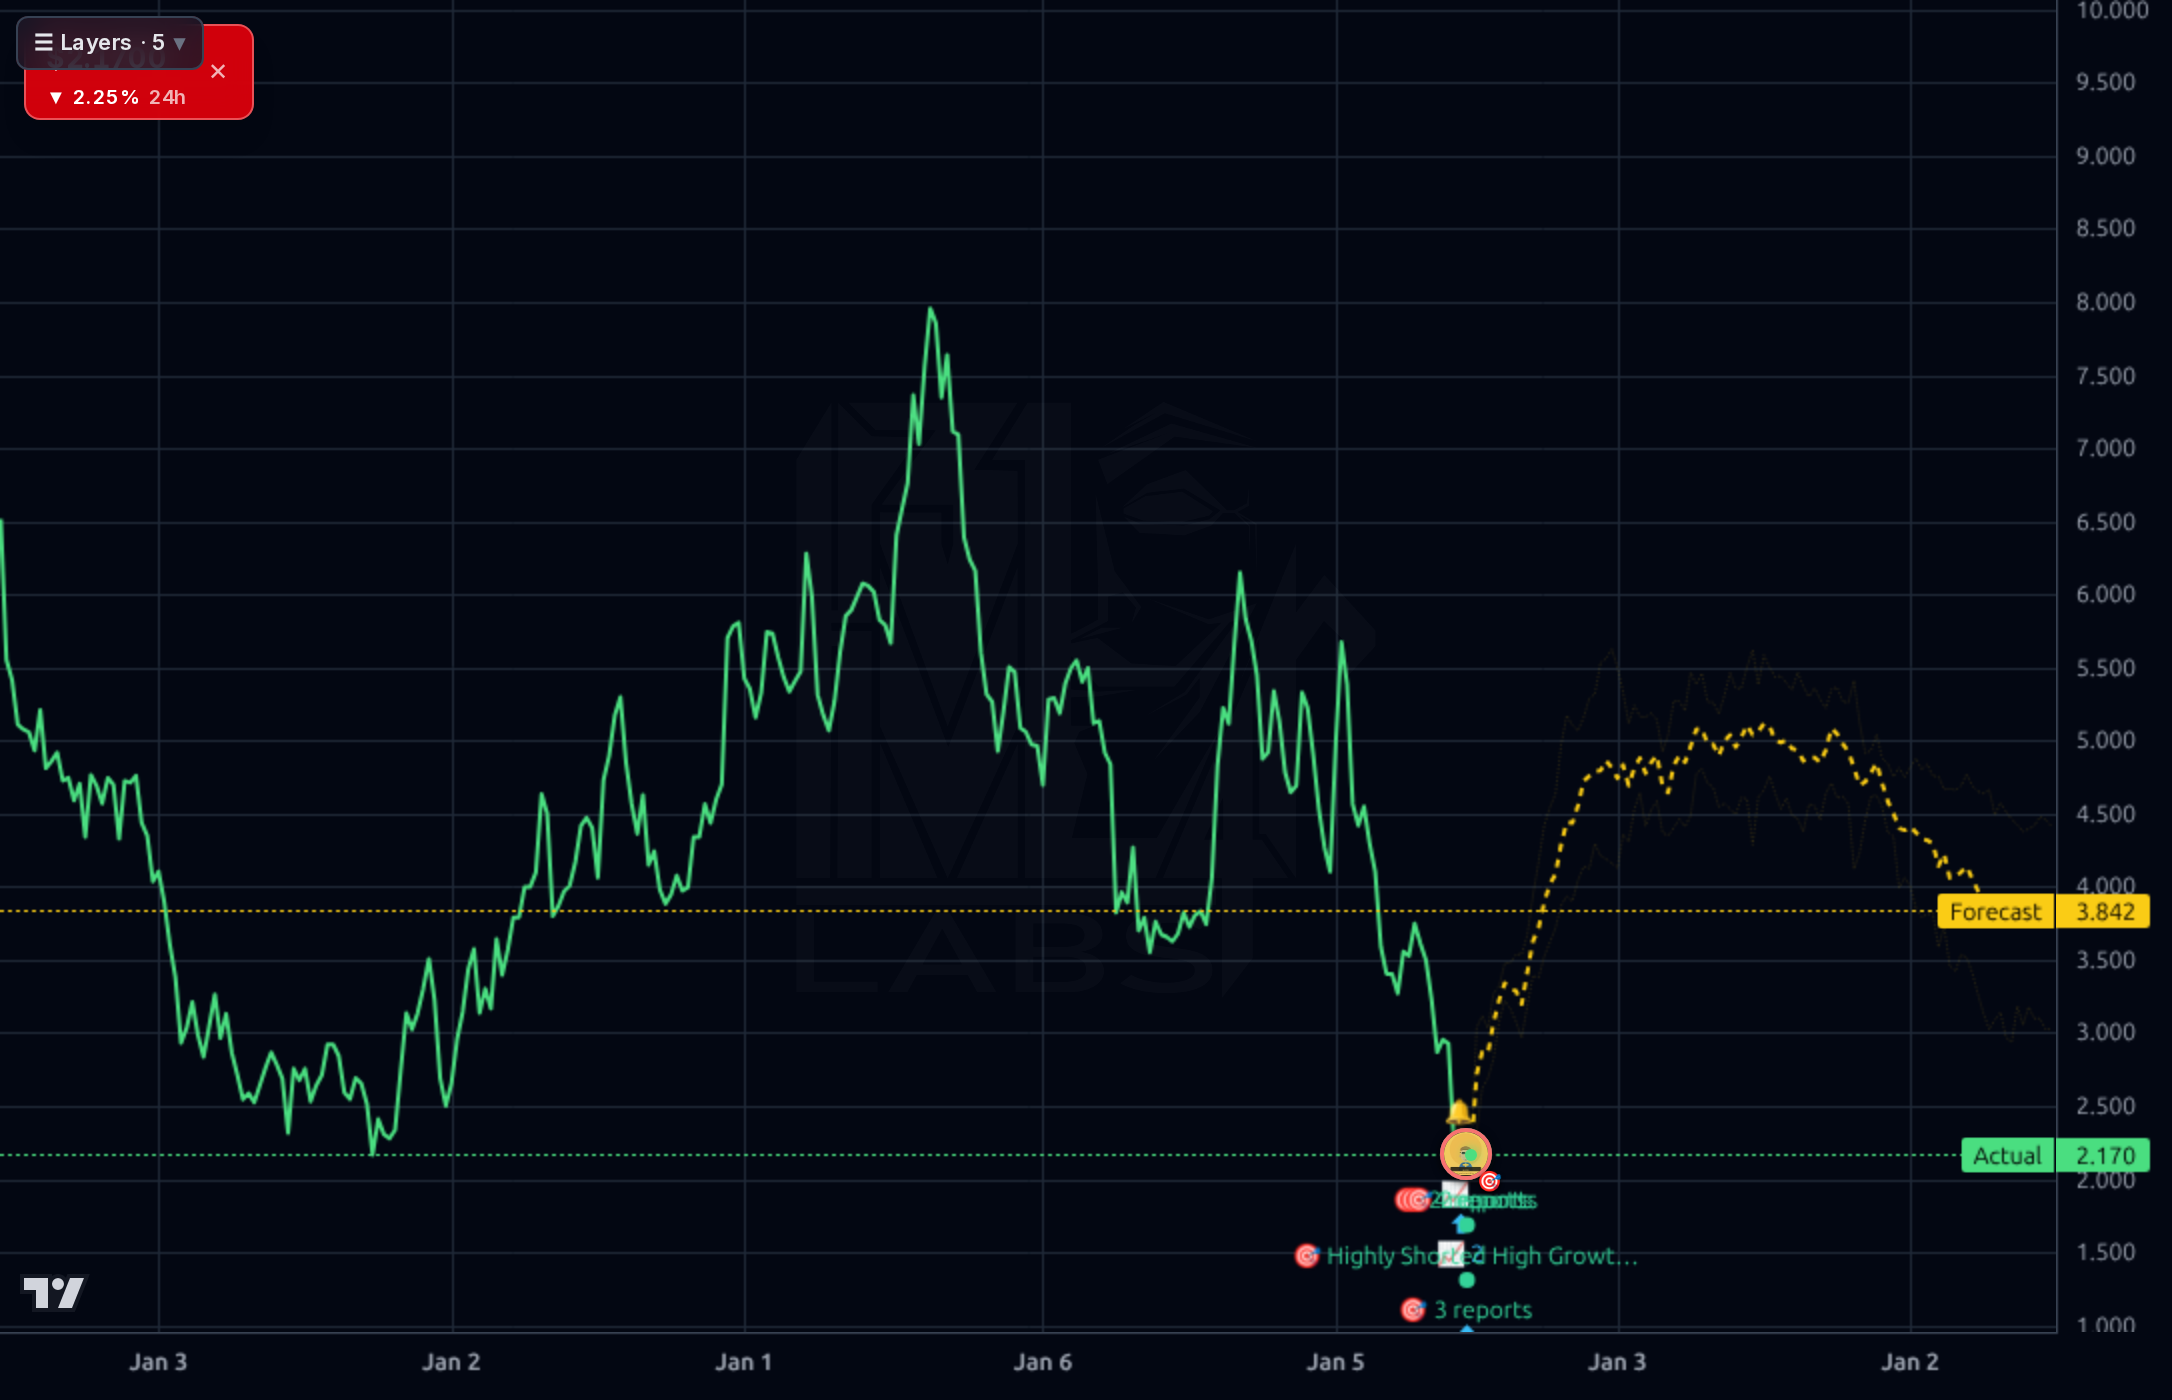
1-4 weeks: Do not chase the AI-forecast bounce. Earnings on Aug 6 is a binary event ~31 days out; sizing into it is speculation. If already long, hold with a hard stop below $1.95 (loss of 52-week low invalidates the base). If flat, wait for either (a) confirmed breakout and hold above $2.40 on volume as a pre-earnings momentum entry, or (b) the print itself. Realistic pre-earnings range: $2.00-$2.45. Do not size more than a starter position — IV crush and gap risk are material.
1-6 months: HOLD bias. The setup is a deep-value, high-yield trough trade dependent entirely on (1) rate-cycle cooperation into H2'26, (2) dividend defense on the Aug print, and (3) Q2 origination volume proving Q1's recovery was not a one-quarter head fake. Base case $2.60 (~17% upside) assumes stabilization but no re-rating; bull case $3.60 (~62%) requires an actual rate-cut signal plus dividend reaffirmation; bear case $1.60 (~28% downside) triggers on a dividend cut, EPS miss, or forward guidance for continued negative OCF. Change my mind: a clean Q2 print with positive OCF and explicit dividend guidance.
1-3 years: The terminal thesis is whether UWMC survives its capital structure intact to participate in the next mortgage refi cycle. As the #1 wholesale originator with 9,100 employees and scale advantages, in a normalized rate environment (30Y mortgage < 6%) EPS power of $1.00+ and a $6-8 stock is achievable. But the balance sheet is the biggest structural risk — $16.5B of debt in a business that consumes cash in downturns means one bad funding shock or credit event can wipe equity holders. This is a leveraged option on the rate cycle, not a compounder.
The fundamentals show a company operating on razor-thin cushion. Q1'26 revenue of $504M was down modestly from Q4'25 ($522M) but well above the Q3'25 trough ($339M), suggesting stabilization rather than growth. Net income was $25.3M in Q1'26 for a 5% net margin — visible earnings recovery, but TTM profit margin remains just 1.97%. The balance sheet is the binding constraint: $16.5B total debt against $229M stockholders' equity yields a debt/equity ratio above 1000x, and total assets grew $2.3B QoQ while equity barely moved — the ramp is debt-funded. Operating cash flow was -$2.23B in Q1'26 and -$5.47B TTM, while free cash flow ran -$2.25B in the quarter. Against that, the company pays an 18.4% dividend yielding a 329% payout ratio — mathematically unsupported by earnings and being funded from the balance sheet or debt. ROE of 34-41% looks strong on paper but is a leverage artifact; ROA is 0.40%. Forward P/E of 4.2x and PEG of 0.06 look cheap only if you believe EPS estimates ($0.52 forward) can be hit in a stubbornly high-rate environment — Q1'26 annualized EPS is roughly $0.30.
Across all four timeframes the picture is a stock that has broken down structurally. The weekly chart shows a decline from ~$8 mid-2025 to $2.17, a ~73% drawdown, with the current level sitting just above the $2.00 52-week low (RSI 35, SMA200 -51%, SMA50 -25%). The daily chart shows the recent capitulation leg from ~$3.00 in early June to a $2.00 low, followed by a sideways stabilization near $2.10-$2.22 — a potential base but with no confirmed higher-high structure. The 1h chart shows the stock chopping in a tight $2.00-$2.20 range with a slight downward bias into July. The AI forecast band projects sharp V-recoveries to $3.84 (1d), $4.09 (1h), $4.20 (4h), and $5.36 (weekly) — but the model's own realized 1d directional accuracy is 42% vs 58% naive baseline, and 1wk accuracy is 0% vs 100% naive, meaning the forecast is actively unreliable in this regime and must be heavily discounted. Key levels: $2.00 is the hard floor (break = capitulation to $1.50-$1.60 zone); $2.75-$3.00 is the first meaningful resistance where prior support flipped; sustained close above $3.00 would be the first structural signal that the downtrend has changed character.
The recent news flow is a tug-of-war. Constructive: KBW upgraded to Outperform on 6/25, BTIG reiterated Buy on 6/24, and both firms still see 70-130% upside from spot — but both cut price targets materially (BTIG from $10 to $4, KBW to $3.75). The upgrades are relative-value calls after the collapse, not a fundamental all-clear. Cautionary: BTIG's own commentary notes 'the interest rate landscape has proven more challenging this year than previously anticipated,' and the fundamental-change signals confirm the deterioration — short float ramped from 13.2% to 16.6% in a month and consensus price target was cut 13.4% to $4.84. Broader market news (bitcoin, Iran) is context noise for UWMC. The signal: the sell-side has capitulated on 2026 estimates while retaining a Buy stance on valuation — a classic 'cheap but not yet working' setup that only resolves on rate cuts or a Q2 earnings surprise.
- Q1'26 revenue rebound to $504M (+49% from Q3'25 trough) suggests wholesale channel share gains are materializing as competitors exit
- Forward EPS estimate of $0.52 implies analysts expect earnings power roughly 2x Q1'26 annualized run-rate if rate environment cooperates
- Potential regulatory tailwind from small-dollar mortgage legislation referenced in prior analyst commentary could expand addressable origination volume
- Onity Group (peer) upgrade thesis around servicing recovery in high-rate environment offers read-through to UWMC's servicing book value
- 9,100-employee scale platform positions UWMC as consolidation beneficiary when weaker wholesale competitors capitulate
- Dividend at 329% payout ratio with -$2.2B Q1 OCF is mathematically unsustainable; a cut is likely and would break the retail-yield bid
- Debt/equity above 1000x with $16.5B total debt provides zero cushion — any funding market disruption is existential
- Short float jumped from 13.2% to 16.6% in ~45 days signaling smart money positioning for further downside or dividend event
- Aug 6 earnings is binary; consensus price targets have been cut ~13% in the last month, suggesting sell-side sees downside risk to estimates
- AI forecast model has realized directional accuracy below naive baseline (0% at 1wk) — the bullish V-recovery projection is not trustworthy
- Rate environment: BTIG explicitly noted 2026 has been tougher than expected; another leg higher in rates would crush origination volumes further
- Insider transactions -68% and institutional net -0.35% signal no informed accumulation at these levels
Get AI analysis on any stock
This is one of hundreds of Kronos AI reports — scored fundamentals & technicals, bull/base/bear price targets, a multi-horizon plan, and continuously-updated forecasts across the market. Create a free account to explore them all.
Create your free account →Already a member? Sign in · Join our Discord