YMM— AI Stock Forecast & Price Targets
Published 6/29/2026 · A free sample of K3vl4r’s AI-powered analysis.
Kronos price forecasts, scored fundamentals & technicals, and a multi-horizon plan.
View the live YMM price forecast →
Full Truck Alliance (YMM) is a high-quality, cash-rich Chinese logistics platform trading at a forward P/E of 9.1x with a PEG of 0.64, but the stock is in a clear downtrend, sitting near 52-week lows ($7.72 vs $14.07 high) with bearish technicals across all timeframes. The Kronos forecast is bullish but its realized directional accuracy (13-33%) is materially worse than naive baseline, so the rebound signal should be heavily discounted; the real thesis here is deep value with strong fundamentals waiting for a catalyst or sentiment turn on China tech.
Near-term tactical bias is cautious-constructive. Price is pressing the 52-week low ($7.45-7.53) with RSI 38.7 — close enough to a bounce zone that a starter position could be initiated here, but the Kronos V-bounce forecast should NOT be relied on given 13% directional accuracy. Strategy: small starter (¼ position) at $7.55-7.75, add at $7.20 if it breaks down further. Invalidation: clean weekly close below $7.20 changes the picture. Upside target for a tactical bounce: $8.50, with stretch $9.50. Tight risk management — this is not the spot to size big.
Over 1-6 months the thesis is mean reversion driven by valuation and balance-sheet support. At 9.1x forward P/E, PEG 0.64, 9% FCF yield, ~37% of market cap in net cash, and a $12.73 average analyst target (65% upside) plus Recom 1.47 (near strong buy), the asymmetry is favorable IF China ADR sentiment doesn't deteriorate further. Catalysts: Q2'26 earnings (typical seasonal strength), any buyback acceleration, China stimulus / consumer recovery, US-China trade détente. Expected return range: +15% to +45% base case; would change my mind on weak Q2 print, accelerating institutional outflows, or VIE/ADR regulatory escalation.
Multi-year thesis: YMM is the dominant digital freight matching platform in China — a picks-and-shovels play on Chinese logistics digitization with operating leverage (margins expanding from 23% to 35% in two quarters), platform economics, and a moat in network effects (3.1M shipper MAUs). At current valuation the market is pricing in either terminal decline or a permanent China-discount; neither is consistent with 14% order growth and 32% net margins. Bull case is a re-rating to 15-18x earnings as China tech sentiment normalizes. Biggest structural risk: VIE structure / ADR delisting / China regulatory crackdown on platform companies — a tail risk that has already compressed the multiple but could compress further or even zero the equity in a worst case.
Fundamentals are genuinely strong and decoupled from the price action. TTM revenue is CNY 12.6B with operating margins of 35.3% and gross margins of 85% (62.9% on Finviz GAAP basis), profit margin 32.7%, and ROE ~10.5%. Quarterly revenue grew sequentially through 2025 (Q2 CNY 3.24B → Q3 3.36B → Q4 3.19B → Q1'26 2.85B — note the typical seasonal Q1 dip), and Q1'26 net income was CNY 991M with operating margin re-expanding to 35.3% from 23.1% in Q3'25. The balance sheet is fortress-grade: CNY 18.5B total cash vs only CNY 25.7M total debt, debt/equity 0.06, current ratio 6.93, book/share $5.57 and cash/share $2.88 (37% of the share price is net cash). FCF is CNY 4.54B against an $7.2B market cap — roughly a 9% FCF yield in USD terms. The company also pays a 2.2-2.3% dividend. Capital allocation appears disciplined with growing operating cash flow (CNY 1.56B in Q1'26 vs CNY 326M Q1'25, a 4.8x jump). The only blemish is EPS Q/Q -16.9% and modest 10% top-line growth — solid but not hypergrowth.
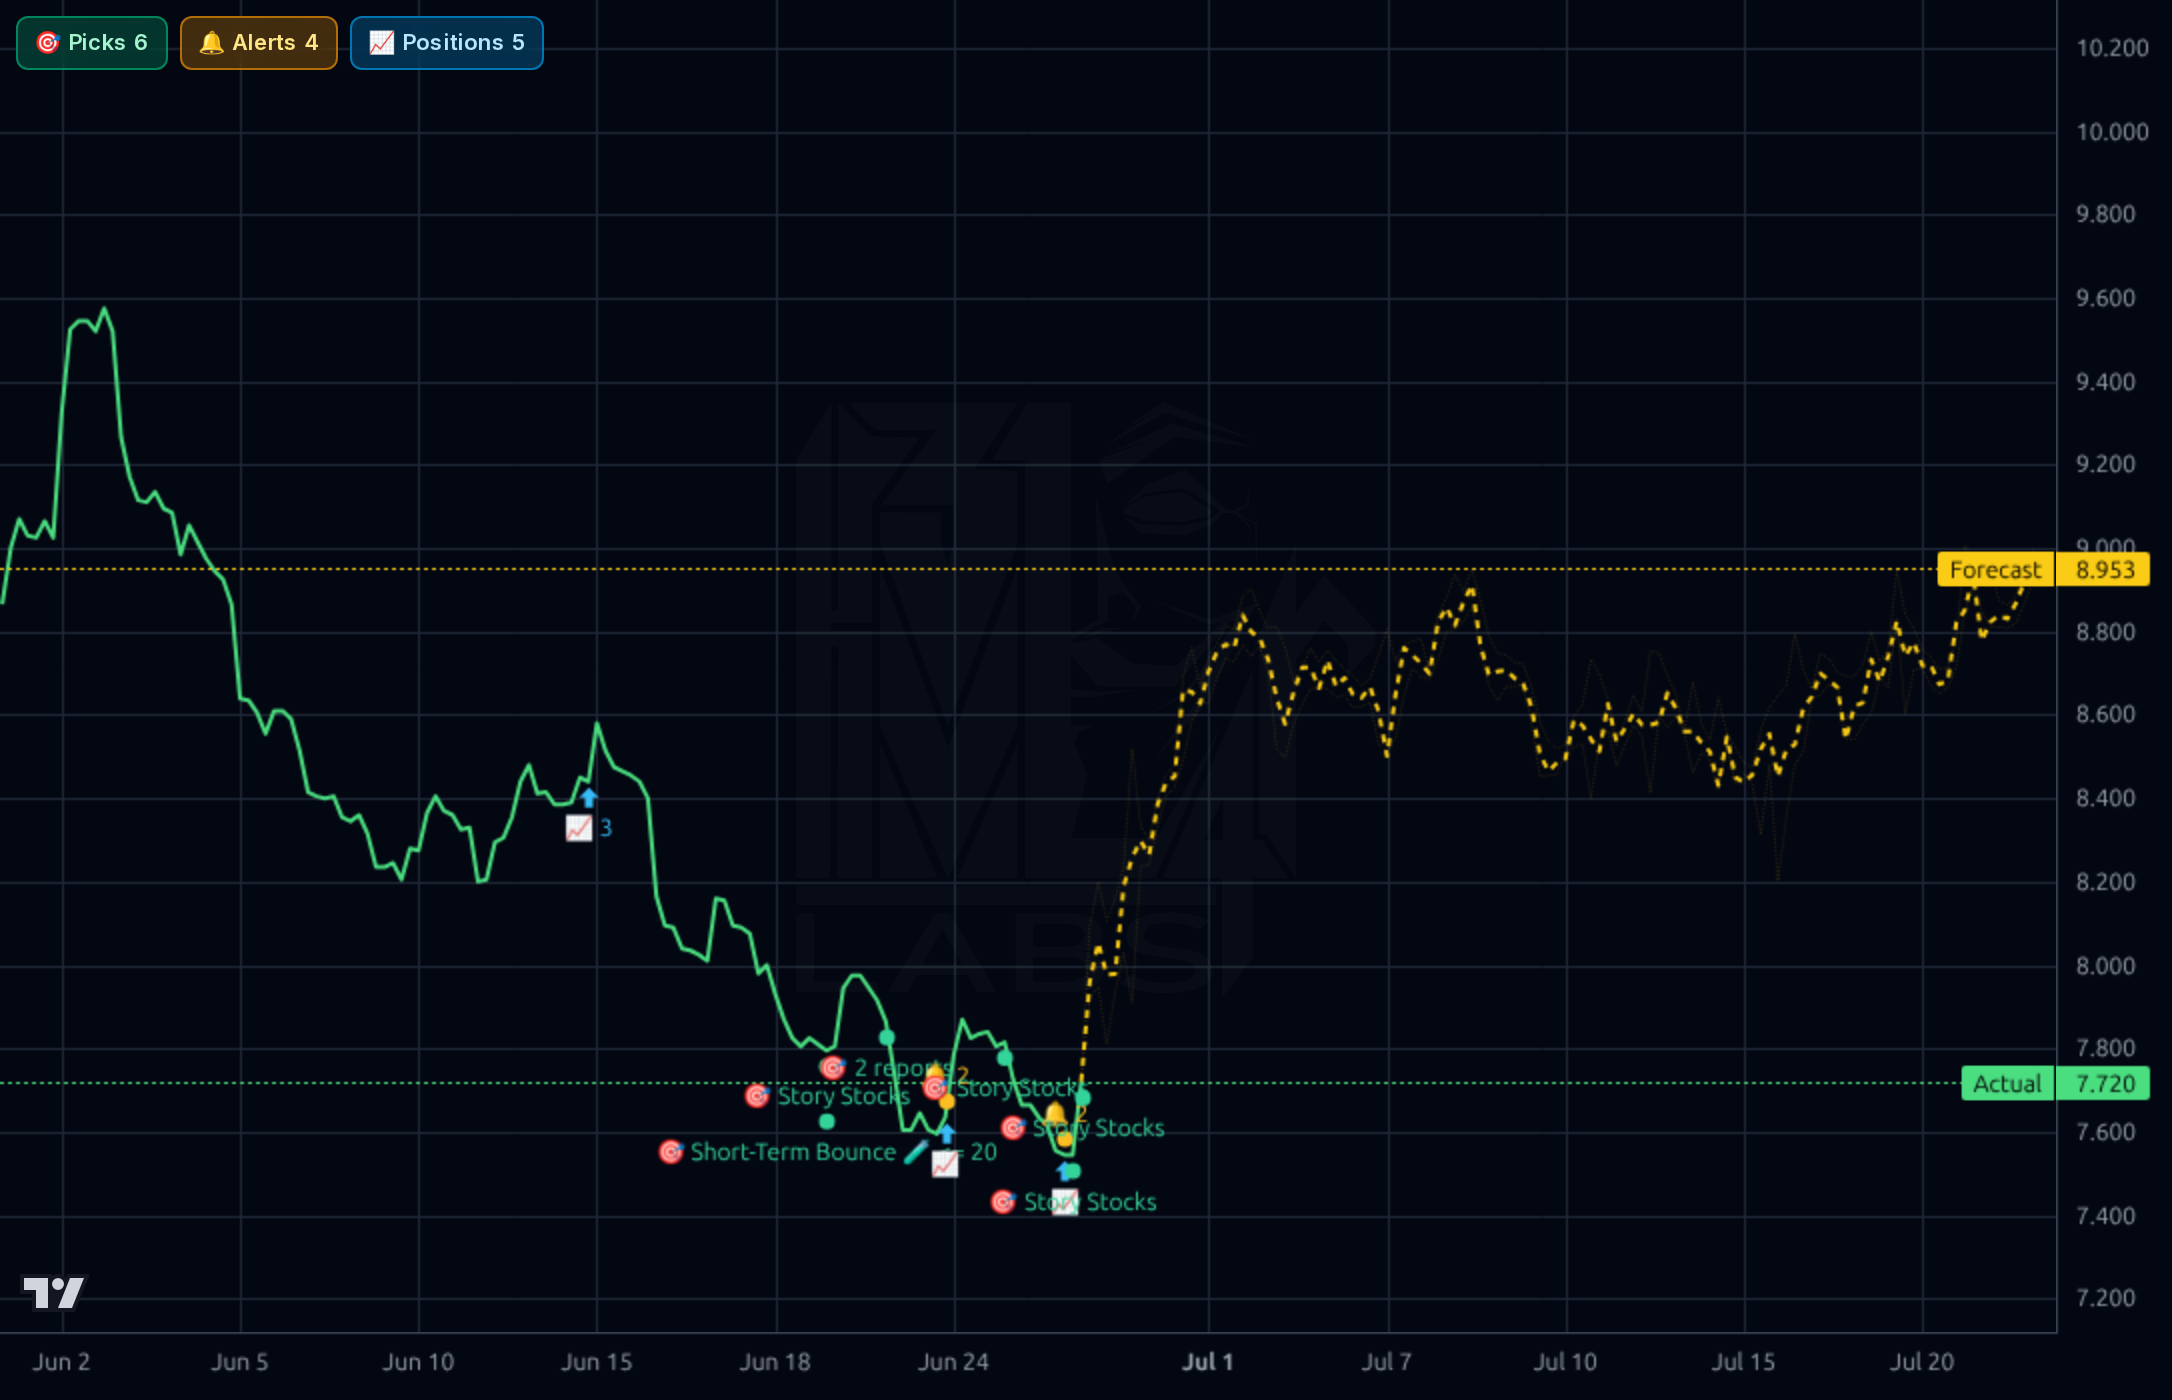
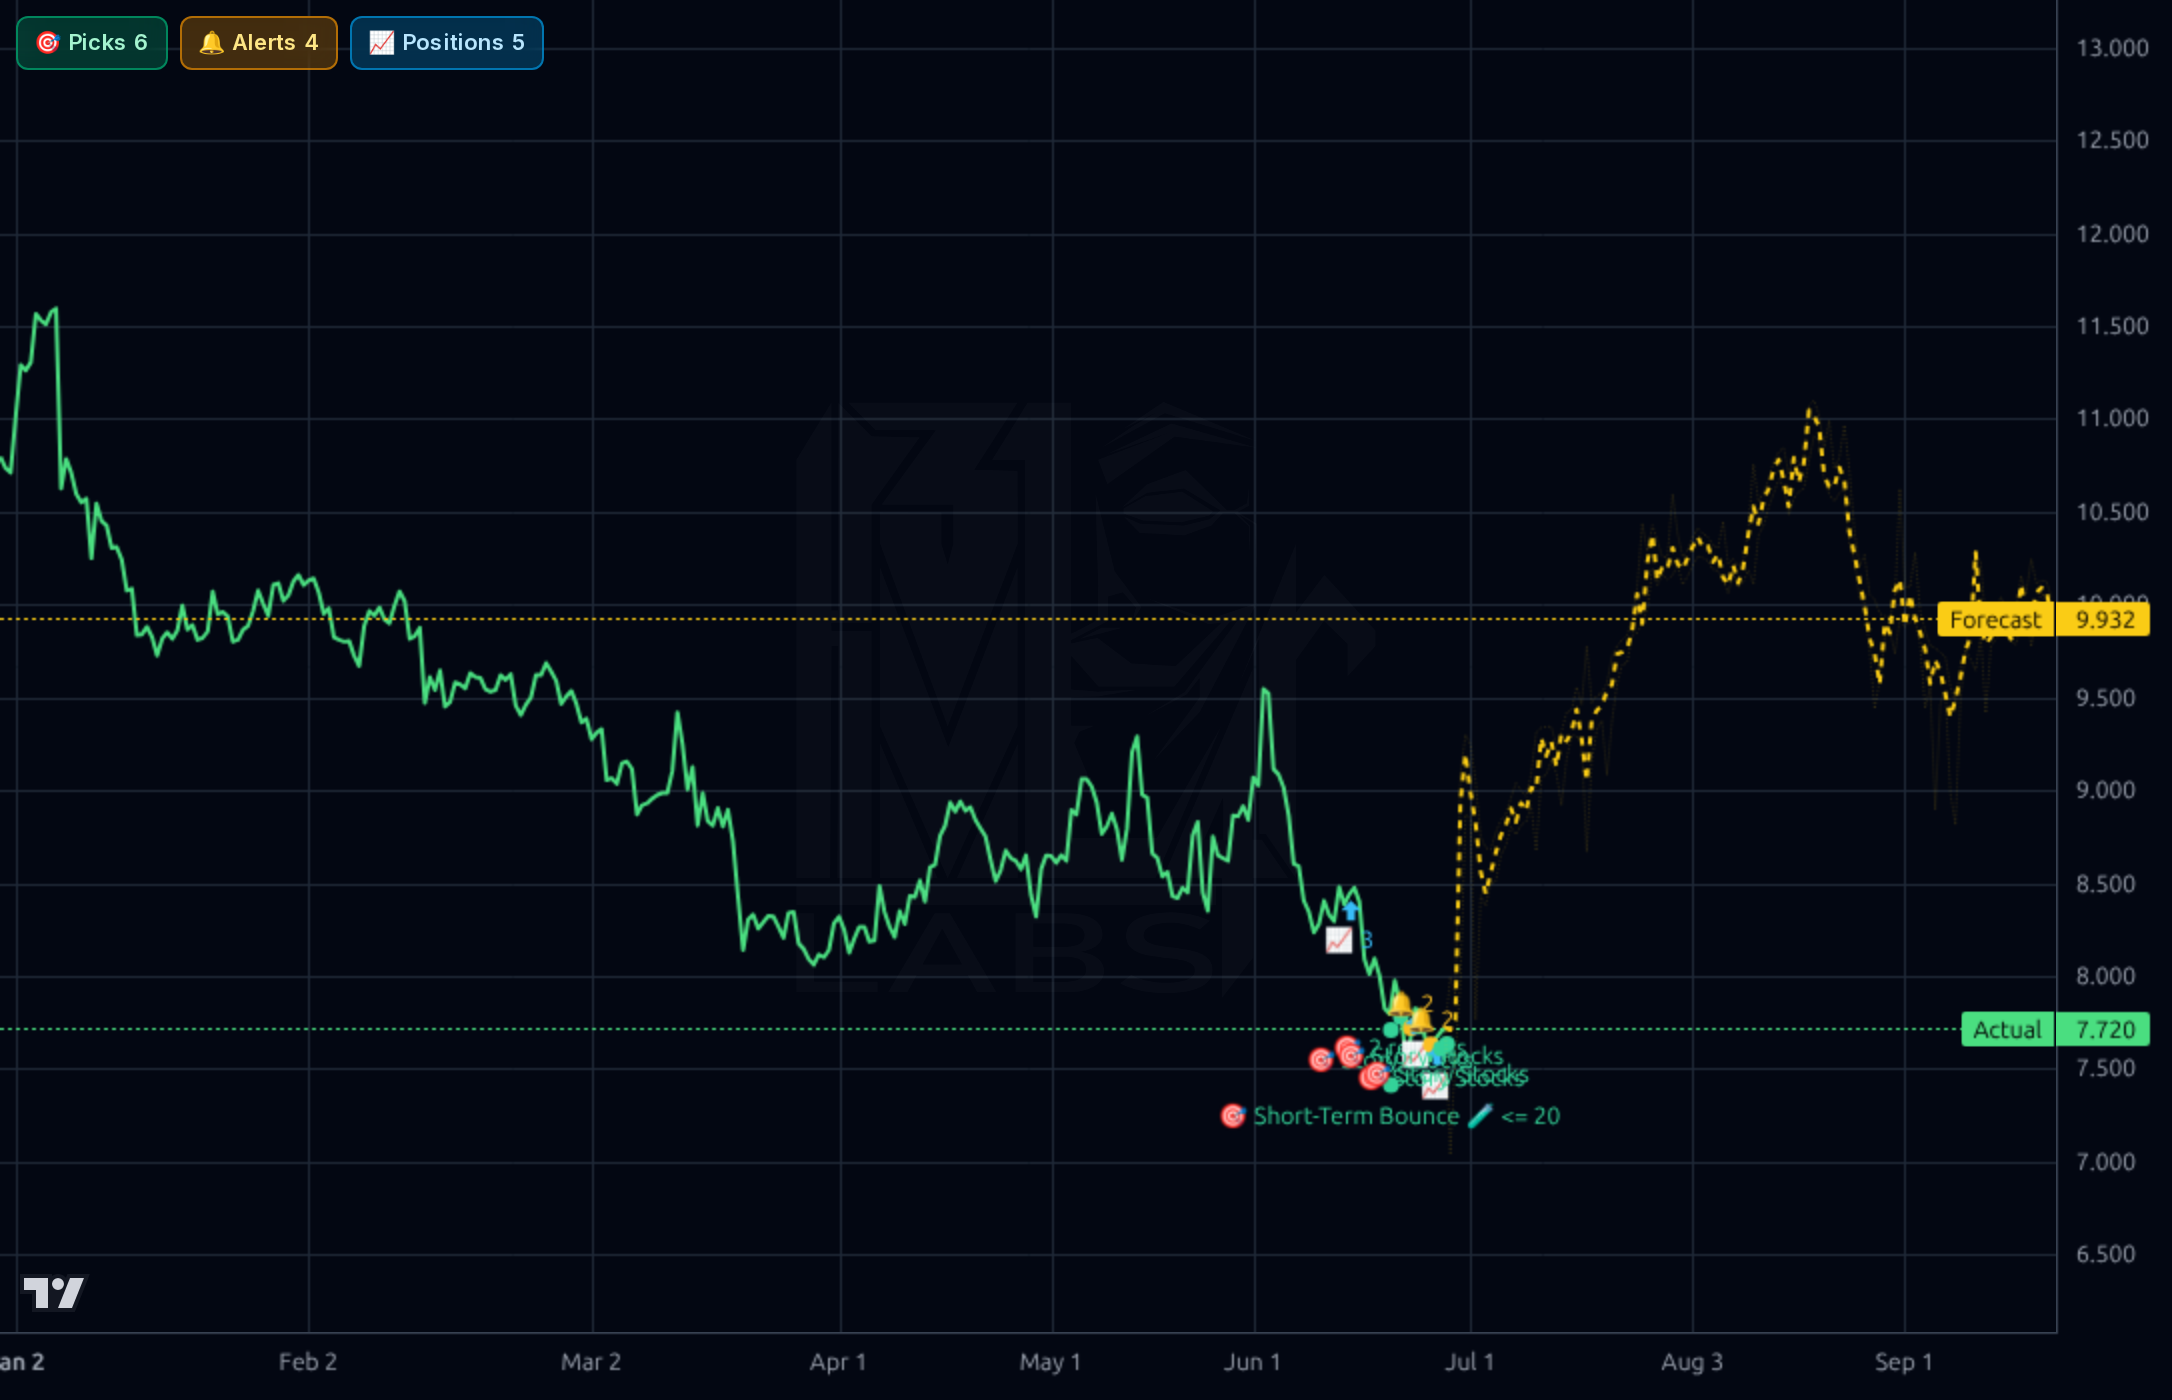
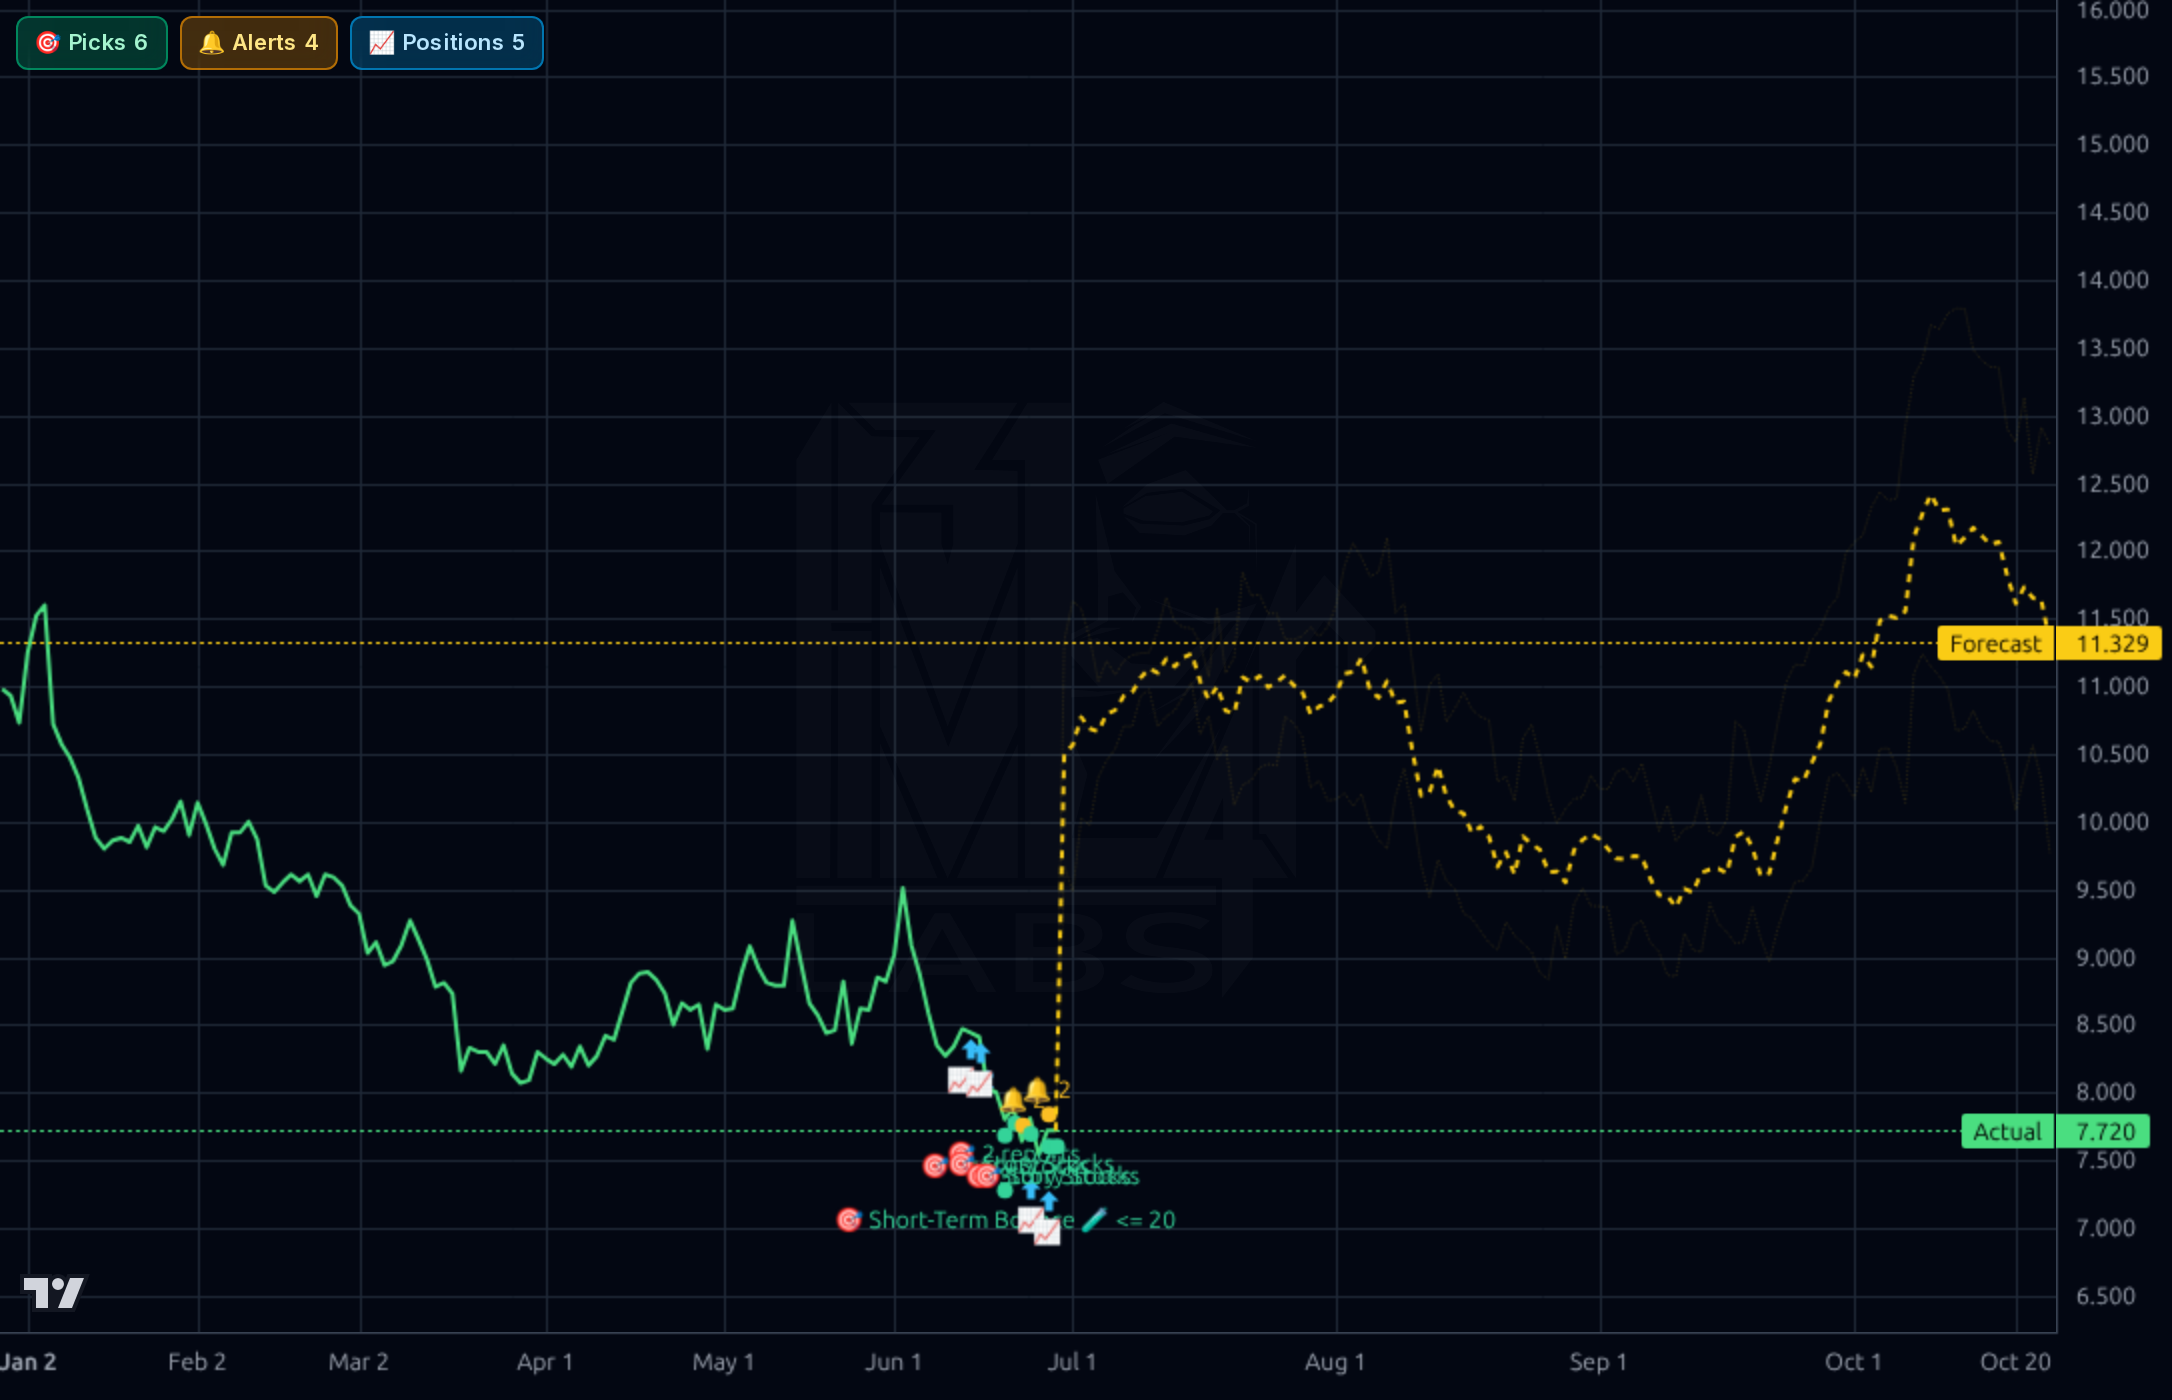
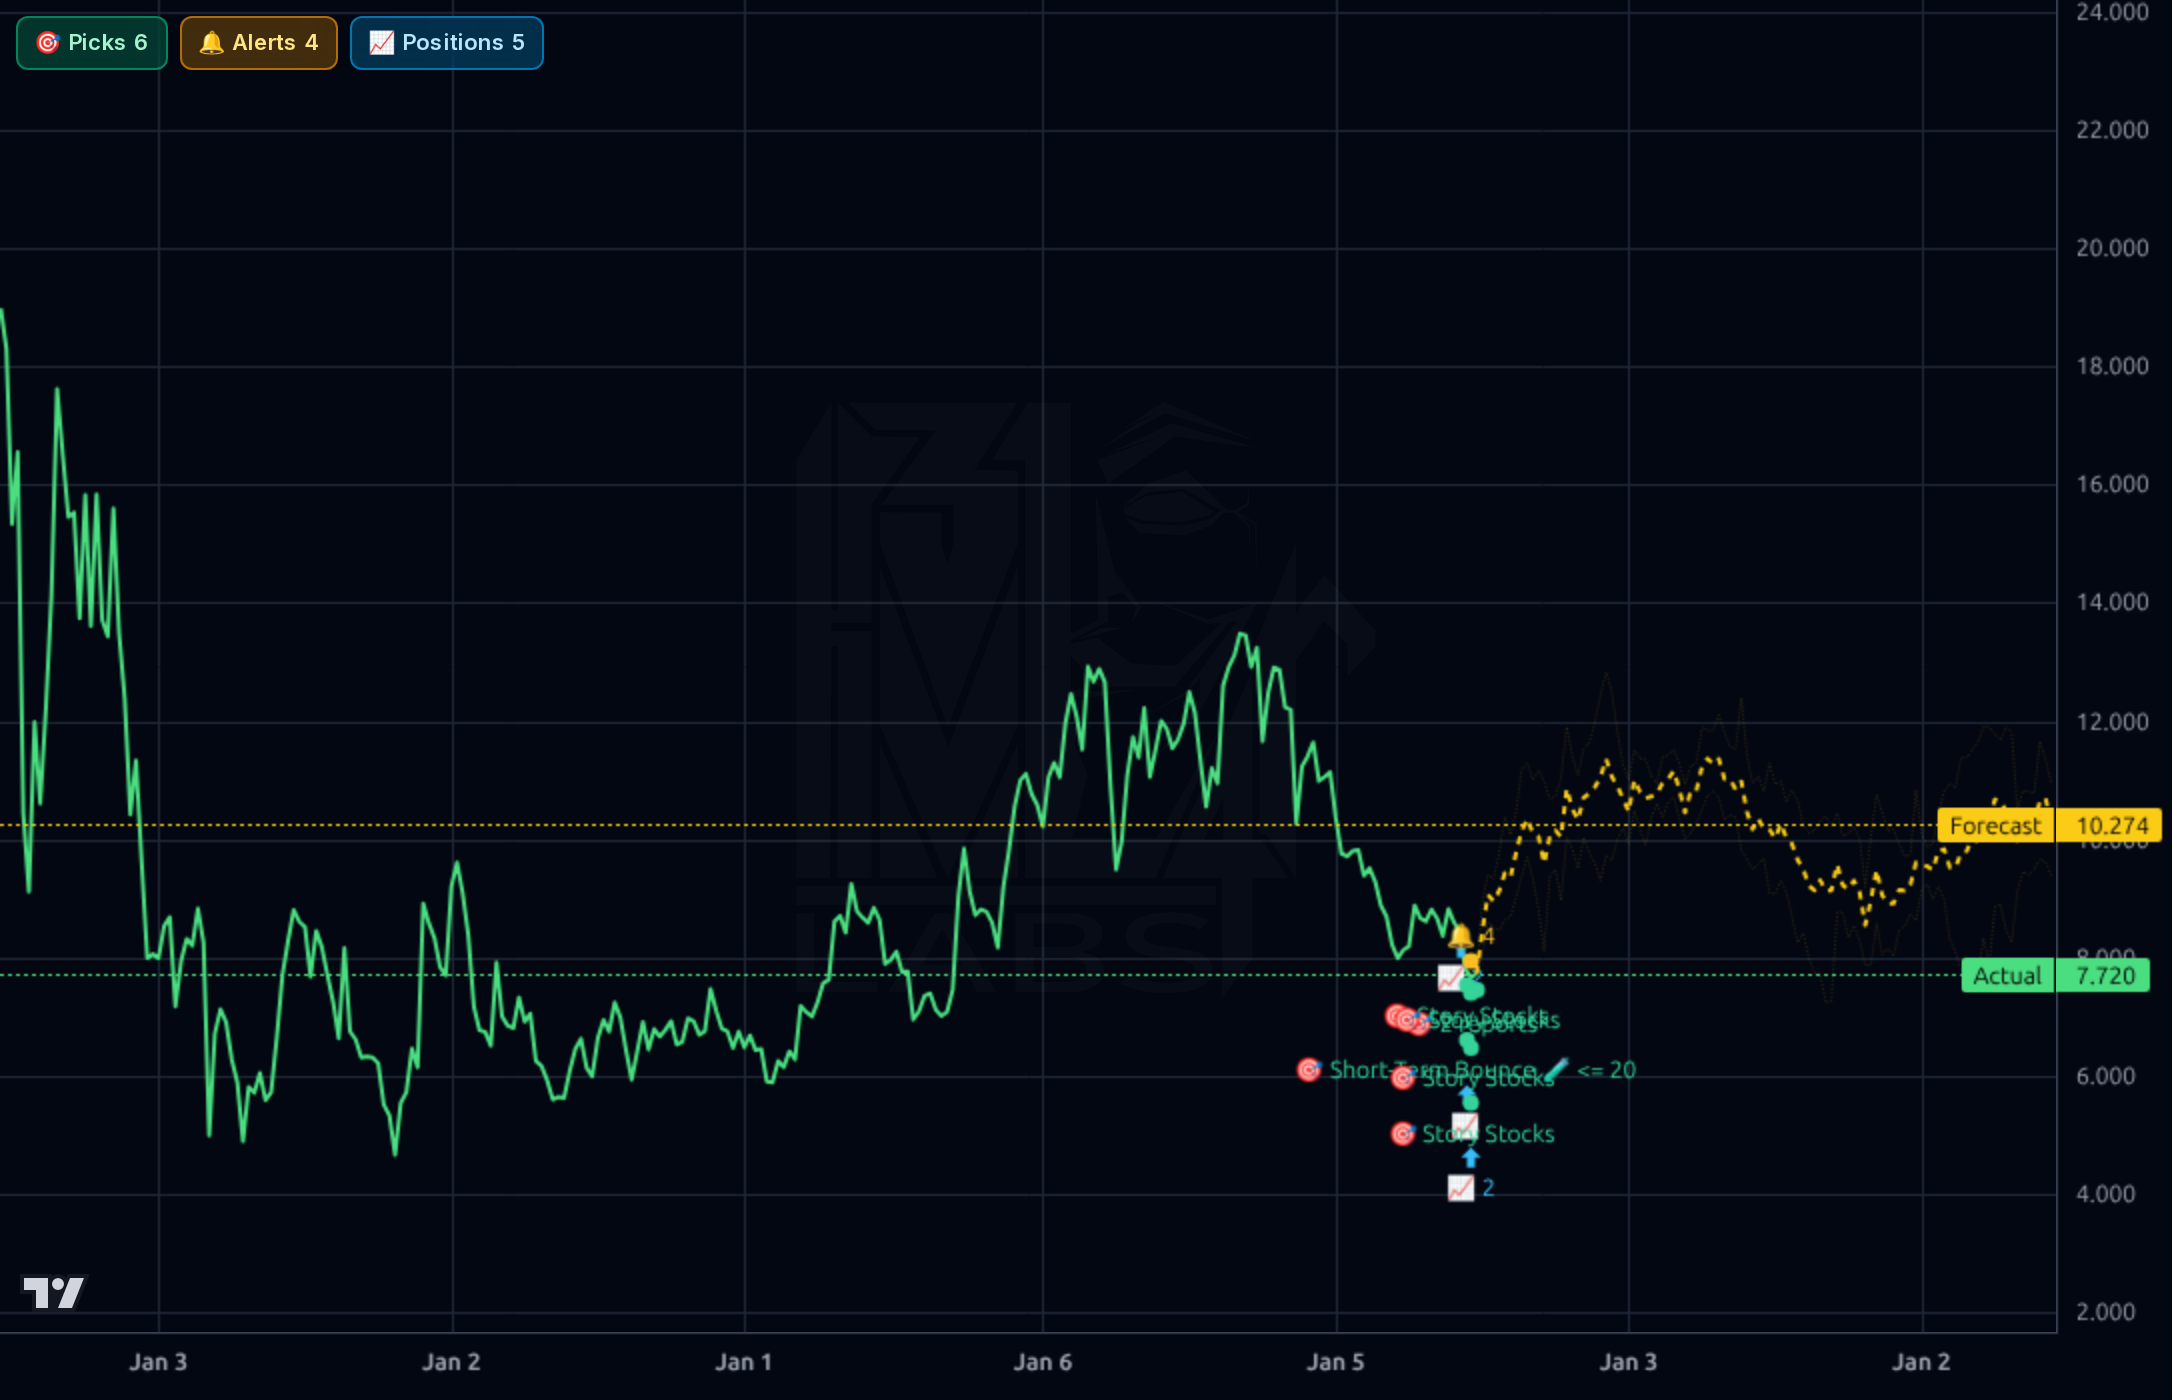
Technicals are clearly broken across timeframes. On the 1d/4h/1wk charts price has rolled over from ~$11.5 highs in January to $7.72, sitting -25% below the 200-day SMA, -9.9% below SMA50, and -7.3% below SMA20, with RSI(14) at 38.7 — weak but not yet oversold capitulation. The 1h chart shows a $9.60 spike in early June fading to a low near $7.45, with Story Stocks / Short-Term Bounce alerts clustered exactly at the lows — typical bottom-fishing zone but also typical knife-catching territory. Kronos forecasts a sharp V-recovery to $8.95 (1h), $9.93 (4h), $11.33 (1d), and $10.27 (1wk), but the model's own realized directional accuracy of 13% on 1d (vs 87% naive) and 33% on 1wk (vs 100% naive) means the forecast has been systematically wrong in this regime — discount heavily. Key support: $7.45-7.53 (52w low). Resistance: $8.50 (prior consolidation), then $9.50-9.60 (June spike high), then SMA200 area near $10.30.
Stock-specific news is thin. The only direct headline is a Zacks value comparison (YMM vs SYM) — supportive of the value framing but not a catalyst. Social sentiment is uniformly bullish (100% of tagged messages), with retail noting Q1'26 results: 55M fulfilled orders (+14.3% YoY), 3.11M shipper MAUs (+12.7% YoY), and non-GAAP EPADS of $0.14 on $412.9M revenue. One note flagged a fund's $194M exit from a China logistics name — potentially YMM-related and a reminder that institutional flows out of China ADRs remain a real overhang. The broader market headlines (Bitcoin, MiCA crypto licensing, Ukraine crypto seizures) are not relevant to YMM. The real macro driver — China ADR regulatory risk, VIE structure scrutiny, and US-China capital flow dynamics — is not in the supplied news but should be assumed as the dominant sentiment overhang explaining why a 35%-margin, net-cash, growing platform trades at 9x forward earnings.
- Order volume growth: 55M fulfilled orders in Q1'26, +14.3% YoY — core marketplace continues to scale
- Shipper MAU growth to 3.11M (+12.7% YoY) reinforces network-effect moat
- Operating margin re-expansion from 23.1% (Q3'25) to 35.3% (Q1'26) suggests value-added services (credit, insurance, ETC, intelligent driving) are scaling at high incremental margins
- Free cash flow generation of CNY 4.5B annually funds optionality for buybacks, dividend growth (already 2.2% yield, est. raising to 3.35%), or M&A
- Forward EPS growth est. 20.6% next year, EPS next 5Y CAGR 14.3% per Finviz — supports PEG of 0.64
- China ADR / VIE structural risk — the dominant overhang explaining the discounted multiple; could worsen on US-China policy
- Kronos forecast bullishness is unreliable: 13% 1d directional accuracy vs 87% naive baseline — don't trade off the yellow line
- Stock is in a clear downtrend: -25% below SMA200, -34% YoY, -28% YTD, pressing 52-week lows with no confirmed reversal
- Reported $194M fund exit headline hints at continued institutional de-risking from China logistics names
- Revenue growth is decelerating (Sales Y/Y TTM 10% vs 3Y CAGR 20%) — platform may be maturing faster than priced for premium re-rating
- Currency translation risk: CNY-denominated earnings into USD ADR; further RMB weakness compresses reported results
- EPS Q/Q -16.9% shows quarterly volatility; seasonal Q1 weakness could spook momentum traders
Get AI analysis on any stock
This is one of hundreds of Kronos AI reports — scored fundamentals & technicals, bull/base/bear price targets, a multi-horizon plan, and continuously-updated forecasts across the market. Create a free account to explore them all.
Create your free account →Already a member? Sign in · Join our Discord