RENDER's Good News Is Real. Its Bull Story Isn't.
 kev_larFounder & Lead Developer
⚠️ Not financial advice. This post is for informational and educational purposes only. Forecasts and commentary are model outputs and opinions, may be inaccurate, and are not a recommendation to buy or sell any security or asset. Do your own research. AI-assisted: this article was drafted with AI and reviewed by a human before publishing.
 # RENDER's Good News Is Real. Its Bull Story Isn't.
Let's separate two things that the RENDER camp keeps happily smuggling together: the network is quietly doing more work, and the token is quietly down 88%. Both are true. They are not the same thesis.
Here's the setup as of today. RENDER-USD is pinballing around $1.42, having limped off a base in the $1.28–$1.45 zone after a brutal slide from roughly $2.30 in early June. Support at $1.28 has held on a third test, which trades as a "floor" until it doesn't. The token last hit an all-time high of $13.53 in March 2024. It is currently worth about one-eighth of that.
Now the part that makes the bulls uncomfortable.
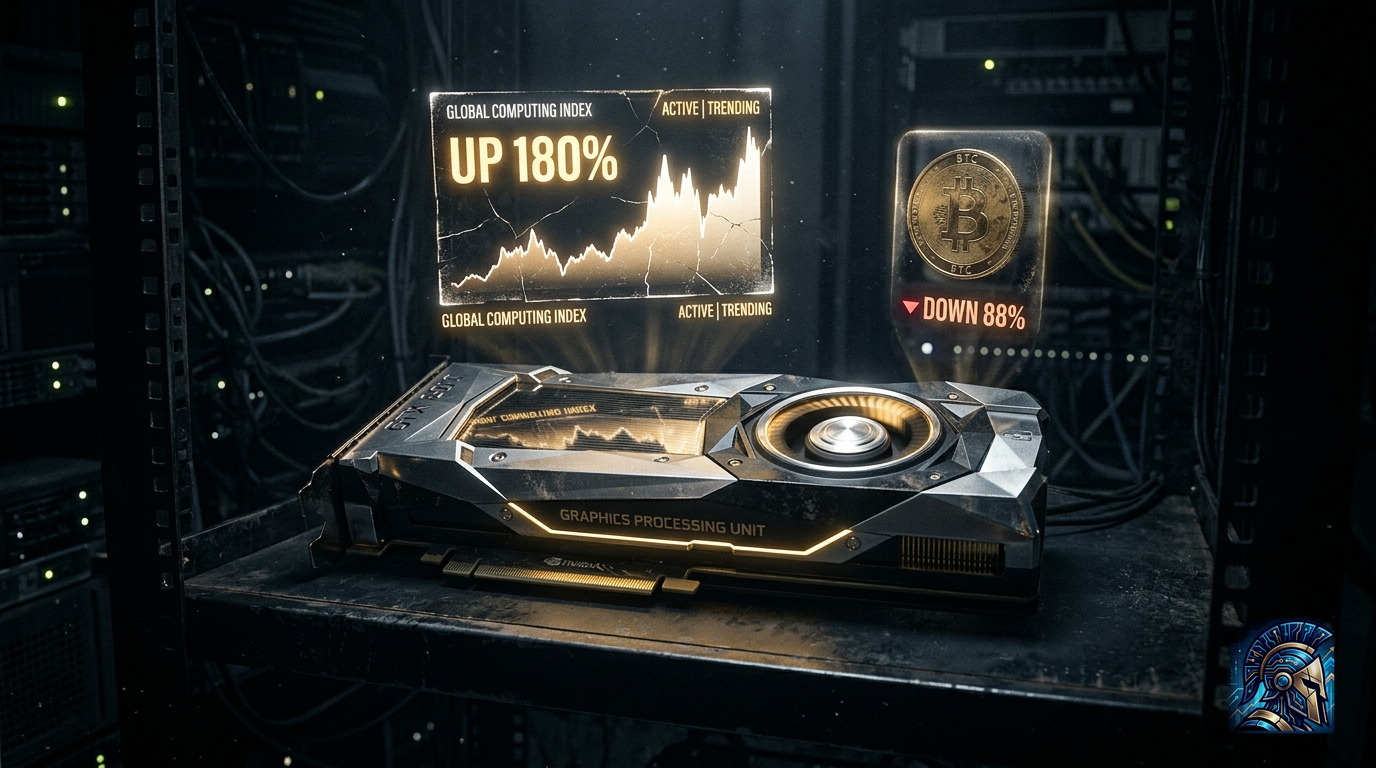
The operational numbers are real. The "up 180%" headline is a trick.
There's a loud narrative floating around that GPU demand on the network surged ~200% and that RENDER is "up 180% in six months." Read the fine print and both claims deflate.
The 200% surge is measured between September 2025 and March 2026 — a six-month window that opened more than a year before today. It's not a recent catalyst; it's an old headline wearing fresh paint. AI workloads now make up roughly 62% of demand, network utilization is above 78%, and the dashboard shows around 80.76 million frames rendered across roughly 5,600 nodes. Those are legitimate adoption signals.
The "up 180%"? Against a $13.53 peak and a ~$1.58 reference price, that's an ~88% drawdown, not a rocket ship. The numbers coexist, but only one of them is bullish.
What's actually under the hood
RENDER is a decentralized GPU-compute market — it matches creators and developers needing graphics or AI compute with node operators selling idle GPU capacity. It launched its RENDER SPL token on Solana in November 2023, broadening from 3D rendering into AI/ML and inference. Critically, the blockchain itself doesn't do the compute; it records transfers, payments, burns, and emissions. The actual rendering happens off-chain.
On the demand side, there's a plausible story: a global GPU shortage and cloud waitlists have made decentralized compute attractive, with Render claiming 40–60% cheaper compute than AWS, Google Cloud, and Azure. A Salad subnet approved in April 2026 reportedly adds ~60,000 daily active machines across 180+ countries. Supply-side, node operators can now support capacity equivalent to up to 1,200 NVIDIA H200 GPUs.
But here's the rub the bulls gloss over: none of this is revenue. The network is running hot on work, but there's no verifiable fee-capture or utilization-to-revenue conversion anchoring a valuation. Price is being driven by BTC beta and derivatives flow, not by cash flows. And the burn-and-mint-equilibrium model that's supposed to be supportive is also minting new supply — Year 1 alone is roughly 9.13M RENDER. Dilution and burns are happening at the same time.
The bear case isn't dramatic. It's boring, which is worse.
Growth is decelerating — network usage reportedly grew +200% YoY in 2024 but only +87% YoY in 2025. Momentum is slowing even as the story gets louder. The token's market-cap rank slipped to #86, well below the #58 it held in our own data. Supply figures don't even agree with themselves: the Foundation and CoinGecko report circulating supply of 555.6M vs. 518.8M. When a project's own dashboards can't reconcile its own token count, you are not trading a fundamental; you are trading a vibe.
And then there's the crowd. Retail sentiment sits at a near-unanimous 100% bullish during a downtrend. That is the textbook contrarian red flag. Nobody buys when everyone is euphoric in a falling knife. They buy when the euphoria is already spent.
The technical reality check
The model's own directional accuracy on the daily chart is 38% — below the 67% naive baseline it's being measured against. Translation: those forecast targets of $1.91 near-term and $3.69 longer-dated are optimistic bounds, not expectations. On the weekly, accuracy is a more credible 83%, and the trend there reads constructive. That's worth something: the slower timeframe likes the base more than the daily does.
So what's the actual setup? $1.50 is the structural repair threshold. Reclaim it with volume and you're looking at a $1.65 shelf. Fail there and $1.42 stays trapped. Below $1.28 on a daily close, the floor disappears and $1.20–$1.25 comes into play. The base case, honestly, is $1.36–$1.45 — a coin chopping along at the bottom of its range while the narrative runs laps above it.
My take
The story is real; the stock is not. RENDER has built genuine usage, a credible supply expansion, and a demand tailwind that isn't imaginary. But "real adoption" is not a price floor, and a token down 88% from its high with decelerating growth, self-inconsistent supply counts, and a 100% bullish retail crowd is not a bargain waiting to be discovered — it's a market that has already made its point and is now being narrated into oblivion.
Trade the levels, not the pitch deck. Reclaim $1.50 with volume or stay on the sidelines. And when someone tells you RENDER is "up 180%," ask them against what. The answer, almost always, is: against a mountain they never actually climbed.
More on RENDER-USD
Market commentary from the K3vl4r desk — not personalized investment advice. More posts →