62 indicators. 11 you won’t find anywhere else.
Every standard study you know — EMAs, Bollinger, RSI, MACD, Ichimoku — plus a layer of AI-native signals built on our forecasting model: how much to trust the forecast, how bullish the model is on a name, and how the whole market is leaning.
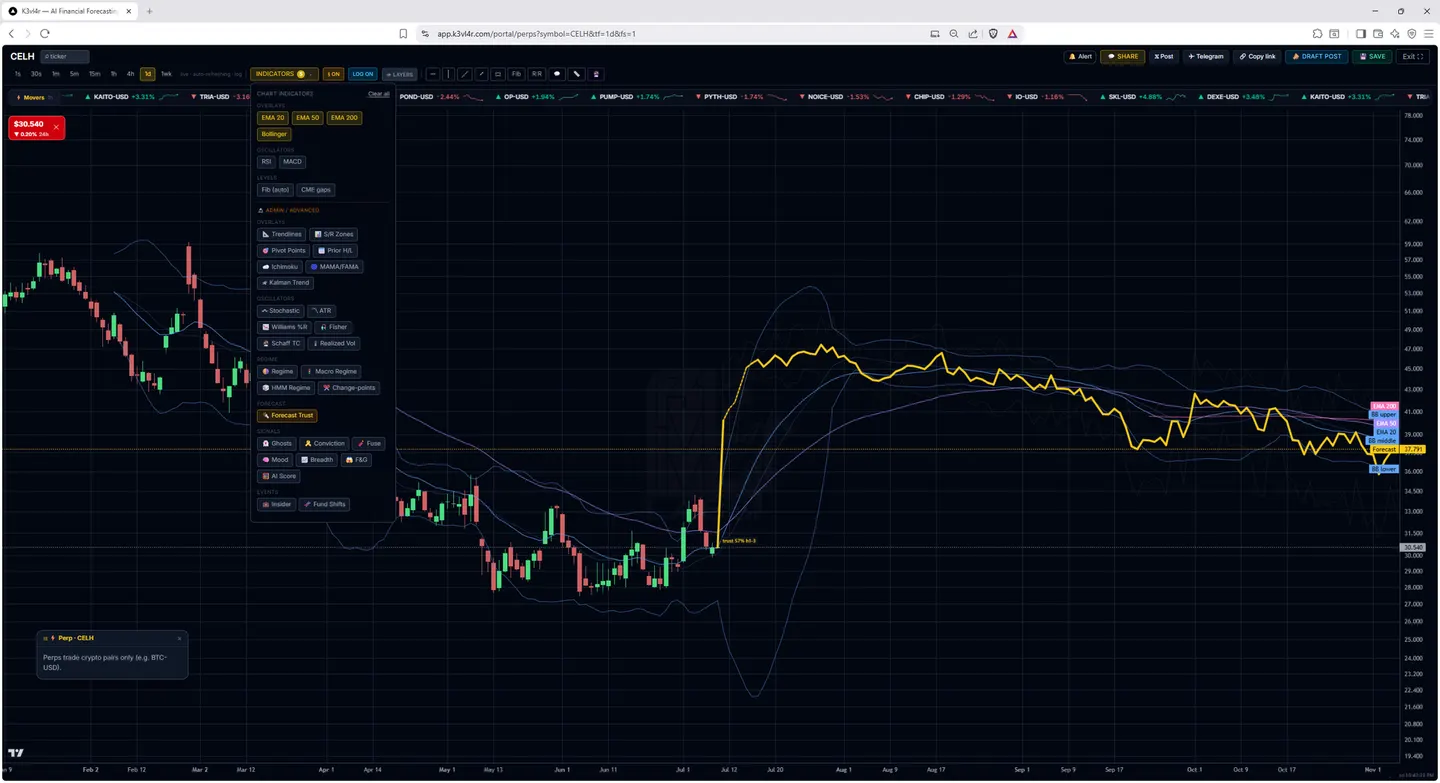
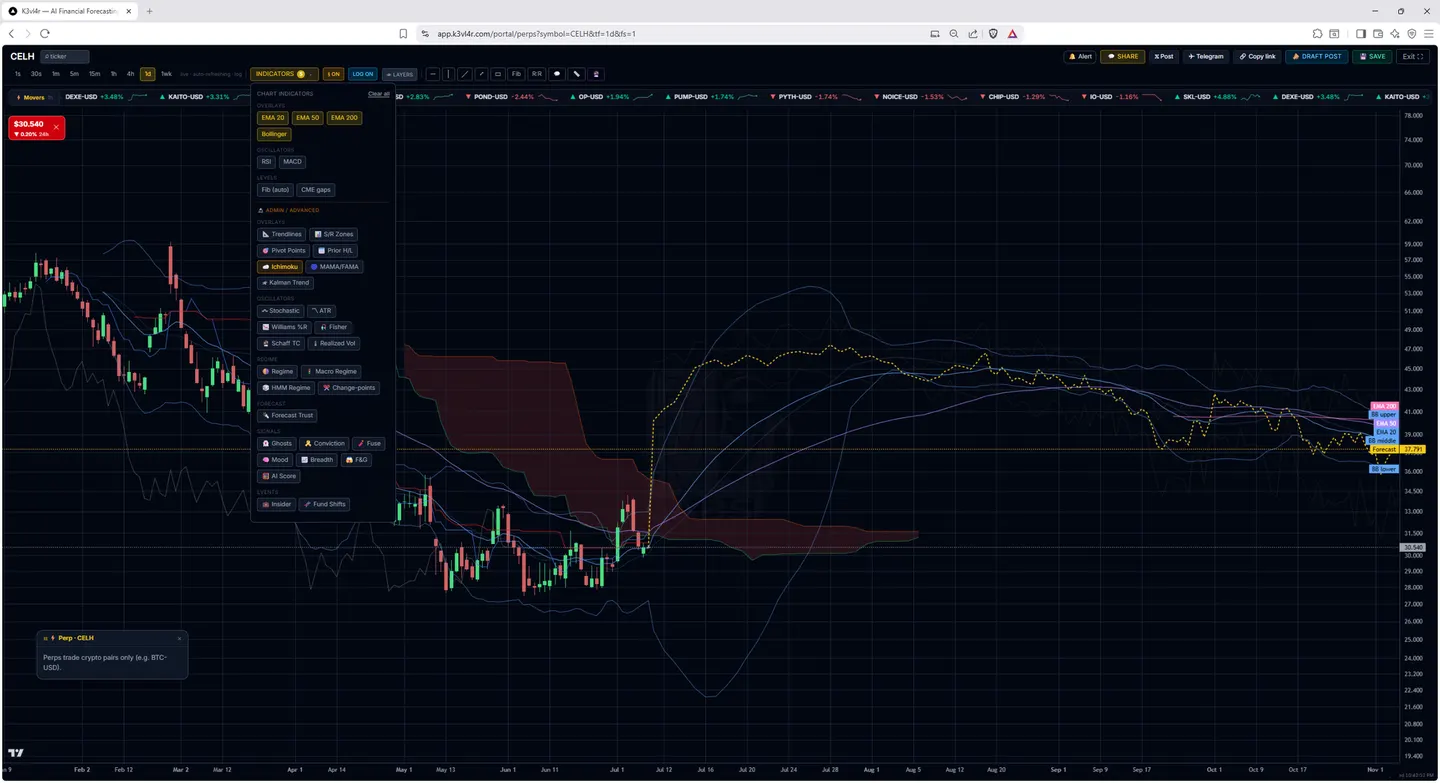
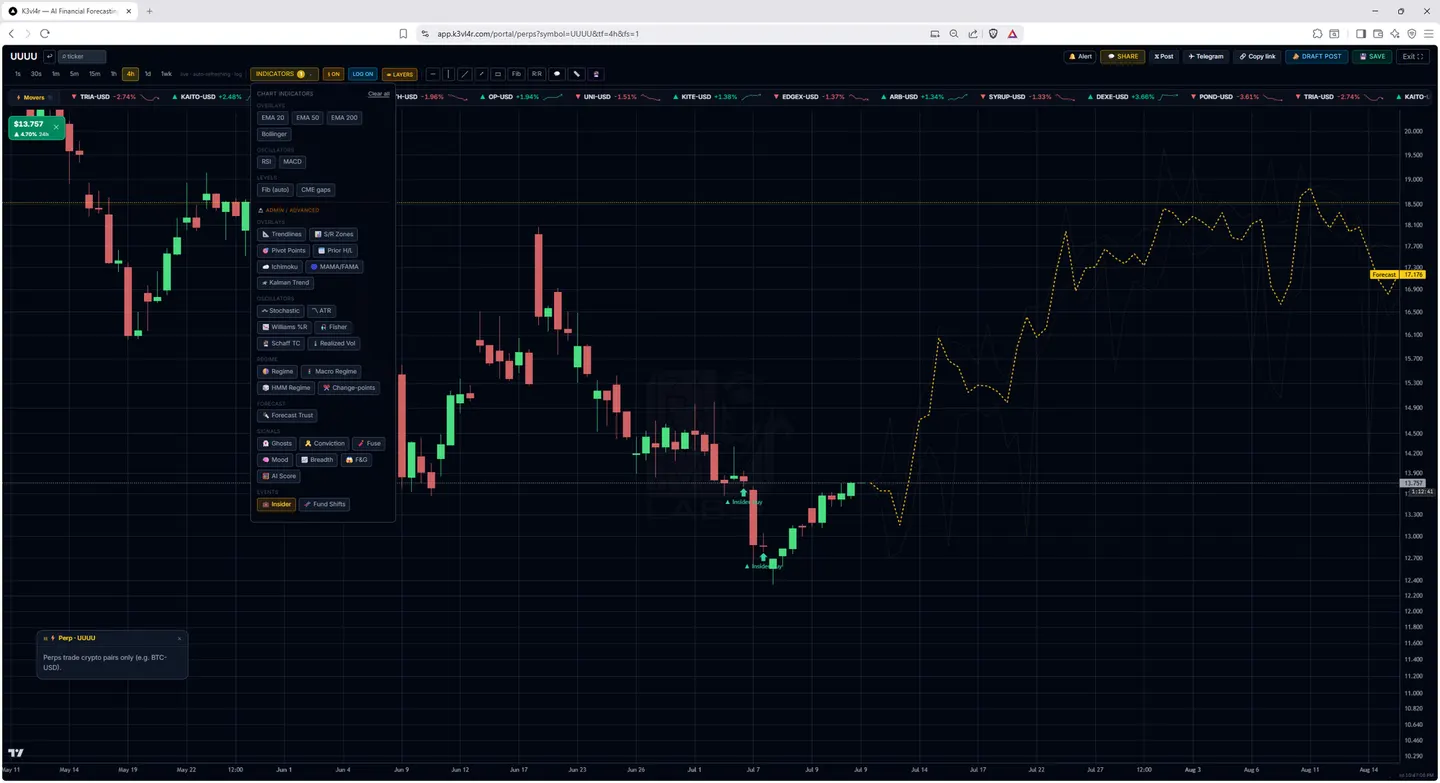
The AI grades its own forecast by its measured hit-rate — trust the line only as far as it has earned.
These read the model itself, not just price — so they don’t exist on generic charting tools.
9 indicators
Standard charting — free forever, no card.
Exponential moving average — short-term trend at 20 bars.
Exponential moving average — the swing-trend workhorse.
Exponential moving average — the long-term line in the sand.
Volatility bands around a 20-period mean — squeezes and breakouts.
Relative Strength Index — momentum, overbought/oversold at 70/30.
Moving-average convergence/divergence — momentum and trend shifts.
Auto Fibonacci extensions drawn from the latest swing.
Unfilled futures gaps — magnet levels price tends to revisit.
Per-bar trading volume, colored by direction — confirm moves and spot exhaustion.
14 indicators
The classic pro toolkit — the studies serious traders expect.
Support & resistance drawn automatically from recent swing pivots.
Clustered supply/demand zones, weighted by how often price tested them.
Classic floor-trader pivots — P, R1–R3, S1–S3.
Prior day & week highs and lows — the levels everyone watches.
Stochastic oscillator (%K/%D) — momentum turns at 80/20.
Average True Range — real volatility for stops and position sizing.
Momentum extremes — a fast overbought/oversold read.
Trend, support/resistance and momentum in a single filled cloud.
Four EMA pairs — 5/12, 34/50, 72/89, 180/200 — shaded as clouds that flip color the moment the fast line crosses the slow one. Trend alignment across scalp, swing and macro speeds in a single glance, with each band acting as dynamic support and resistance.
An EMA with bands set by Average True Range rather than standard deviation — they widen when bars physically get bigger, gaps and wicks included, not merely when closes scatter. Read alongside Bollinger: when the Bollinger bands slide inside these, volatility is coiling.
Hammers, engulfings, morning and evening stars, piercing lines, three soldiers and crows — marked on the bar that completed them. Context is enforced, not ignored: a long lower wick only counts as a hammer after an actual decline, because the identical bar mid-rally means nothing. Body and wick thresholds scale to the instrument’s own recent range.
Wilder’s stop-and-reverse — a dot that trails price and accelerates toward it as a trend extends, flipping to the other side when price touches it. The one study here that is path-dependent: each dot depends on the whole run before it, not on a window.
A trailing stop hung a set number of ATRs below the recent high (for a long) or above the recent low (for a short). It ratchets — the long line only rises while the high holds — so it answers the question the targets don’t: where to get out.
Crowd sentiment as a 0–100 gauge — read against the AI’s own mood.
39 indicators
Advanced math plus the AI-native signals you can’t get anywhere else.
Prior trendlines too — age-faded, cut off where price broke them, plus a long-timescale channel line.
Adaptive moving average that speeds up in trends, slows in chop.
A smooth, adaptive state-estimate of the underlying trend.
Sharpens turning points into decisive peaks and troughs.
A faster, cleaner MACD-style cycle oscillator.
Realized + GARCH volatility — how much the tape is actually moving.
Trend-vs-chop regime painted behind price so you know which tools to trust.
Hidden-Markov bull/bear state detection, washed behind the candles.
Statistical structural breaks (CUSUM) marked where the trend shifted.
Our regime engine’s risk-on / risk-off call over time, washed behind price.
Grades the AI forecast by its own measured hit-rate — trust the line only as far as it has earned.
Prior AI predictions as fading trails — see at a glance how consistent the model has been.
The AI’s measured accuracy modulating the forecast band’s confidence.
Flags coiling volatility that’s about to release.
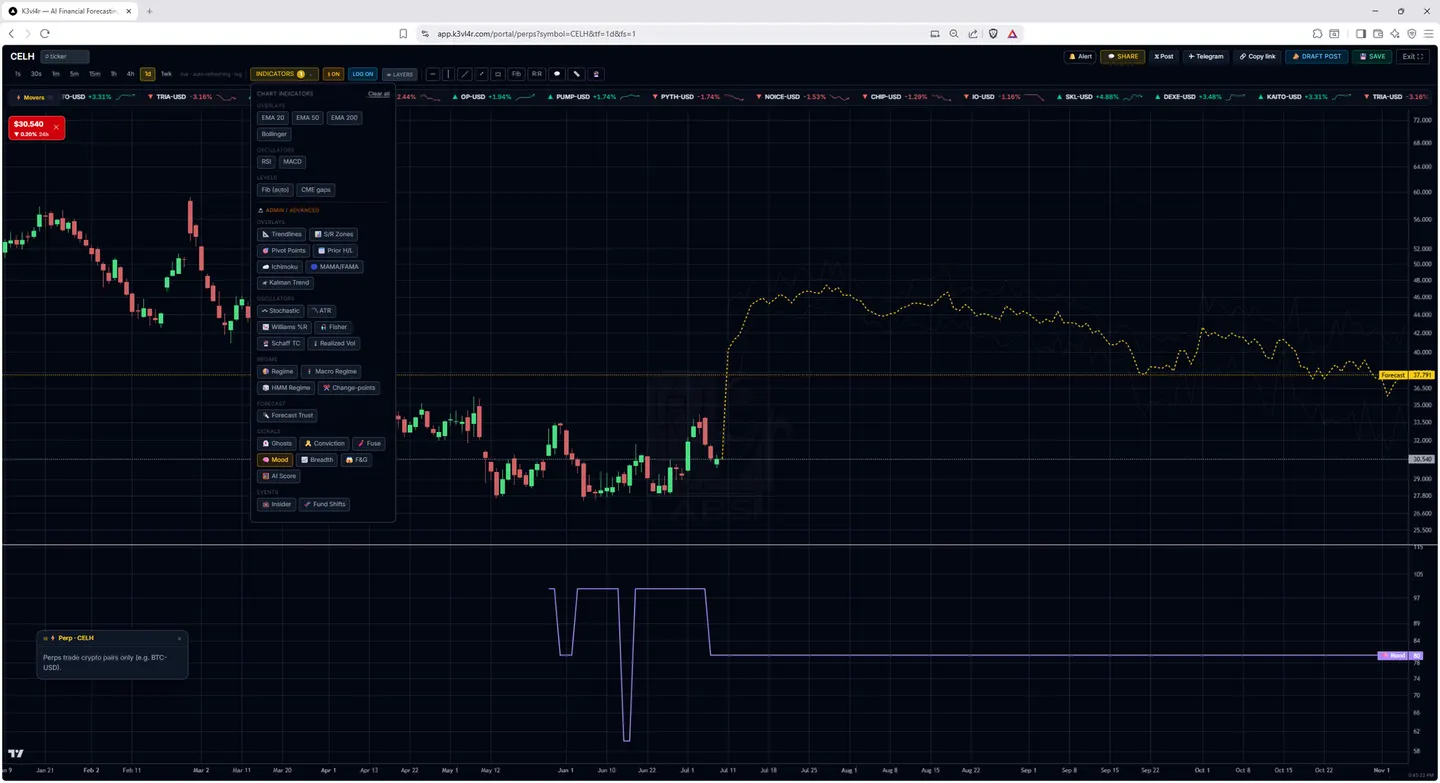
The model’s bullishness on THIS symbol over time, as a 0–100 line.
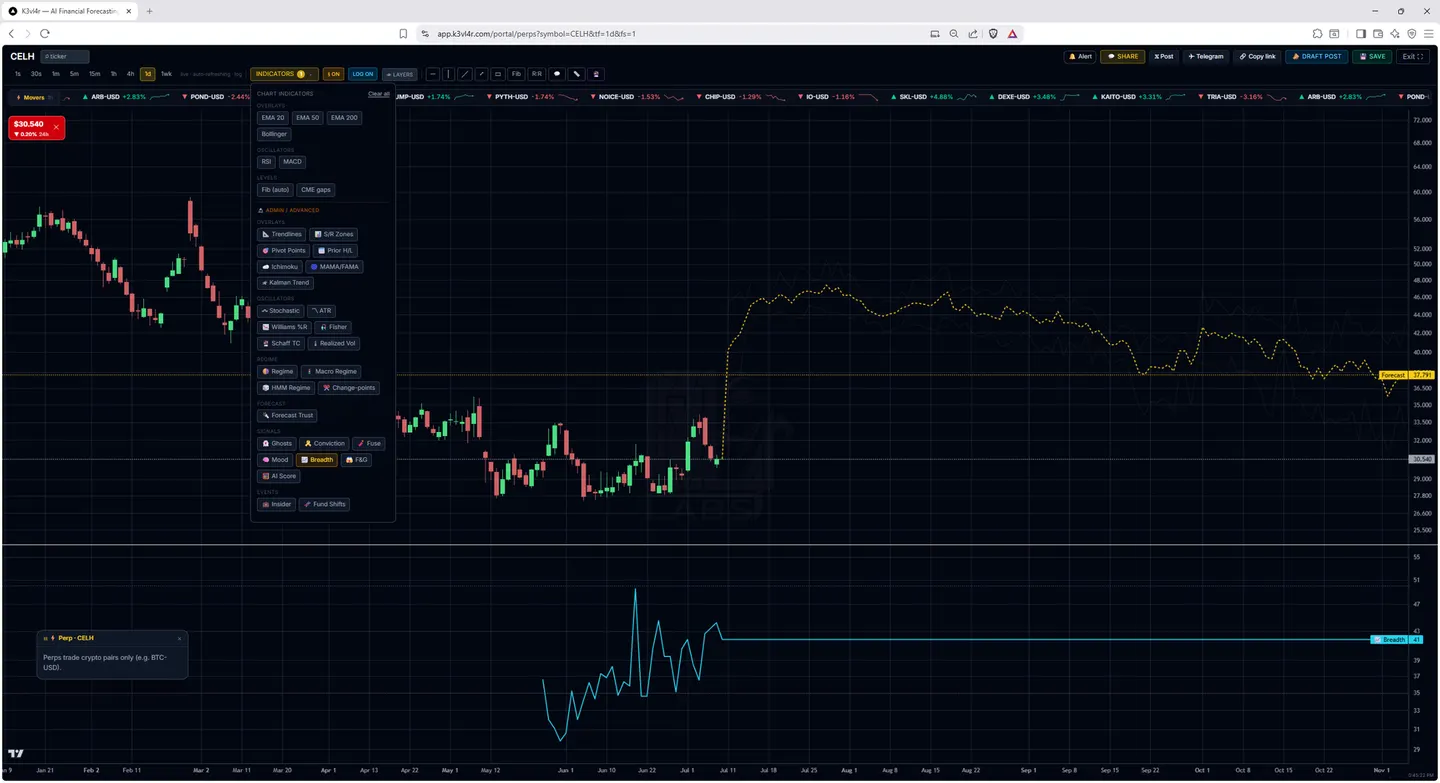
How broadly bullish the AI is across the ENTIRE market — regime context under any chart.
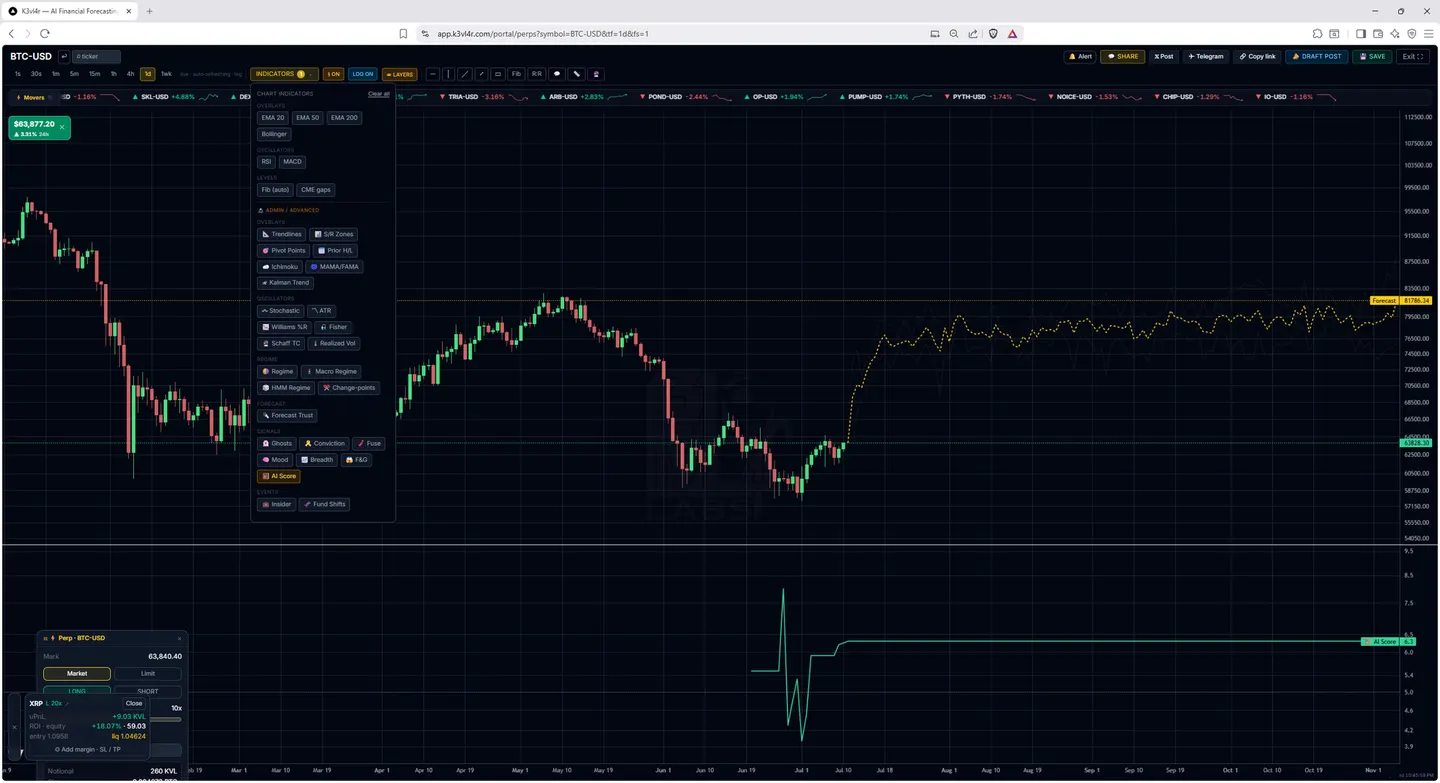
The AI’s evolving grade on this name over time.
Open-market insider buys and sells marked right on the price bars.
Detected changes in a company’s fundamentals, graded bullish or bearish.
Volume-weighted average price — the session’s fair value line, with ±1σ and ±2σ volume-weighted deviation bands. Price at the outer band is statistically stretched from where the volume actually traded, which is the setup mean-reversion traders wait for.
Volume-weighted average price over a trailing 20-bar window that never resets — a slow fair-value mean that follows price instead of measuring distance from a fixed anchor. Pairs with session VWAP: one says where value is now, the other where value has been since the open.
On-Balance Volume — cumulative volume flow, confirms or diverges from price.
This bar’s volume vs. its recent average — spot unusual participation.
Volume traded at each price level — the point-of-control and value area where the market agreed on price.
The forecast mirrored around the live price — an equal-and-opposite “what if it goes the other way” shadow path.
The forecast sized to its own track record — the predicted move scaled by the model’s measured edge at each horizon, fading to flat where it has none.
A heuristic 5-3 wave count drawn from recent swings, with an A-B-C correction and next-leg projection — a suggested count to react to, not a definitive one.
Completed Fibonacci XABCD patterns — Gartley, Bat, Butterfly, Crab, Cypher — detected off recent swings, each with its potential reversal zone (PRZ) shaded. Bullish (buy at D) green, bearish red. Heuristic; treat as structure to confirm, not a signal to blindly trade.
Harmonic patterns still forming — X-A-B-C printed near the right edge, with the D-point PRZ projected forward as a confluence band. The tradeable early-warning view; the pattern only validates if price reacts inside the zone.
Harmonic reversal zones from EVERY higher timeframe, projected onto whatever chart you’re on — see the daily Bat’s reversal zone while you scalp the 1-minute. Only the zone crosses over, because a price level is timeframe-independent while a pattern’s legs are not. Each band is labelled with the timeframe and pattern that produced it.
The price levels our deep research and AI reports actually named — range lows and highs, support, resistance, targets, invalidation — drawn on the chart with the report’s own label. Ranges are shaded bands. Turn on history to see how those levels moved from one report to the next: each older level runs from the day it was said until a newer report replaced it.
The simple 4-point AB=CD symmetry (CD ≈ AB, BC a 0.382–0.886 retrace) — the building block underneath the larger harmonics, drawn with its completion zone.
The constant-compounding trend through a long advance, with ±1σ and ±2σ bands projected forward. Nothing to anchor or tune — it is fully determined by the data, so the upper band is a reproducible read on how stretched a run has become.
The 111-day average crossing above twice the 350-day average — a long-cycle exhaustion signal, marked on the bar where it fires. 3-day charts and higher. Famous for catching several cycle tops, though on far too few instances to treat as more than one input.
The published model of how bubbles end: a super-exponential run whose swings compress toward a critical date. Fits that shape to your chart and reports the implied date plus how cleanly it matches. The date moves as the window grows — read it as a shape, not a schedule.
Flags the bars where the Bollinger bands sit entirely inside the Keltner channel — dispersion has collapsed against true range and price is coiling — then marks the release. A momentum histogram underneath shows which way the coil is loaded and whether that loading is still building. The tradeable event is the release, not the squeeze.
Where this symbol’s volatility has historically lived at each horizon — 5, 10, 21, 63 and 126 bars — with today’s term structure drawn over it. Answers the question a raw volatility number cannot: 40% annualized is calm for one instrument and a crisis for another, and calm over a week can be extreme over six months.
Finds the classical formations automatically — ascending, descending and symmetrical triangles, rising and falling wedges, channels, rectangles and broadening formations — and draws each one with the swing pivots that define it plus its measured-move target. Scans several pivot depths at once, so a two-week flag and a six-month triangle both surface. Heuristic pattern recognition: structure to confirm, not a signal to trade.
A golden-ratio spiral anchored on the chart’s major pivot, projecting the apex of each turn as a price target. Ours is computed from the data rather than drawn over the screen, so your targets stay put when you zoom — the usual version’s move every time you resize. Classical geometry; we show it because traders ask for it, not because we have measured an edge in it.
Put them on your charts
Start free with the standard studies, then unlock the AI-native suite when you’re ready.