ADMA— AI Stock Forecast & Price Targets
Published 7/1/2026 · A free sample of K3vl4r’s AI-powered analysis.
Kronos price forecasts, scored fundamentals & technicals, and a multi-horizon plan.
View the live ADMA price forecast →
ADMA Biologics trades at $8.68 with strong operational fundamentals (43% ROE, 32% net margin, $55M Q1 FCF) but is under a heavy overhang from a June 2026 securities lawsuit alleging revenue inflation, which has driven a -52% YTD decline from the $20.46 52-week high. Forward P/E of 8.5 and PEG of 0.29 look cheap on paper, but legal risk and a pending Aug 5 earnings print make this a HOLD with tactical accumulation zones near $7.20-$8.00 support.
1-4 week view: HOLD/small tactical long only. Price is consolidating in the $8.30-$8.90 zone with the Aug 5 earnings print ~35 days out — this is a binary event and I would NOT size a swing into it. A break and hold above $9.10 opens a run at $10.25; failure at $8.10 support risks a retest of $7.21. Sizing: no more than 1/3 of intended position; keep dry powder for post-earnings clarity. Invalidation: close below $7.75 on volume, or any adverse lawsuit development.
1-6 month view: The earnings print will set the tone. If Q2 2026 confirms continued margin expansion and management provides credible commentary on the lawsuit, a mean-reversion to the $11-$12.50 zone is plausible (25-45% return). If the print disappoints or legal disclosures worsen, $7 breaks and we're in the $5-$6 zone. Base case: range-bound $8-$11 with mid-single-digit total return. Change of mind: lawsuit settlement announcement (upside) or SEC formal inquiry disclosure (downside).
1-3 year view: If the lawsuit resolves without material restatement and ASCENIV continues gaining share in the PI market, ADMA's forward P/E of 8.5 and PEG of 0.29 imply meaningful re-rating potential toward $14-$18. The pipeline (S. pneumonia immunoglobulin) is optionality, not core thesis. Structural risk: plasma-derived therapeutics face competitive pressure from recombinant alternatives and pricing scrutiny; the debt-to-equity confusion in the data warrants deeper diligence — if the higher figure is correct, deleveraging becomes the dominant capital allocation priority.
Operating fundamentals remain robust: Q1 2026 revenue of $114.5M with 70.5% gross margin (up from 55% in Q2 2025) and 44% operating margin shows continued mix shift toward higher-margin ASCENIV. TTM revenue of $509.9M, net income of $165M, and ROE of 43.3% are genuinely impressive for a mid-cap biotech. Cash flow is real — $55.7M FCF in Q1 2026 alone, with $138M cash on the balance sheet against $204M total debt (though the reported debt-to-equity of 110x in one data source vs. 0.52 in another is a red flag suggesting either data noise or a recent balance sheet event worth scrutinizing). Current ratio of 6.95 and quick ratio of 3.93 indicate ample near-term liquidity. The concern: Q1 2026 revenue of $114M was down sequentially from Q4 2025's $139M, and the securities lawsuit alleges prior revenue inflation, which if substantiated could force restatements. EPS Y/Y TTM is -20.9% and EPS/sales surprise was -11.7%/-18.2%, so recent execution has disappointed even before legal issues surfaced.
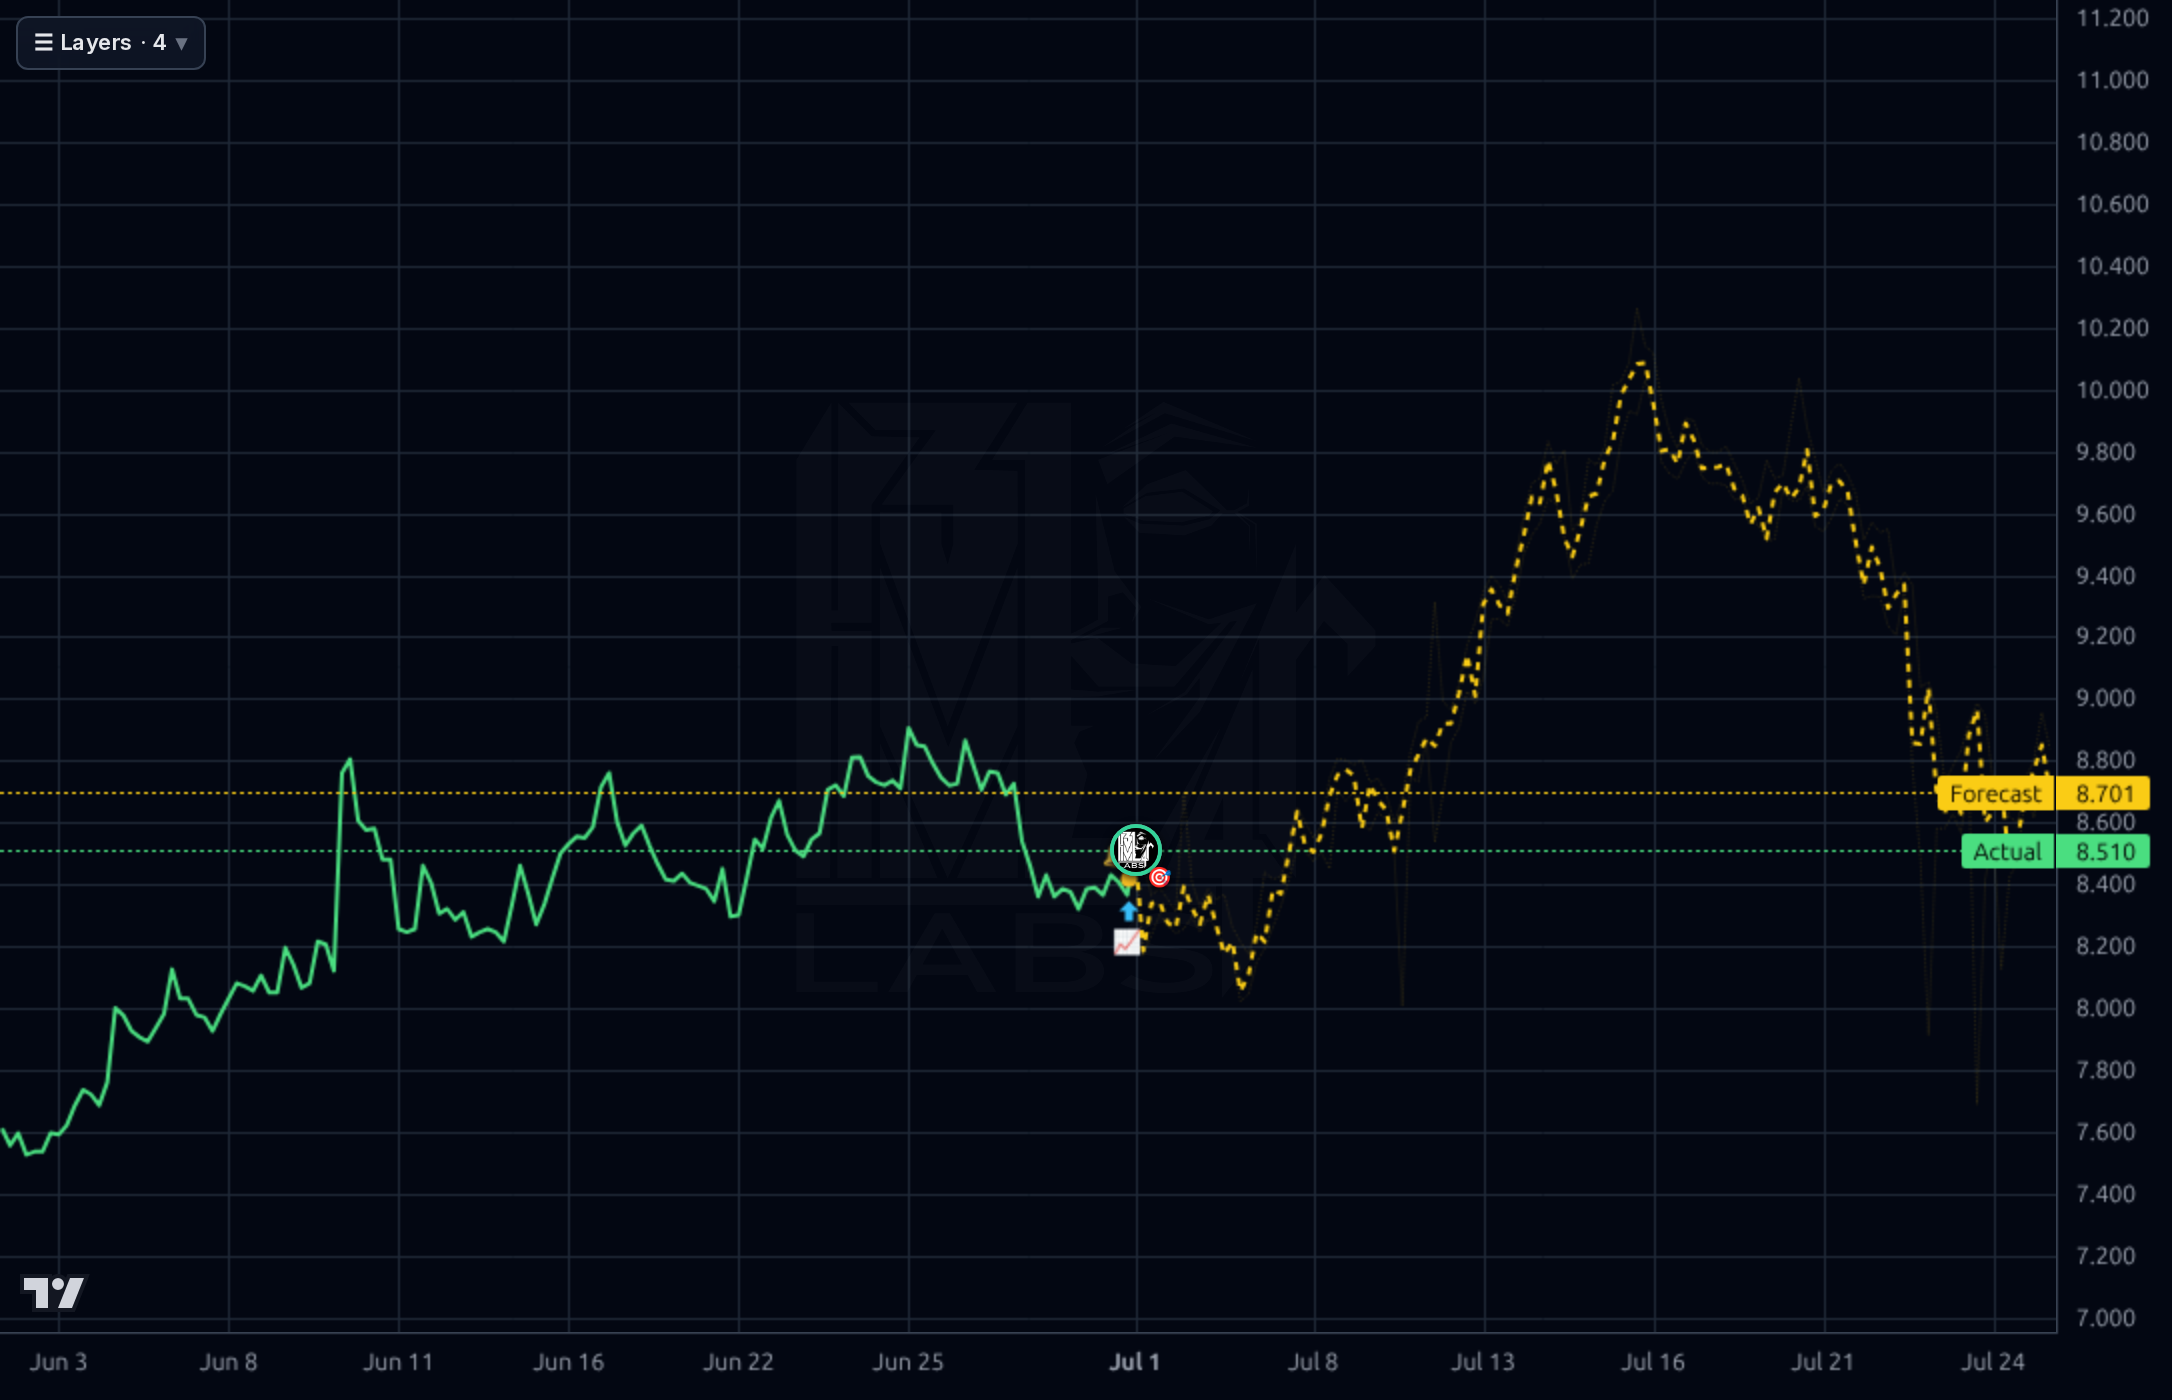
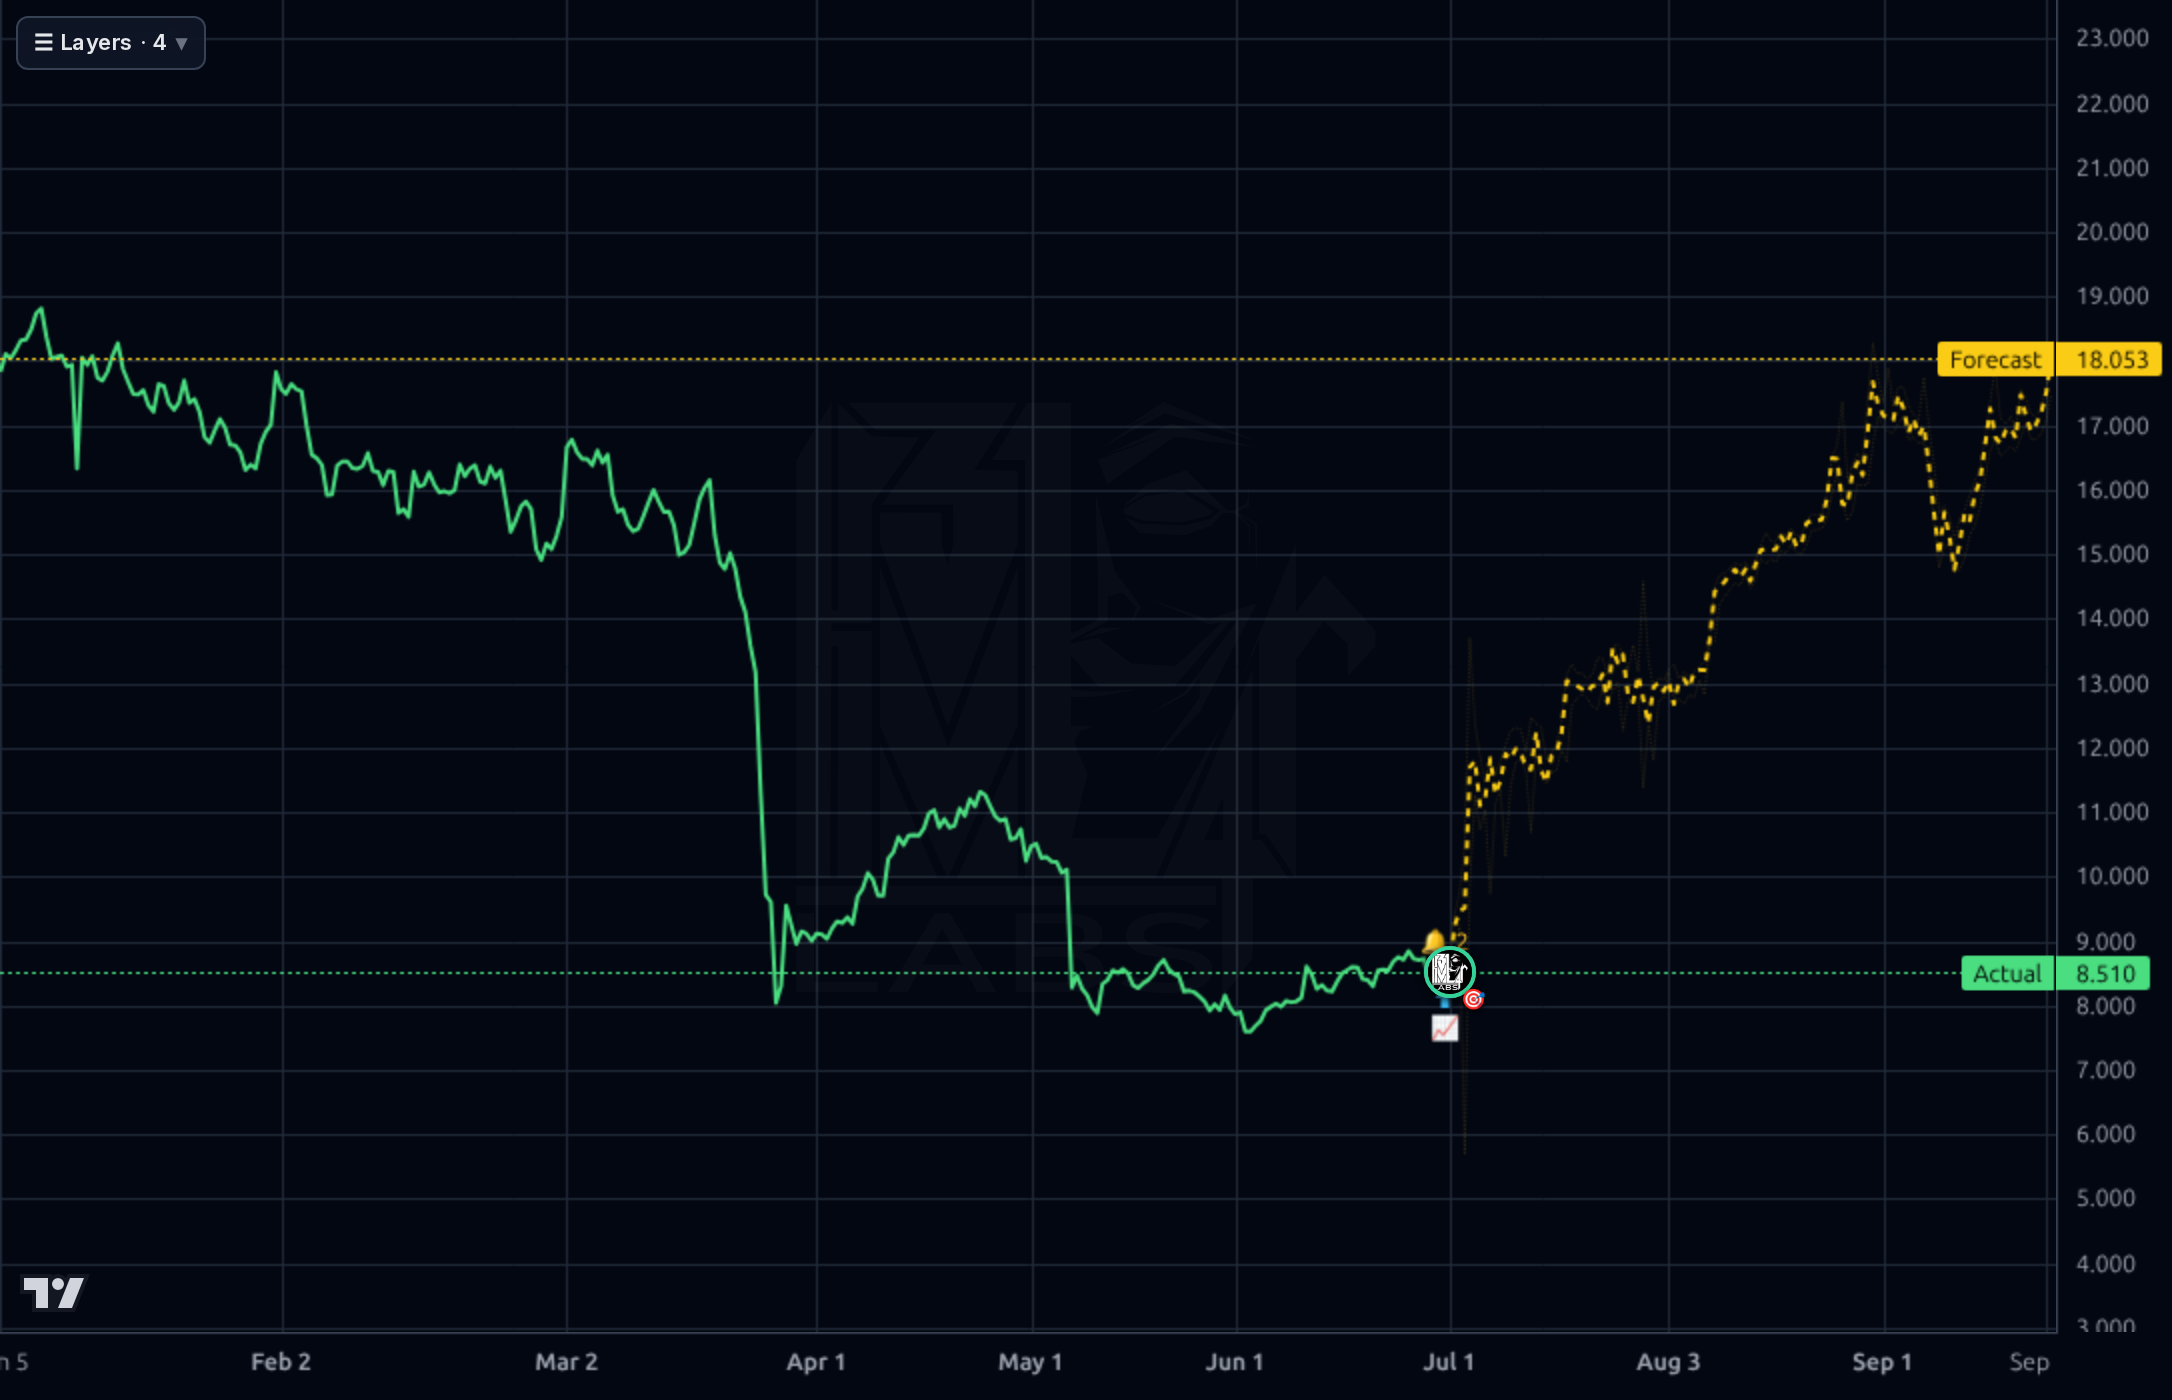
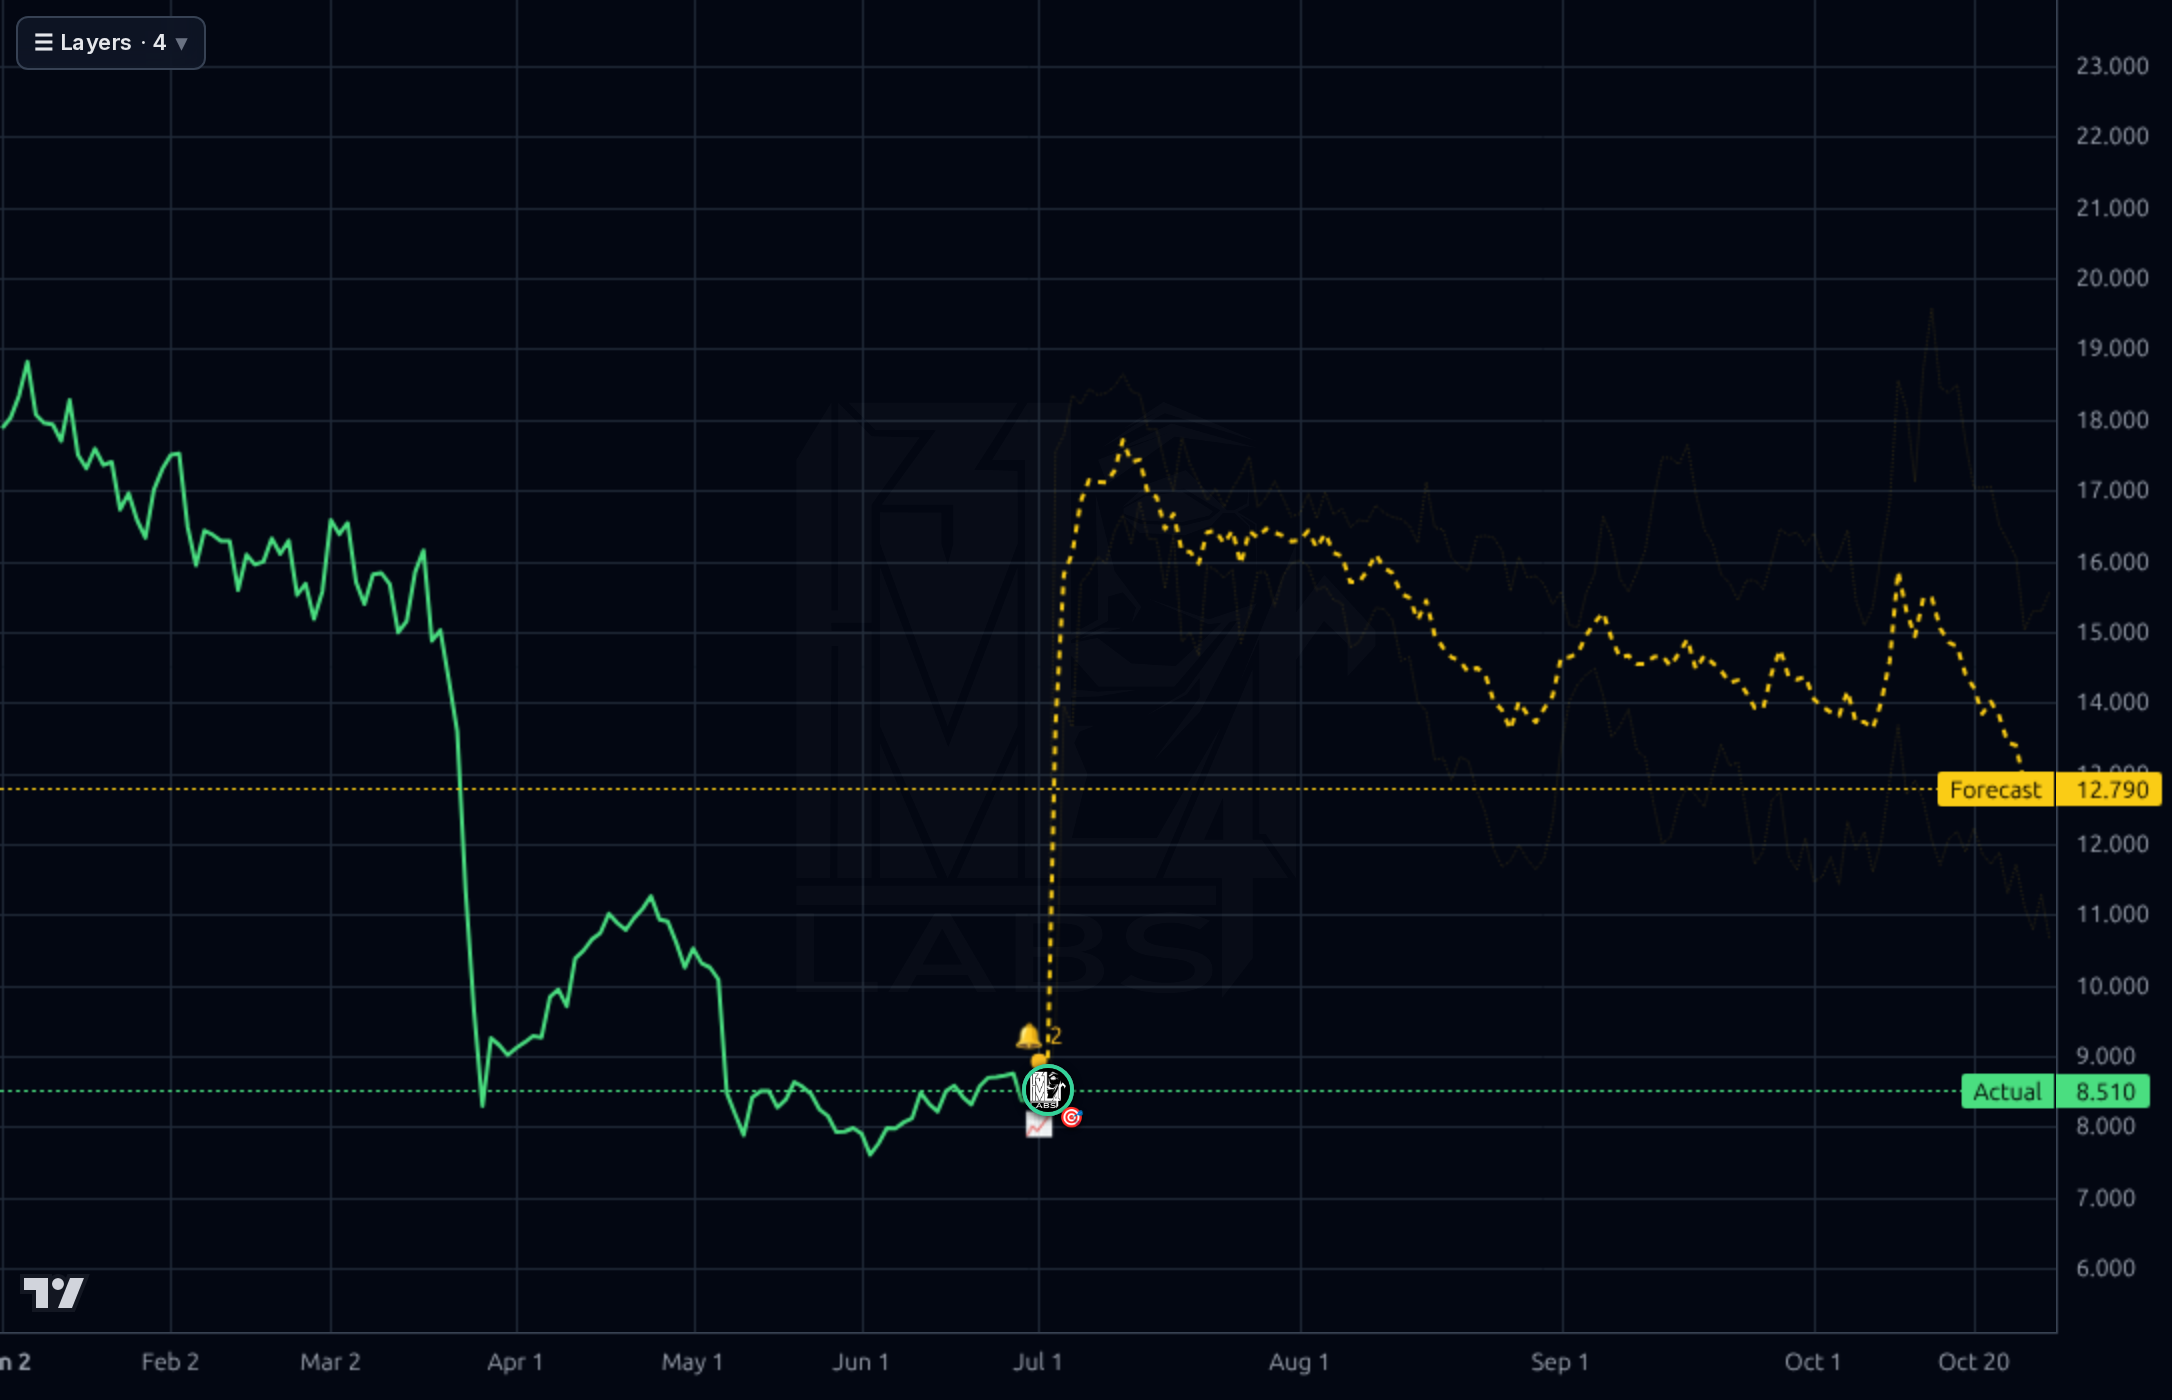
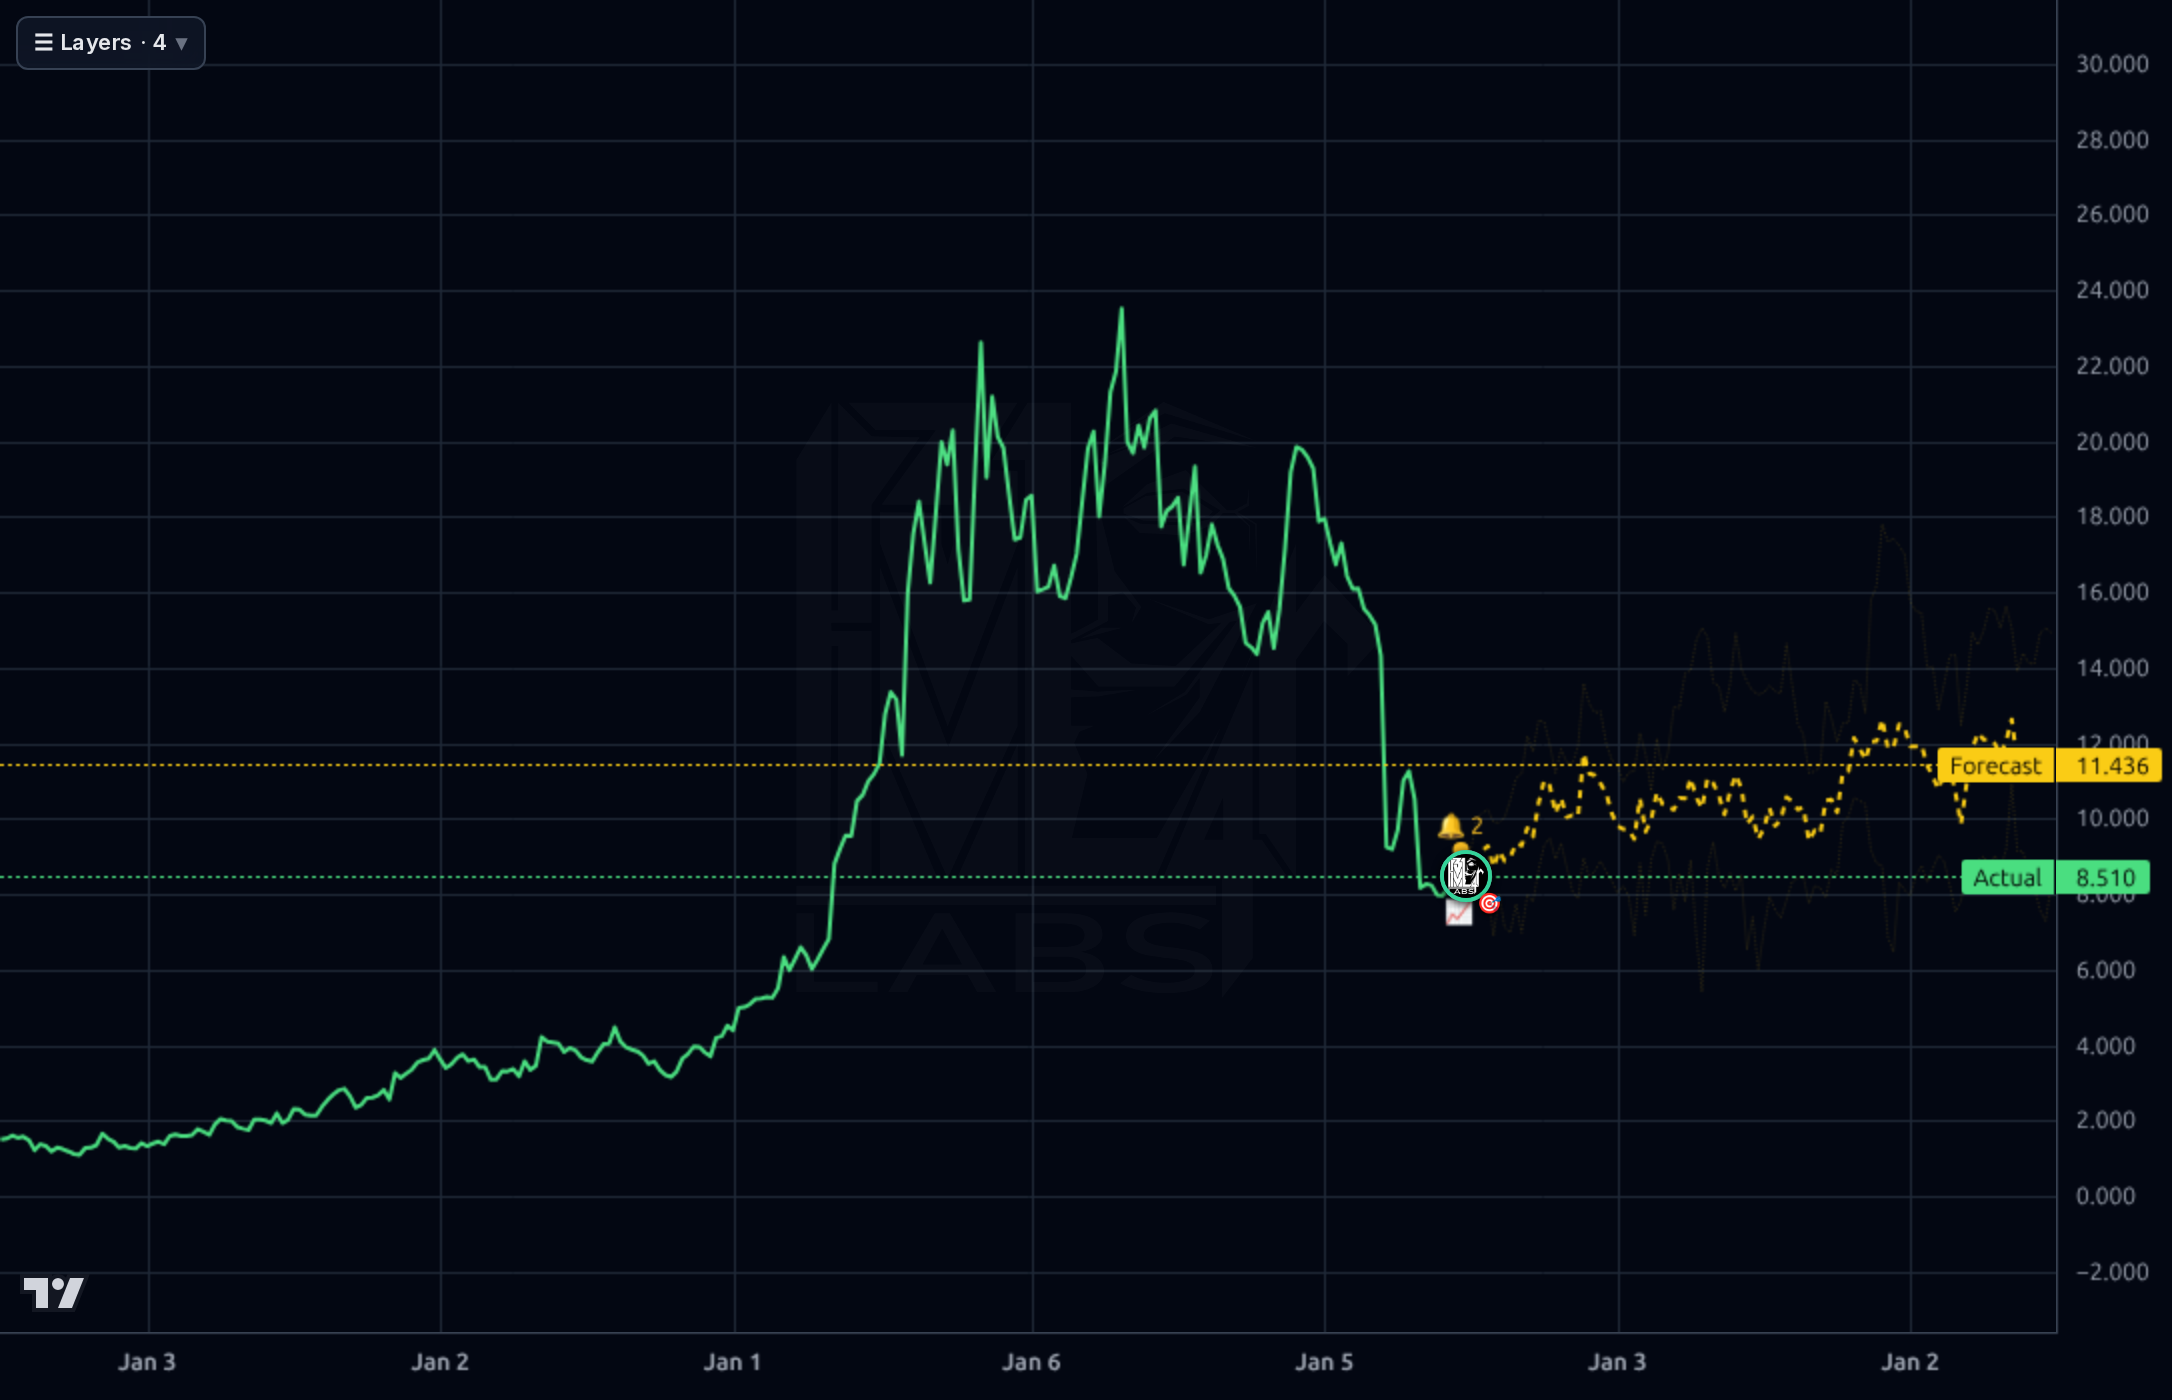
The technical picture is broken. The weekly chart shows a full round trip from ~$24 highs down to $8.51, giving back nearly all of the 2024-2025 rally. Daily chart shows price consolidating in an $8-$9 zone after the March-April 2026 gap-down from ~$16 to ~$8 (the lawsuit catalyst). SMA200 is -38% above price, confirming a firmly established downtrend, though SMA20 (+3%) and SMA50 (-2.7%) suggest short-term stabilization. RSI at 51.7 is neutral. The 1h chart shows constructive base-building with a rally from $7.60 to $8.85 into early July. The Kronos forecast bands are notably bullish across all timeframes (1d forecast $8.70, 4h $18.05, 1d $12.79, weekly $11.44), but 4h/daily forecasts have MAPE ~59% for daily and directional accuracy just at baseline, so I discount the aggressive upside. Key support: $8.00-$8.10 (recent floor), then $7.21 (52wk low). Resistance stack: $9.00, $10.25 (April bounce high), then $13.55 (pre-crash consolidation).
The dominant signal is the June 2026 federal securities lawsuit alleging revenue inflation — this is the single most important overhang and explains the -52% YTD drawdown. Offsetting this is Raymond James resuming coverage (June 10) and a 121% upside call implied by the $17.75 consensus target, indicating sell-side still sees fundamental value once legal fog clears. Recent daily action articles are noise (small moves, standard Zacks reports). The MarketBeat catalyst piece flags ADMA as one of three biotechs with major upcoming catalysts, which aligns with the Aug 5 earnings print being the next binary event.
- ASCENIV IVIG continues driving mix shift — Q1 2026 gross margin of 70.5% vs. 55% in Q2 2025 shows the product's premium pricing flowing through
- S. pneumonia hyperimmune globulin pipeline addresses significant unmet need in immunocompromised populations
- Plasma collection center expansion supports vertical integration and supply security for BIVIGAM/ASCENIV
- Raymond James resumption of coverage (June 2026) with implied 121% upside suggests renewed institutional attention
- Q1 2026 FCF of $55.7M annualized supports self-funded growth without additional dilution
- Pending federal securities lawsuit alleging revenue inflation — could force restatements or trigger SEC action
- Aug 5 2026 earnings is a binary catalyst; recent EPS/sales surprises of -11.7%/-18.2% show execution has slipped
- Q1 2026 revenue of $114.5M is down sequentially from Q4 2025's $139M — need to confirm this isn't a trend
- Short interest at 9.45% of float with 3.97-day cover indicates meaningful bearish positioning
- Debt-to-equity data conflict in sources (0.52 vs. 110.67x) requires clarification; if higher figure is right, financial risk is severe
- -38% below SMA200 confirms a broken long-term technical structure; retail sentiment at 86% bullish is a contrarian caution flag
- Institutional transactions -4.52% shows smart money reducing exposure
Get AI analysis on any stock
This is one of hundreds of Kronos AI reports — scored fundamentals & technicals, bull/base/bear price targets, a multi-horizon plan, and continuously-updated forecasts across the market. Create a free account to explore them all.
Create your free account →Already a member? Sign in · Join our Discord