APTV — AI Stock Forecast & Price Targets
Published 7/10/2026 · A free sample of K3vl4r’s AI-powered analysis.
Kronos price forecasts, scored fundamentals & technicals, and a multi-horizon plan.
View the live APTV price forecast →
APTV trades at $58.85 with weak momentum (-13.6% month, -14.5% half-year) as Q1 2026 earnings showed sequential margin compression and a shocking swing to negative free cash flow (-$362M vs +$651M prior quarter). The stock screens cheap on forward P/E (8.8x) with strong analyst support (Recom 1.17, target $78) and a strategic robotics/AI narrative, but the deteriorating cash generation, high leverage (D/E 1.07), and looming August 4 earnings print argue for patience over aggression.



HOLD/sidelined into the August 4 earnings print — this is a binary event that will define the next leg. The stock is in a technical downtrend below all key moving averages with a full bearish stack, and the Q1 negative FCF surprise raises the risk of another disappointing print. For those already long, tighten risk below $56; invalidation is a break of $54 which opens $51.68 retest. Do NOT initiate new swing longs into the print. If forced to trade, wait for either (a) an earnings gap-and-hold above $62.50 for continuation to $65-68, or (b) a post-print washout to $52-54 for a bounce trade toward $58.
1-6 month view is HOLD with an accumulate bias on weakness. Forward P/E of 8.8x and PEG of 1.57 are attractive IF the implied EPS recovery to ~$6.79 materializes, but the Q1 margin compression and cash burn create genuine doubt. Base case return range: -10% to +25% depending on Q2 print. Catalysts: Aug 4 earnings (margin recovery, FCF normalization, guidance), any concrete monetization datapoint from robotics partnerships, and macro auto-cycle signals. Change my mind: two consecutive quarters of positive FCF and operating margins reclaiming 10%+ would justify a full BUY; another quarter of negative FCF would flip this to TRIM/SELL.
1-3 year terminal thesis is cautiously constructive. APTV owns valuable positioning in vehicle electrification, ADAS, and connected-vehicle software — secular tailwinds that should support mid-single-digit revenue growth and margin recovery back toward 12-13% operating margin as auto production normalizes and content-per-vehicle expands. The robotics/AI optionality is real but unquantified. Fair value in a normalized-earnings scenario is $85-100 (12-13x $7-8 forward EPS). Biggest structural risks: (1) auto-cycle downturn compressing volumes just as debt matures, (2) Chinese EV competitors bypassing tier-1 suppliers, (3) failure to translate software/AI narrative into actual margin-accretive revenue. The multi-year chart shows the market has been unwilling to re-rate this name — that skepticism must be earned back with execution.
Revenue is stable but unspectacular — Q1 2026 revenue of $5.09B is down slightly from $5.15B in Q4 2025 and $5.21B in Q3 2025, showing the top line has plateaued around $20.7B TTM (Sales Y/Y TTM +5.2%). Margin trajectory is deteriorating: Q1 2026 gross margin dropped to 18.1% from 18.7% in Q4 and 19.5% in Q3, operating margin compressed to 8.65% from 10.3% earlier. Most alarming is the cash flow reversal — Q1 2026 delivered NEGATIVE operating cash flow of -$143M and negative FCF of -$362M, a stark break from the $441M-$651M FCF prints in prior quarters. Balance sheet is stretched: total debt swelled from $8.09B (Q4 2025) to $9.89B (Q1 2026), driving D/E to 1.07x, though the $3.17B cash position and 2.11x current ratio provide near-term liquidity buffer. ROE of 4.0% and ROA of 1.5% are weak for an industrial. The valuation dichotomy is striking — trailing P/E of 35.6x reflects depressed TTM EPS ($1.68), while forward P/E of 8.8x and PEG of 1.57 imply the market expects material earnings recovery. Institutional ownership at 99.2% signals crowding.
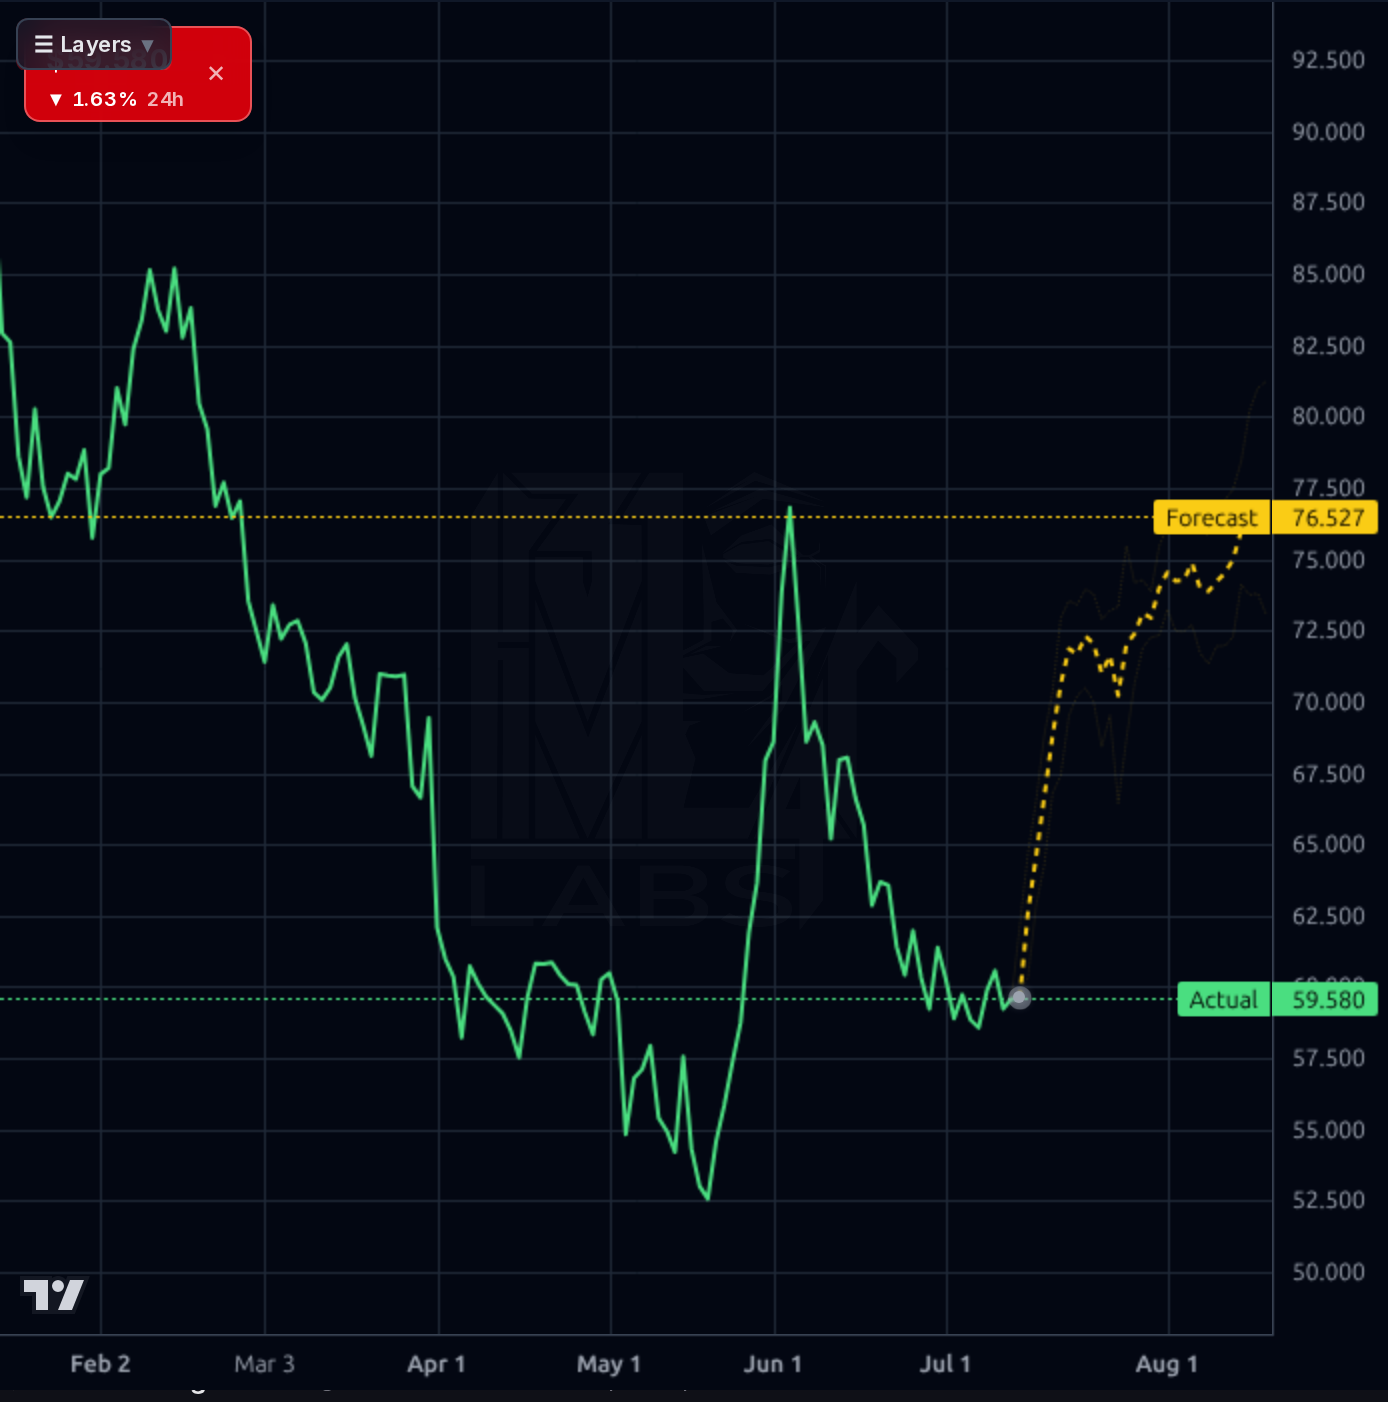
Across all four timeframes the picture is bearish-to-neutral. The 1D and 4H charts show a stock that gapped down hard in early Q3 2025 (from mid-$70s to low $50s), then base-built through July with a modest recovery attempt to $59.86 — still 23.7% below the 52-week high of $78.49 and only 15.8% above the $51.68 low. Price sits below SMA20 (-3.8%), SMA50 (-2.5%), and SMA200 (-7.8%), a full bearish stack. RSI at 45 is neutral, giving no oversold bounce setup. The weekly chart shows the multi-year downtrend from the $170s remains intact despite the recent basing. The AI forecast band ($65-$90 on various horizons) implies significant upside, but the model's realized directional accuracy on this name is 12-17% versus a naive baseline of 83-88% — the forecast has been systematically wrong and should be heavily discounted. Immediate resistance sits at $62.50 (recent range highs and the failed call strike region) and then the $65-68 gap zone; support is $56-57 then the $51.68 52-week low.
[Correction: 8 recent article(s) were provided — see the news.] News flow is a mixed bag dominated by day-to-day price commentary rather than fundamental catalysts. Deutsche Bank reiterated Buy and raised its target to $75 from $74 — a modestly supportive datapoint consistent with the consensus $78.05 target and 1.17 Recom score. The Q2 2026 earnings date is confirmed for August 4 pre-market, which is the pivotal near-term catalyst. Zacks pieces flag high investor search interest, indicating the name is on radar but with uncertain direction. There is no news in this batch specifically advancing the robotics/Robust.AI narrative that anchored prior bullish theses — meaning the strategic story has not been reinforced by fresh signal in the past week.
- Monetization progression of the Robust.AI robotics partnership integration — remains the primary strategic optionality but needs concrete revenue milestones
- Advanced Safety and User Experience segment scaling with ADAS content-per-vehicle expansion as OEMs adopt Aptiv's compute platforms
- Engineered Components margin expansion via the ongoing manufacturing footprint optimization referenced in prior quarterly disclosures
- Forward EPS estimate of $6.79 (vs $1.68 TTM) implies management expects material earnings recovery through 2026-2027 — execution against this is the key growth vector
- Analyst target hikes (Deutsche Bank $74→$75, consensus $78.05) suggest sell-side sees a re-rating path if margins stabilize
- Q1 2026 free cash flow swung to -$362M from +$651M in Q4 2025 — if this pattern repeats in Q2, the balance sheet thesis breaks down given $9.89B total debt
- Total debt increased $1.79B quarter-over-quarter (Q4 2025 $8.09B → Q1 2026 $9.89B), pushing D/E to 1.07x and raising refinancing/interest expense concerns
- Operating margin compression from 10.3% (mid-2025) to 8.65% (Q1 2026) signals either pricing pressure or cost inflation not being passed through
- Model forecast reliability on this name is very poor (12-17% directional accuracy vs 83-88% naive baseline) — bullish AI signals cannot be trusted here
- August 4 earnings is a binary catalyst with elevated risk given deteriorating Q1 metrics; another miss likely retests $51.68 52-week low
- Stock is in a confirmed downtrend across SMA20/50/200 with -13.6% 1-month performance and -54.6% 5-year performance — chart offers no support to buyers
- 99.2% institutional ownership creates crowding risk — any sell-side downgrade or negative print could trigger amplified outflows
Get AI analysis on any stock
This is one of hundreds of Kronos AI reports — scored fundamentals & technicals, bull/base/bear price targets, a multi-horizon plan, and continuously-updated forecasts across the market. Create a free account to explore them all.
Create your free account →Already a member? Sign in · Join our Discord