APTV — AI Stock Forecast & Price Targets
Published 8/5/2026 · A free sample of K3vl4r’s AI-powered analysis.
Kronos price forecasts, scored fundamentals & technicals, and a multi-horizon plan.
View the live APTV price forecast →
APTV gapped down ~17% post-Q2 earnings to $47.72 after cutting full-year guidance on China weakness and delayed program launches, breaking multi-year support near $52 and printing fresh 52-week lows. The stock now screens optically cheap (7.2x fwd P/E, 0.49x P/S, P/B 1.10) with strong analyst backing (Recom 1.26, target $72.74), but the guide-down validates the structural deterioration flagged by the Q1 FCF collapse — a knife catch until FCF and China stabilize. Prior bullish targets on this name have systematically failed to print; discount upside and respect the trend.
Do not chase the knife. RSI 26.8 and a -20% weekly move argue for a mean-reversion bounce toward $52 gap-fill, but the trend is decisively down and the model's near-term forecast has been directionally wrong 78% of the time on this ticker. If already long, hold and consider trimming into any rally to $52–$54. No new longs without a daily close back above $52 on volume, which would signal the earnings gap is being repaired. Invalidation for any tactical long: close below $46.00.
Hold/neutral bias over 1–6 months. The guide-down likely resets consensus estimates lower over the next 2–4 weeks, creating estimate-revision headwinds into the October 29 print. Base case: rangebound $46–$58 as the market digests China exposure and awaits Q3 FCF confirmation. Expected return range: -10% to +20%. Thesis would flip constructive on: (1) a Q3 FCF print that clearly reverses the Q1 collapse, (2) tangible China stabilization commentary, or (3) concrete revenue timelines from the robotics/AI partnerships. Thesis worsens on: further debt increase, another margin step-down, or a break of $46.
The 1–3 year setup is a classic deep-value auto-parts turnaround with optionality on AI/robotics diversification. At 0.49x P/S, 1.10x P/B, and 7.2x forward P/E, downside is arguably priced in if the business is merely cyclical rather than structurally impaired. The bull case requires: sustained FCF recovery ($1B+ annually), operating margins back above 10%, and at least one commercially meaningful non-auto revenue stream. The biggest structural risk is that the auto-parts industry itself is in secular decline as EV transitions compress content-per-vehicle economics for legacy suppliers, and $9.89B of debt leaves little margin for further operational stumbles or refinancing at higher rates. Terminal value hinges on management execution — until proven, this is a show-me story.
Revenue trend is flattening at best — TTM $20.66B with Q1 2026 at $5.09B, down sequentially from $5.15B and $5.21B in prior quarters, and management just lowered full-year guidance citing weaker China auto production and program-launch delays. Margins are compressing: gross margin slipped from 19.5% (Q3'25) to 18.1% (Q1'26), operating margin from 10.3% to 8.65%, and TTM net margin sits at just 1.77%. The most alarming line item remains the Q1 2026 free cash flow swing to -$362M from +$651M the prior quarter, driven partly by a $1.79B QoQ jump in total debt to $9.89B (D/E 1.07x, EV/EBITDA 5.78x). The $3.17B cash cushion and 2.11x current ratio provide runway, and TTM FCF is still positive at $1.09B, but ROE of 4.0% and ROIC of 1.93% are well below cost of capital. Forward P/E of 7.2x and P/B of 1.10 look cheap only if you believe the $6.76 forward EPS — a number the guidance cut just made harder to trust.
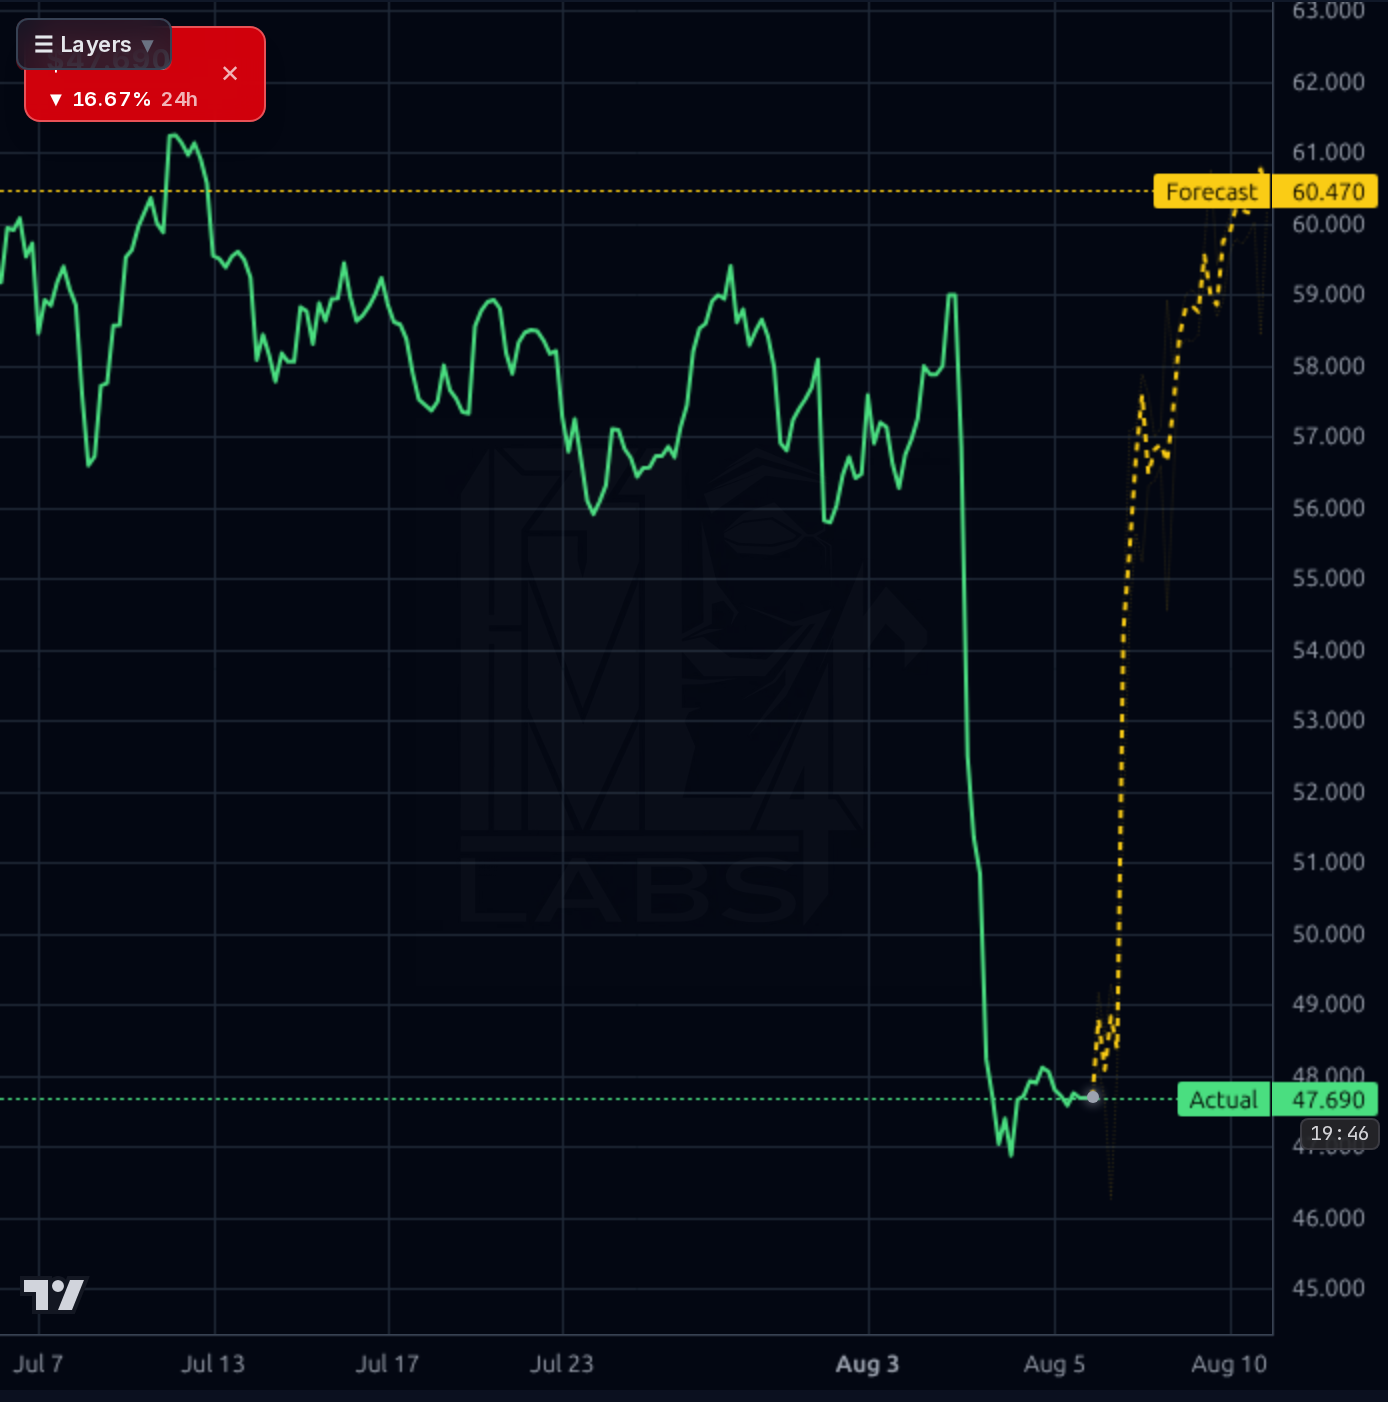
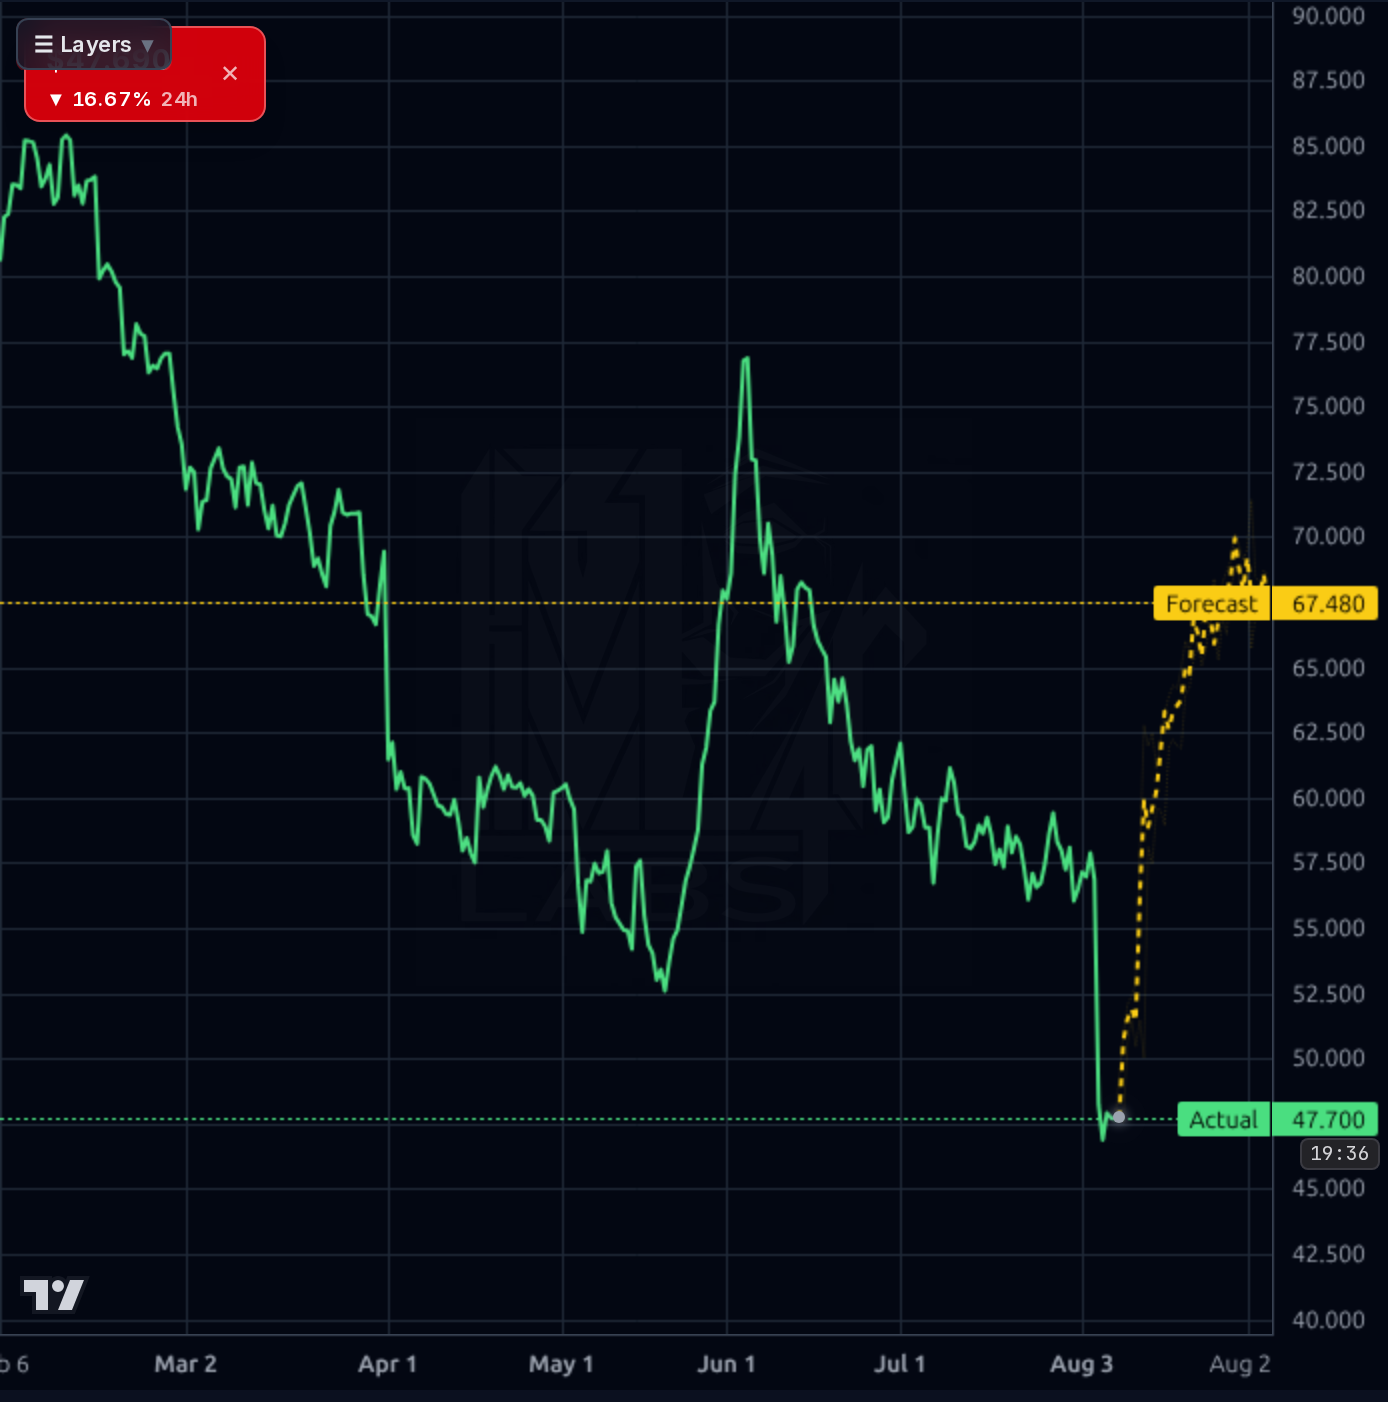
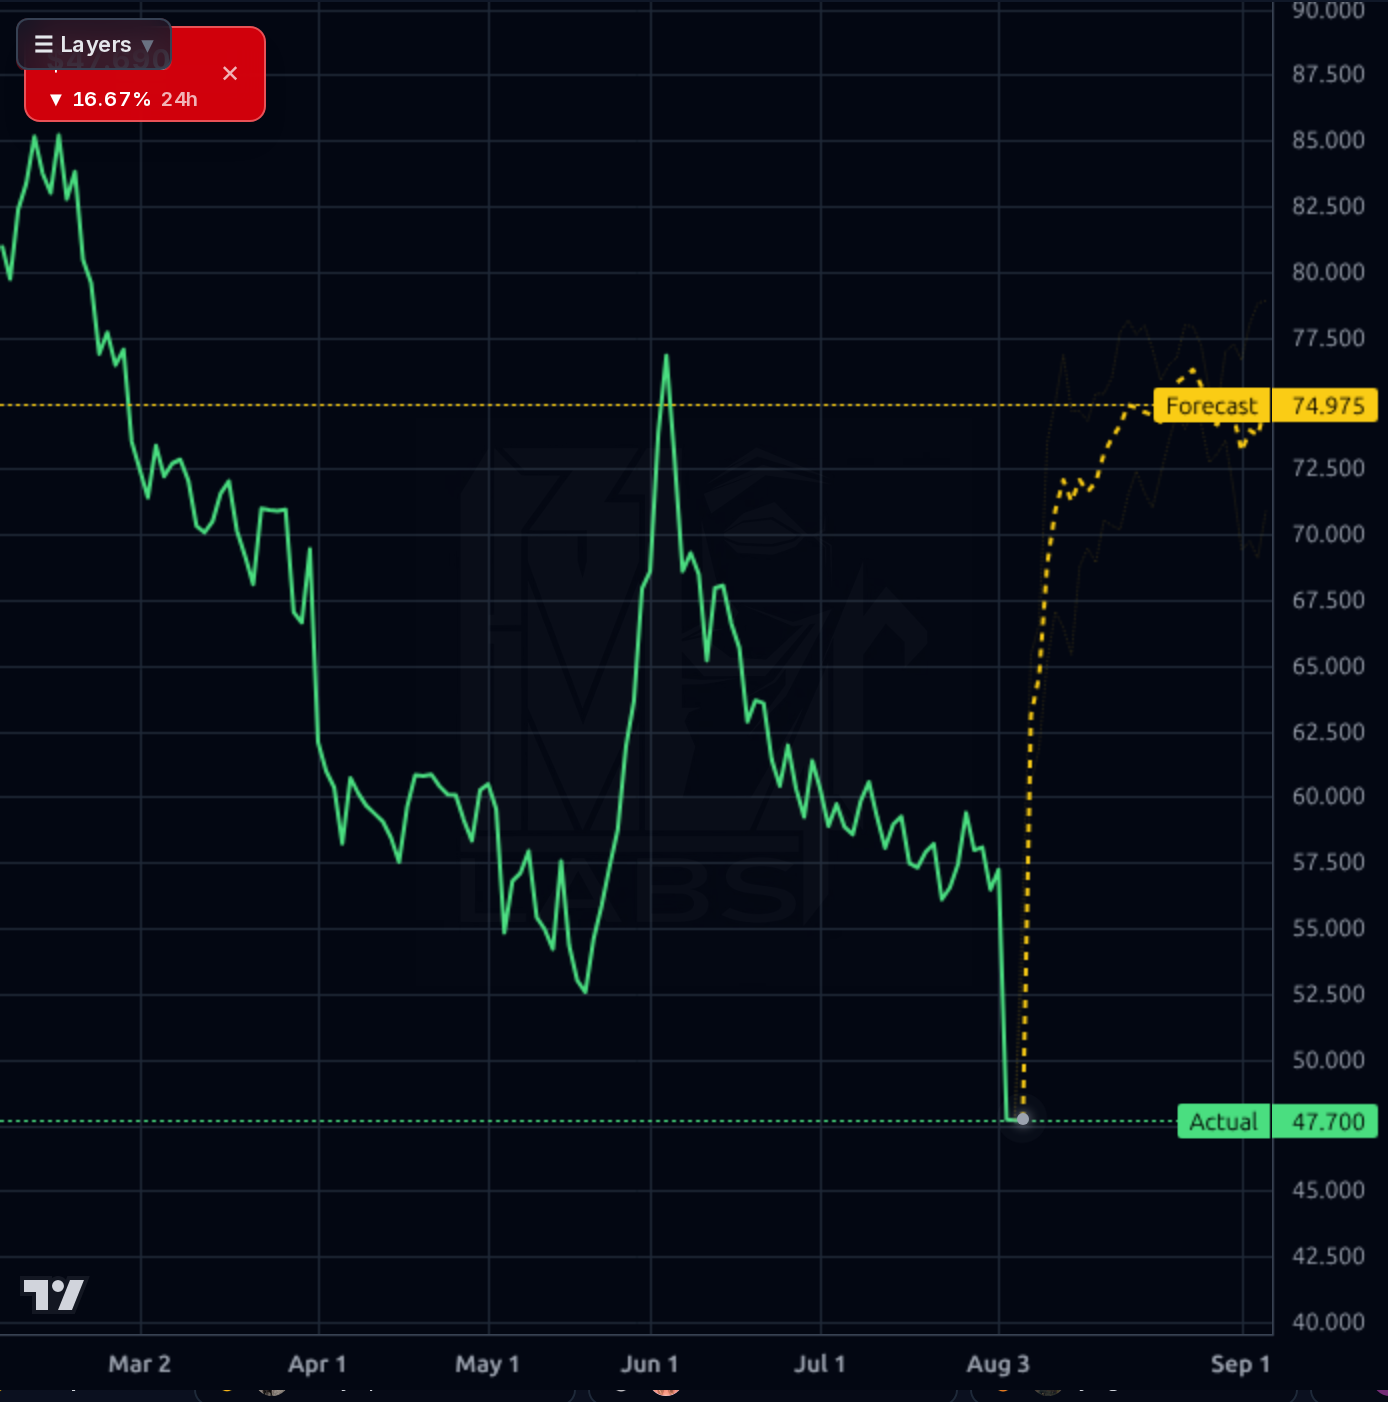
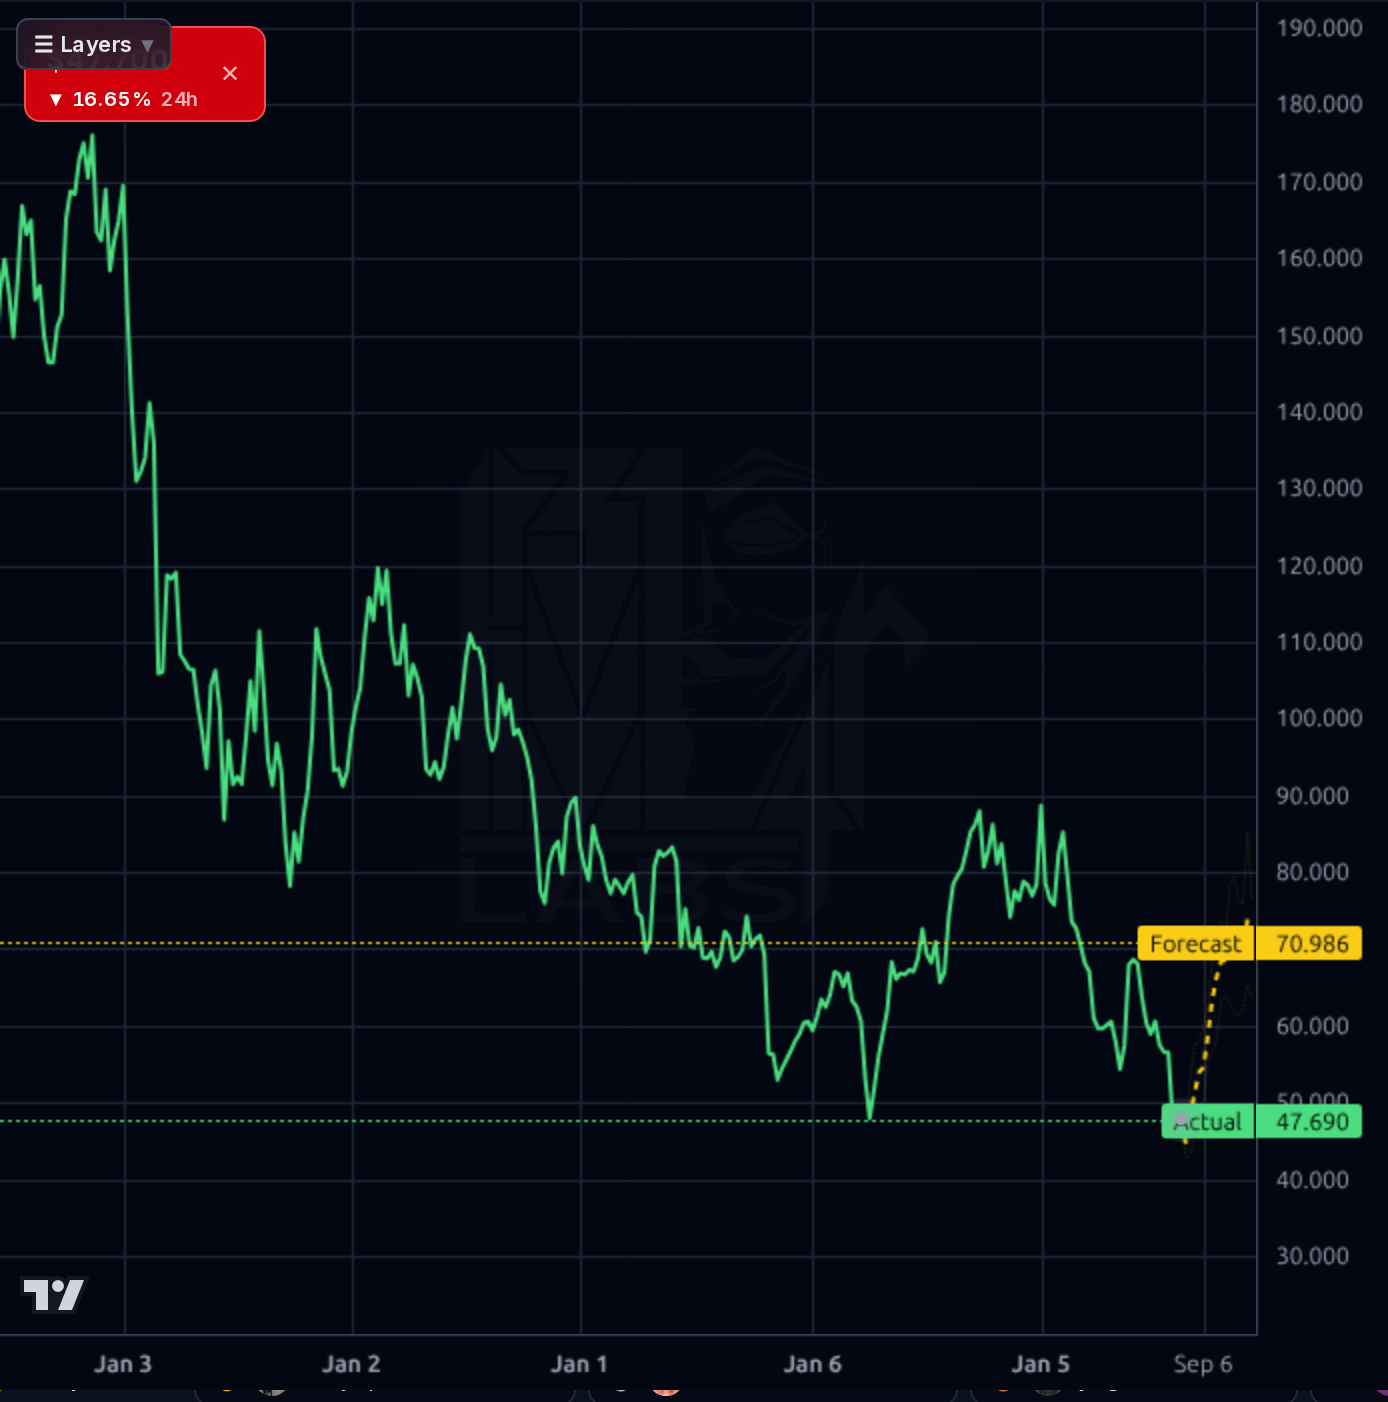
The tape is broken across every timeframe. The 1h chart shows a violent capitulation from ~$59 to $47 on the earnings gap; the 4h chart confirms this broke the prior $52.50 May low and the entire April–August base; the daily shows a clean vertical breakdown to fresh 52-week lows ($46.42); and the weekly shows price now down 66% over 5 years and testing the lower boundary of a multi-year descending channel. RSI(14) at 26.8 is deeply oversold and SMA20/50/200 distances of -17%/-23%/-25% indicate an extreme dislocation — a bounce is statistically likely, but every prior 'oversold bounce' setup on this name has failed. The model's forecast bands project a rebound to $60–$75 across timeframes, but the historical directional accuracy on this ticker is 22% at 1d and 0% at 1wk versus a naive baseline of 78%/100% — the model has been consistently wrong on direction here, so these upside projections carry no weight. Key resistance: $52 (broken support becomes resistance), then $57–$58 (gap fill zone). Support: $46.40 (52wk low), then air pocket to $42.50.
The dominant news is the August 4 Q2 earnings print (SEC 8-K Item 2.02) and the accompanying guide-down: Aptiv reported 2% adjusted revenue growth and 10bps of EBITDA margin expansion but lowered full-year outlook citing weaker China auto production schedules and delayed program launches. Management secured $5B in new business awards, which is the one genuine positive, but the market clearly focused on the guidance reset — hence the -16.6% single-day move. Simply Wall St's follow-up piece framing the stock as potentially undervalued after the 66.8% five-year decline is a fair valuation observation but not a catalyst. CNBC's ticker mention that 'Aptiv was looking to diversify away from the auto business' underscores that the strategic pivot narrative (robotics/AI partnerships) is still the bull case, but zero concrete revenue milestones from those partnerships were disclosed. The sell-side price target was cut from $77.58 to $72.74 (-6.2%), and while institutional ownership ticked up 3.2pp to 103%, that likely reflects short covering flow rather than genuine accumulation given the 5.59% short float.
- $5B in new business awards secured in Q2 2026, per management commentary on the earnings call — provides multi-year backlog visibility if program launches actually convert on schedule
- Robust.AI robotics partnership integration referenced in prior news cycle — remains narrative-only until revenue milestones are disclosed
- Advanced Safety and User Experience segment scaling with ADAS content-per-vehicle expansion on OEM platforms
- Diversification away from pure-auto exposure noted by CNBC coverage — strategic pivot toward industrial/robotics adjacencies
- Forward EPS estimate of $6.76 implies significant earnings recovery from TTM $1.69 if executed — creates re-rating optionality at 7.2x forward P/E
- Q2 guide-down on China weakness and program delays validates structural (not transitory) demand concerns
- Q1 2026 FCF collapse (-$362M) combined with $1.79B QoQ debt increase raises balance sheet quality concerns
- Operating margin compression from 10.3% to 8.65% signals persistent pricing/cost pressure
- $9.89B total debt (D/E 1.07x) creates refinancing risk in higher-for-longer rate environment
- Stock broke multi-year support at $52 on volume — technical damage will take months to repair
- Model forecasts show 22% directional accuracy (below 78% naive baseline) — quantitative bullish signal is unreliable in this regime
- Prior sell-side and internal price targets have systematically overshot realized moves on this name
- Secular EV transition compresses legacy auto-parts content economics
- Retail crowd 100% bullish per social sentiment — contrarian warning sign near local lows
Get AI analysis on any stock
This is one of hundreds of Kronos AI reports — scored fundamentals & technicals, bull/base/bear price targets, a multi-horizon plan, and continuously-updated forecasts across the market. Create a free account to explore them all.
Create your free account →Already a member? Sign in · Join our Discord