ARRY — AI Stock Forecast & Price Targets
Published 7/29/2026 · A free sample of K3vl4r’s AI-powered analysis.
Kronos price forecasts, scored fundamentals & technicals, and a multi-horizon plan.
View the live ARRY price forecast →
Array Technologies is a highly leveraged solar-tracker turnaround trading at $5.10, just below its prior $5.25 52-week low, with a binary Q2 earnings print in ~7 days that will determine whether Q1's tentative 28.2% gross margin recovery is durable or a head-fake. Negative OCF (-$29M in Q1), D/E of 2.85x, negative book value (-$1.39/sh), and a fresh $203M AWM acquisition overhang leave essentially no cushion; the technical setup is deeply oversold (RSI 28, -58% from 52w high) but oversold does not equal safe into a binary catalyst.
Do not add into the August 5 print. Stance: reduce/avoid pre-earnings. For an existing holder, trim size ahead of the binary; the setup (fresh 52-week low, negative OCF quarter, dilution overhang, forecast models unreliable) is not one to double down on with a catalyst 7 days out. Key levels: bounce resistance $5.50-$6.00, breakdown extension $4.75-$4.25 if the print disappoints on cash flow or H2 guide. Invalidation for any tactical long: sustained close below $5.00 with heavy volume. Do not size a swing trade into the print.
1-6 month view is bimodal around Aug 5. A print that shows (a) sustained 26-28% gross margin, (b) return to positive operating cash flow, and (c) credible H2 revenue ramp toward the $1.45B/$215M EBITDA guide could re-rate the stock into the $6.50-$7.50 zone; miss on any of those three and the stock likely tests $4.25 and the AWM funding structure becomes a forced-issuance overhang. Base case: choppy consolidation between $4.50 and $6.25 as H2 backlog conversion is proved out quarter by quarter. What would change my mind bullishly: a Q2 print with positive OCF AND a specific H2 revenue bridge tied to named backlog conversion.
1-3 year terminal thesis rests on whether ARRY can convert its $2.4B orderbook into $1.4B+ annual revenue at durable 25%+ gross margins while deleveraging from 2.85x D/E — a plausible but not proved outcome. If DuraTrack HZ v3 volume ramps in H2 and SmarTrack software attach improves mix, EBITDA could scale toward $200M+ and the stock has 2-3x upside from here. The biggest structural risk is not competitive (Nextracker) but capital-structure: with negative book value and a $203M M&A funding gap, one more operational stumble forces equity issuance at depressed prices, permanently impairing the per-share thesis. Solar-tracker end demand is also IRA-policy dependent, adding a political-regime tail risk that a domestic-focused company cannot hedge.
Revenue trajectory is the most alarming line: quarterly revenue has collapsed from $393M (Q3'25) to $226M (Q4'25) to $223M (Q1'26), a -43% peak-to-trough sequential decline, which makes the reaffirmed FY26 $1.45B/$215M EBITDA guide look aspirational and heavily H2-loaded. Gross margin did recover to 28.2% in Q1'26 from 8.6% in Q4'25, and Q1 posted a small net income of $2M, but operating cash flow flipped to -$29M vs +$44M the prior quarter — headline profit without cash conversion. Balance sheet is fragile: $200M cash against $763M total debt, D/E 2.85x, book value negative at -$1.39/sh, and a June 30 shelf plus the $203M AWM acquisition create real dilution/leverage risk. TTM profit margin -10.6%, ROE -22.6%. The $2.4B orderbook and 2x book-to-bill are the bull anchor, but conversion into revenue has not shown up yet in the numbers.
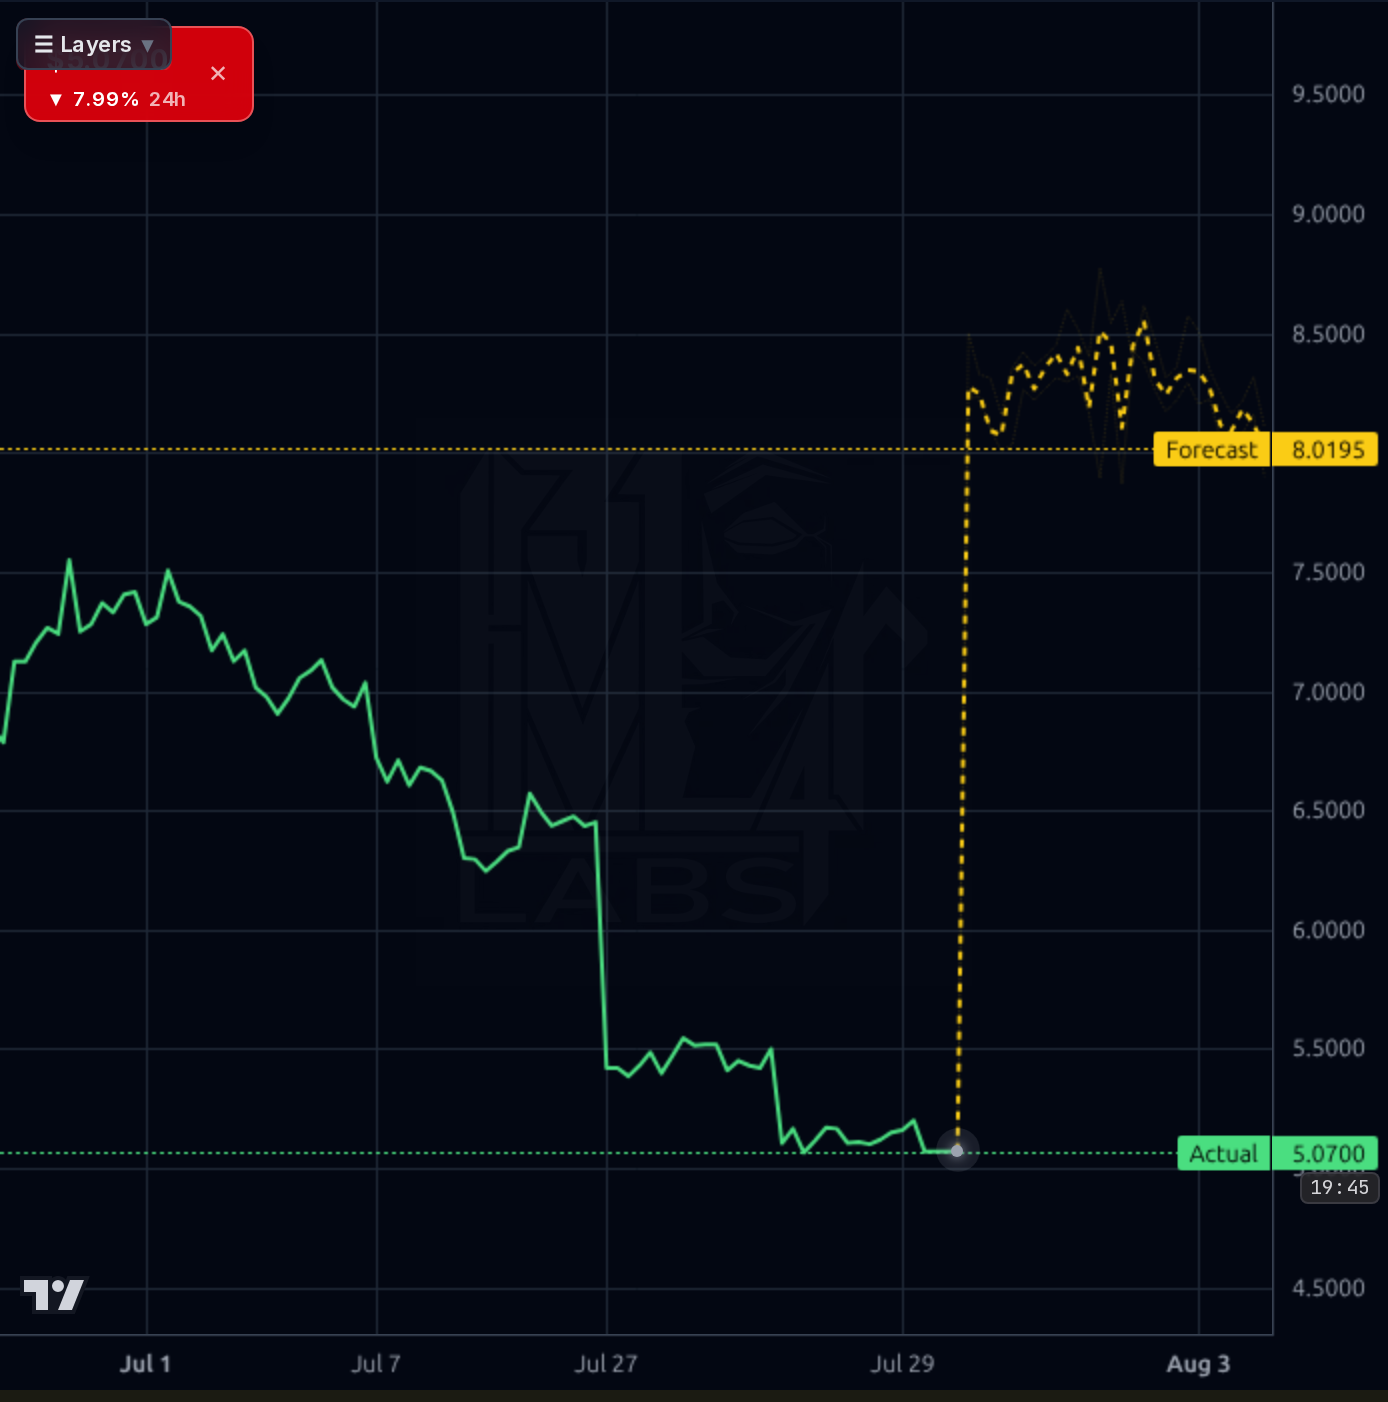
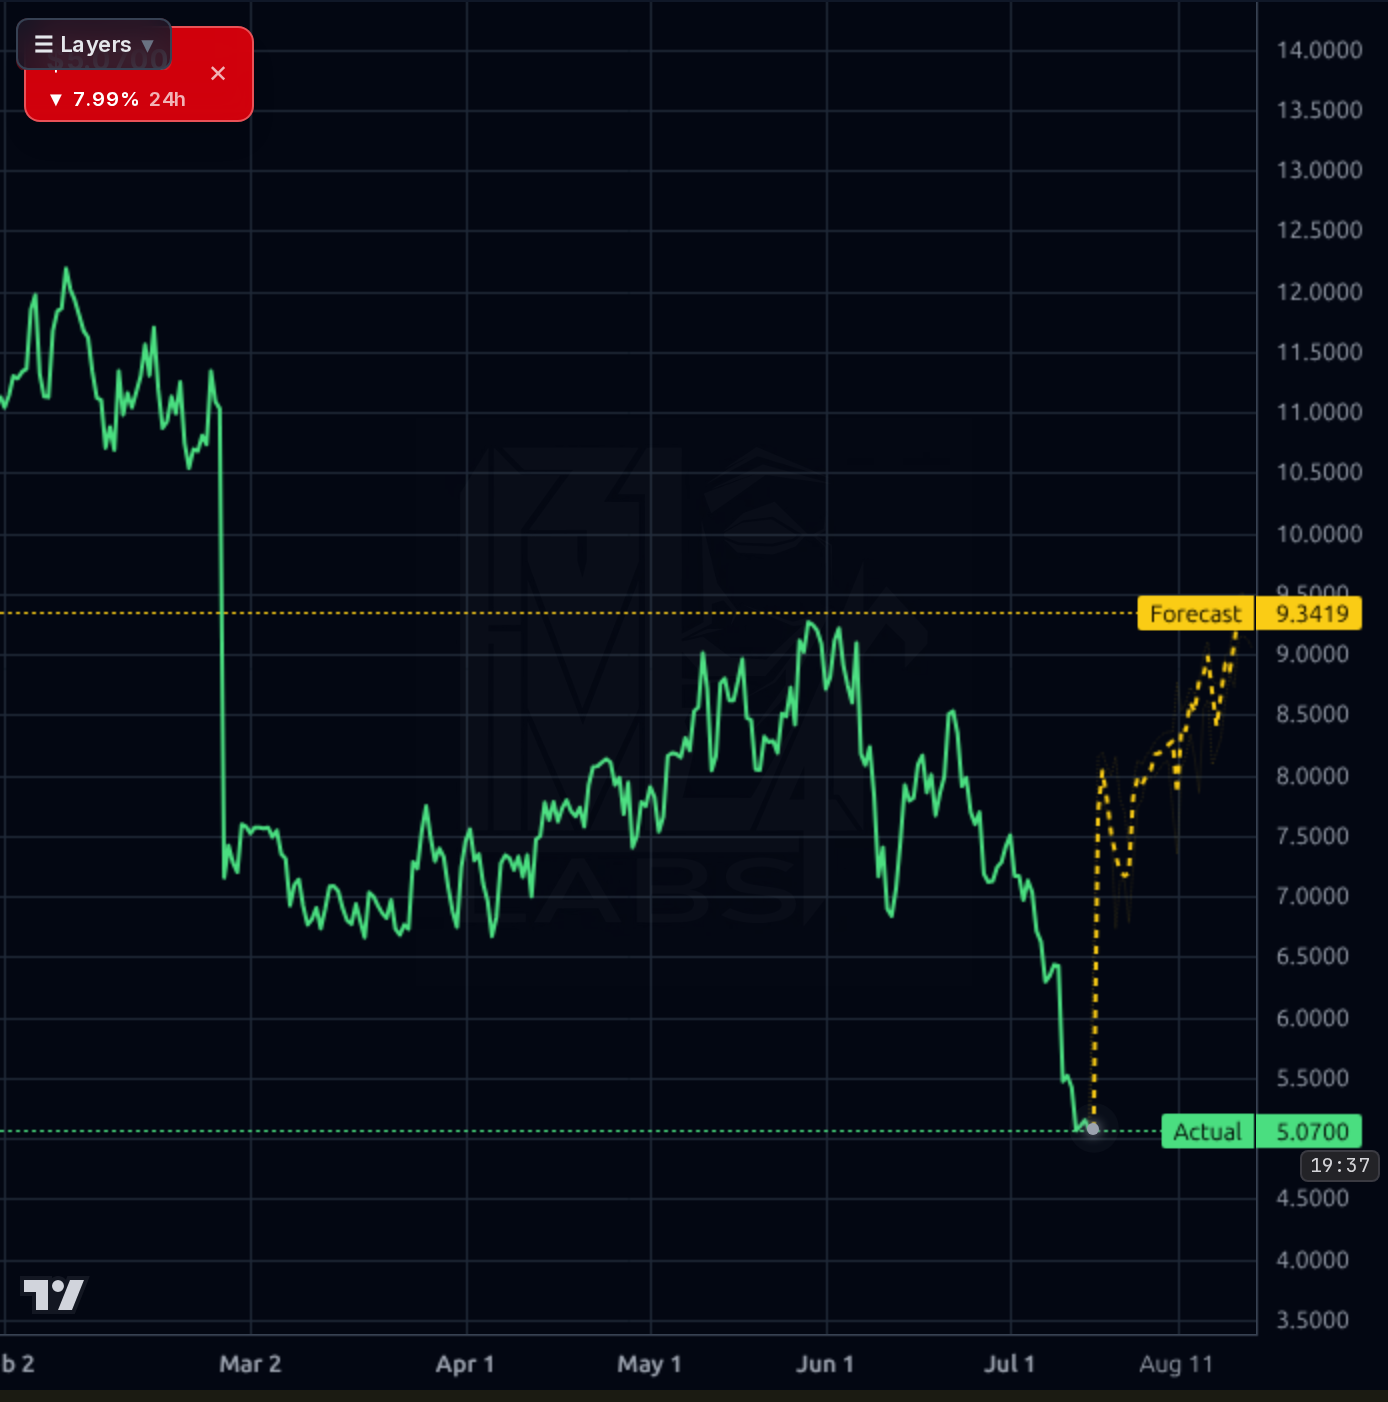
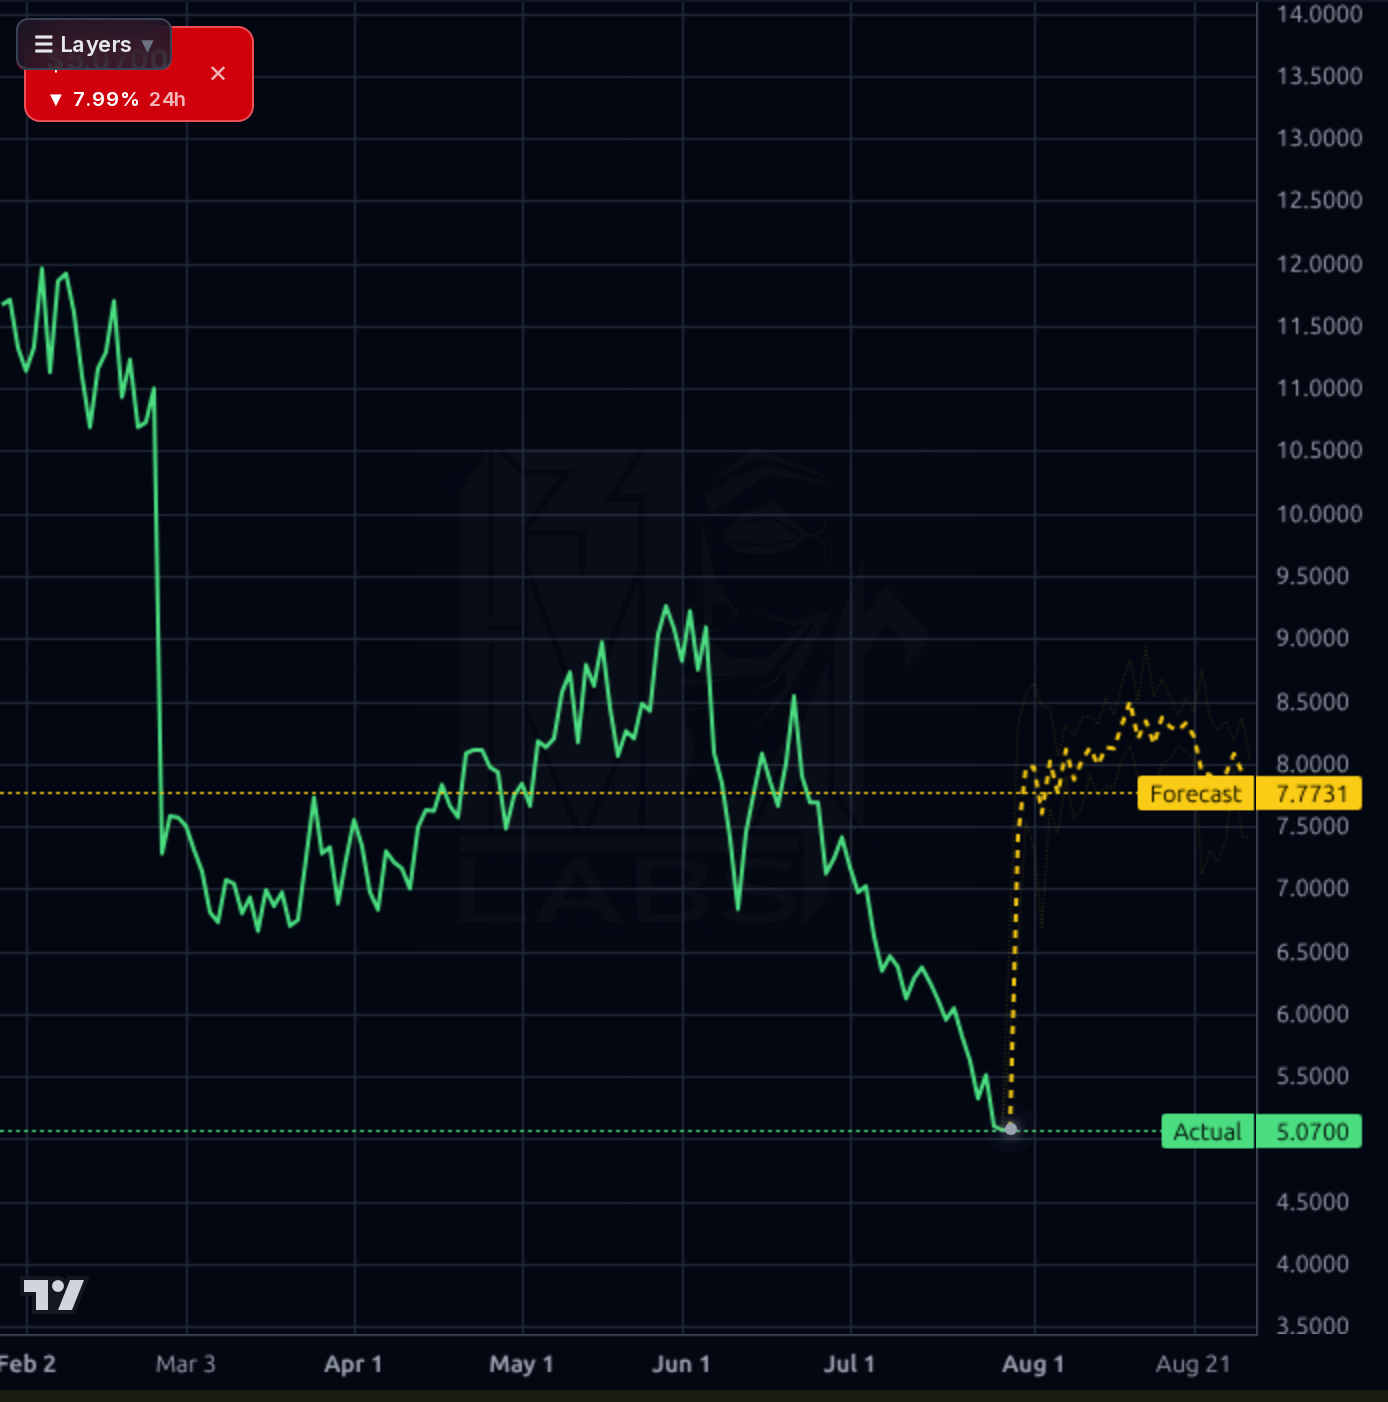
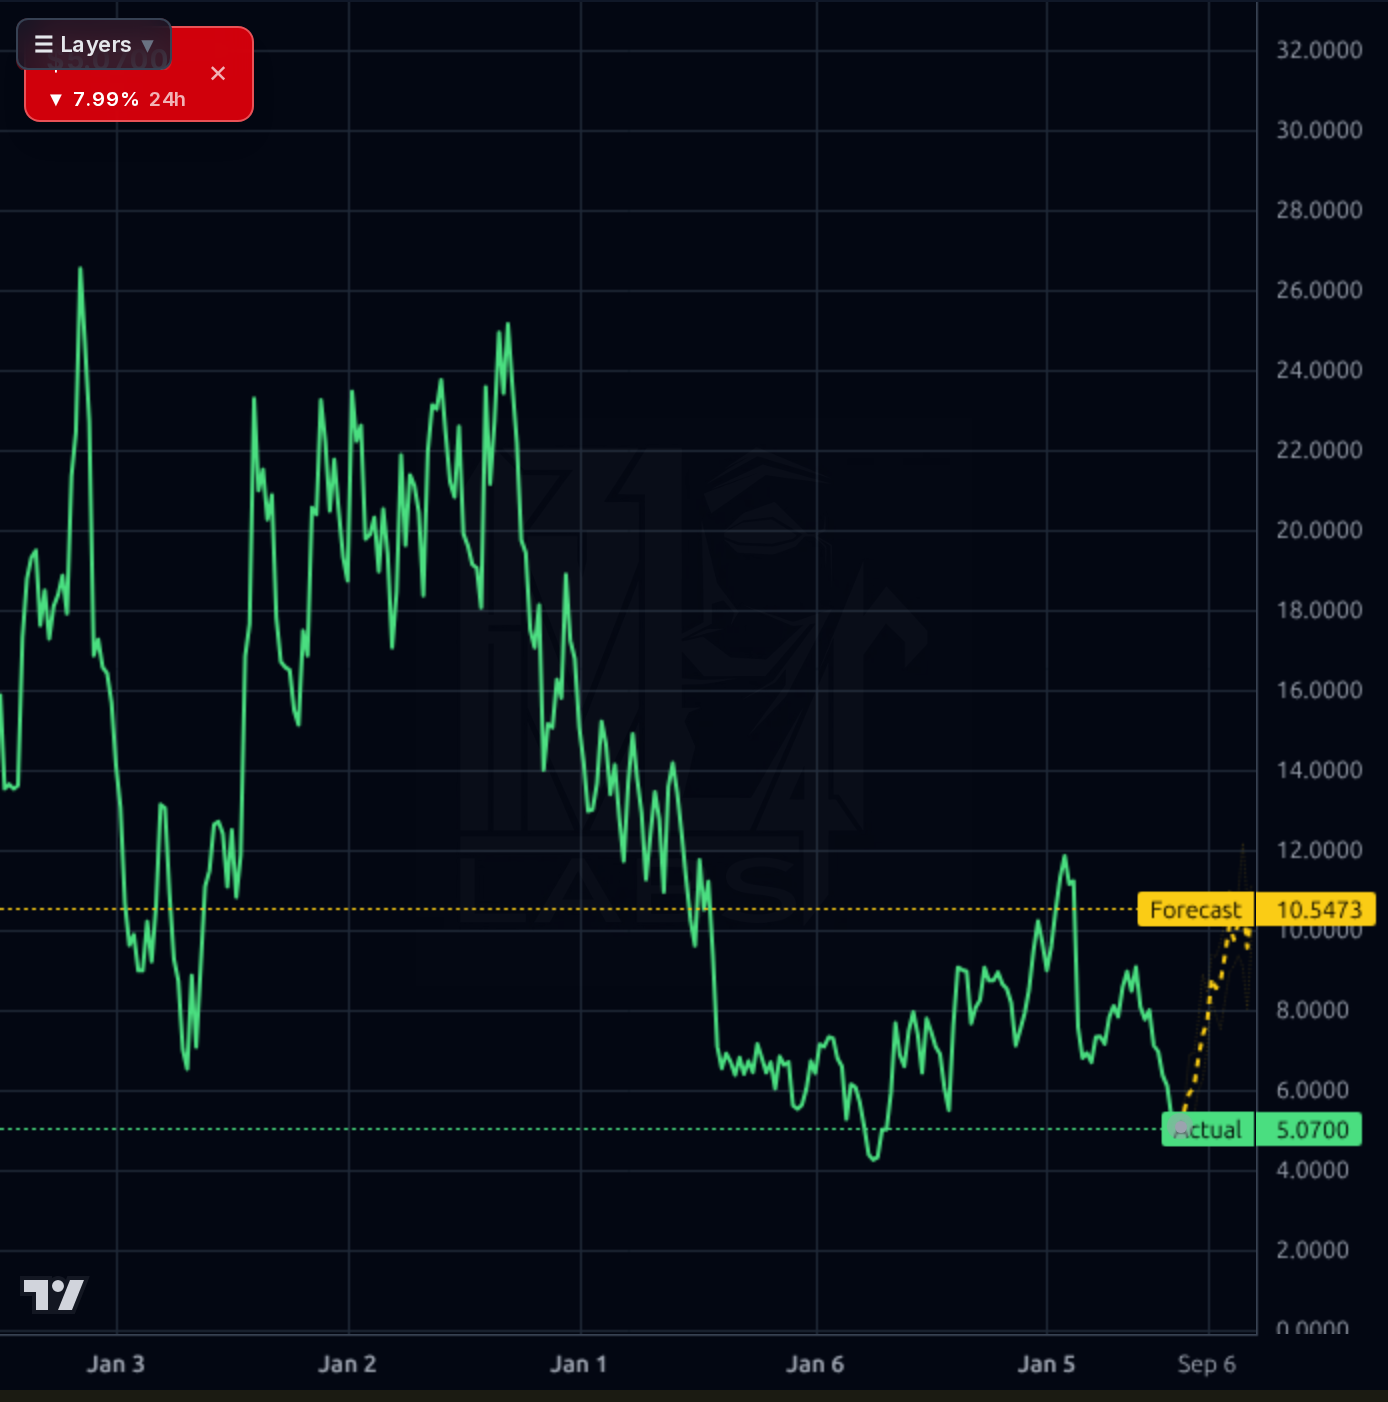
All four timeframes point the same direction: down and getting worse. On the weekly, ARRY is in a multi-year downtrend from $26 (2022) to current $5.10, with the recent break of $5.39 opening air toward the $4-5 zone. Daily shows a decisive breakdown from the $6.50 shelf that held through mid-July, accelerating on the AWM/dilution news to a fresh low. 1h chart shows capitulation into $5.07 with no reversal signal yet. Price is -18% below SMA20, -31% below SMA50, -39% below SMA200 — extended and oversold (RSI 28.05), which invites reflex bounces but not trend reversal. The model's forecast band ($8+ on 1h, $9.34 on 4h, $10.55 on weekly) should be heavily discounted: realized directional accuracy is 7% at 1d and 0% at 1wk, worse than a naive baseline — the model is systematically wrong on this name in this regime. Analyst mean target $9.82 has the same optimism problem as the model. Key levels: support $5.00 (psychological) then open air to $4.25; resistance $5.50 then $6.00, with $6.50 being the breakdown shelf that would need to reclaim to change the tone.
The dominant signal is the July 16 8-K disclosing a $203M acquisition of Affordable Wire Management — a strategic TAM expansion into utility wire management with cross-sell into the installed tracker base, but funding structure (cash, debt, or equity off the June 30 shelf) is unresolved and the market has treated it as incrementally dilutive/leverage-negative given the balance sheet starting point. JP Morgan downgrade to Neutral with an $8 PT on July 21 aligns with a broader sell-side reset. Zacks flagged the stock as oversold on July 24 (-26.9% in four weeks), which has since gotten worse, consistent with the lesson that sell-side capitulation on this name coincides with further downside rather than preceding a bottom. The single most important news item is not out yet: August 5 Q2 earnings, which is the true binary.
- August 5 Q2'26 print: gross margin sustainability at 26-28% and OCF inflection are the primary re-rating triggers
- $203M AWM acquisition integration — utility wire-management cross-sell into installed tracker base extends TAM
- DuraTrack HZ v3 volume ramp in H2 2026 (per company commentary) driving international mix
- $2.4B orderbook conversion — 2x book-to-bill at March 31 provides visibility if H2 shipments materialize
- DuraTrack D2S launched June 16, 2026 broadens product portfolio into dual-row terrain applications
- August 20 APA Investor Technology Showcase — incremental pipeline/product catalysts
- Binary August 5 earnings print with essentially no balance-sheet cushion for another OCF miss
- D/E 2.85x and negative book value (-$1.39/sh) — capital structure is the single-point-of-failure risk
- Q1'26 OCF of -$29M reversed +$44M prior quarter; cash quality trumps headline EPS on this name
- AWM $203M funding path plus June 30 shelf creates concrete dilution/leverage overhang
- Sequential revenue collapse from $393M to $223M challenges FY26 $1.45B guide credibility
- 20.4% short float / 5.13 days-to-cover — squeeze risk cuts both ways but reflects entrenched bearish thesis
- IRA policy dependence and Nextracker pricing competition constrain sustainable margin recovery
- Model forecast bands (bull $8+) have been directionally wrong on this name — 0-7% accuracy vs 93-100% naive baseline
Get AI analysis on any stock
This is one of hundreds of Kronos AI reports — scored fundamentals & technicals, bull/base/bear price targets, a multi-horizon plan, and continuously-updated forecasts across the market. Create a free account to explore them all.
Create your free account →Already a member? Sign in · Join our Discord