ARRY — AI Stock Forecast & Price Targets
Published 7/24/2026 · A free sample of K3vl4r’s AI-powered analysis.
Kronos price forecasts, scored fundamentals & technicals, and a multi-horizon plan.
View the live ARRY price forecast →
Array Technologies is a fragile solar-tracker turnaround trading at $5.62 near its 52-week low ($5.39), with tentative Q1 2026 stabilization (28.2% GM, $2M net income) undermined by negative operating cash flow (-$29M), heavy leverage (D/E 2.85x), and negative book value. With a binary August 5 earnings print ~12 days away, a $203M M&A overhang from the Affordable Wire acquisition, and forecasts that have been beaten by the naive baseline, the risk/reward is asymmetric to the downside pre-print — HOLD with tight invalidation at $5.39.
HOLD / no fresh buys into the August 5 earnings print (~12 days). This is a binary event with heavy leverage, negative Q1 OCF, and unreliable model forecasts — do not size a swing here. If already long, tight stop below $5.39 (52w low); a decisive break opens $4.75-$4.50 air pocket. If flat, wait for either (a) $5.39 to hold on a post-earnings pullback with GM confirmed 26-28%+ AND positive OCF, or (b) a fresh flush to $4.50-$4.75 with capitulation volume for a starter. Do not chase the AI forecast rally to $8+ — it has been systematically wrong on this name.
1-6 month thesis hinges entirely on August 5. Bull case: GM sustains 27-28%, OCF turns positive, backlog grows, AWM integration clarity → re-rating to $7.50-$8.50 as short float (19.3%) unwinds. Bear case: GM slips, OCF stays negative, or AWM financing dilutes → break of $5.39 toward $4.50. Base case: mixed print, guidance cut, stock chops $5-$6.50. Expected return range: -20% to +40% skewed asymmetrically because of leverage. Change of mind: sustained OCF >$25M/qtr AND deleveraging commentary would move me to ACCUMULATE.
1-3 year terminal thesis: Array is a leveraged bet on utility-scale solar tracker demand and management's ability to convert AWM into a genuine energy-infrastructure platform. If the company can prove 26-28% GM is durable, delever from ~$760M debt, and grow revenue back above $1.5B, the stock could re-rate to $12-$15 (2-3x). Biggest structural risk: solar policy/tariff regime shifts, Chinese competition eroding pricing power, and the debt load forcing dilutive refinancing during a down cycle. Negative book value means equity holders are last-in-line if the operational stabilization fails.
The quarterly trajectory is deeply concerning: revenue collapsed sequentially from $393M in Q3 2025 to $226M in Q4 2025 to $223M in Q1 2026 (-43% from Q3 peak), and while Q1 2026 gross margin rebounded to 28.2% and net income turned marginally positive at $2M, operating cash flow flipped hard negative to -$29M (vs +$44M in Q4 2025). Balance sheet is stressed: $763M total debt vs $268M equity (D/E 2.85x), negative tangible book value (Book/sh -$1.39), and $200M cash providing limited cushion. TTM profit margin is -10.6%, ROE -22.6%, ROIC -6.6%. The $203M Affordable Wire acquisition (announced July 16) adds meaningful leverage on top of an already fragile capital structure — financing details remain undisclosed. Forward P/E of 6.2x and PEG 0.40 look optically cheap, but the forward EPS estimate ($0.91) requires a dramatic reversal that Q1's negative OCF calls into question. Sales Q/Q -26% and EPS Q/Q -686% show momentum still deteriorating into the print.
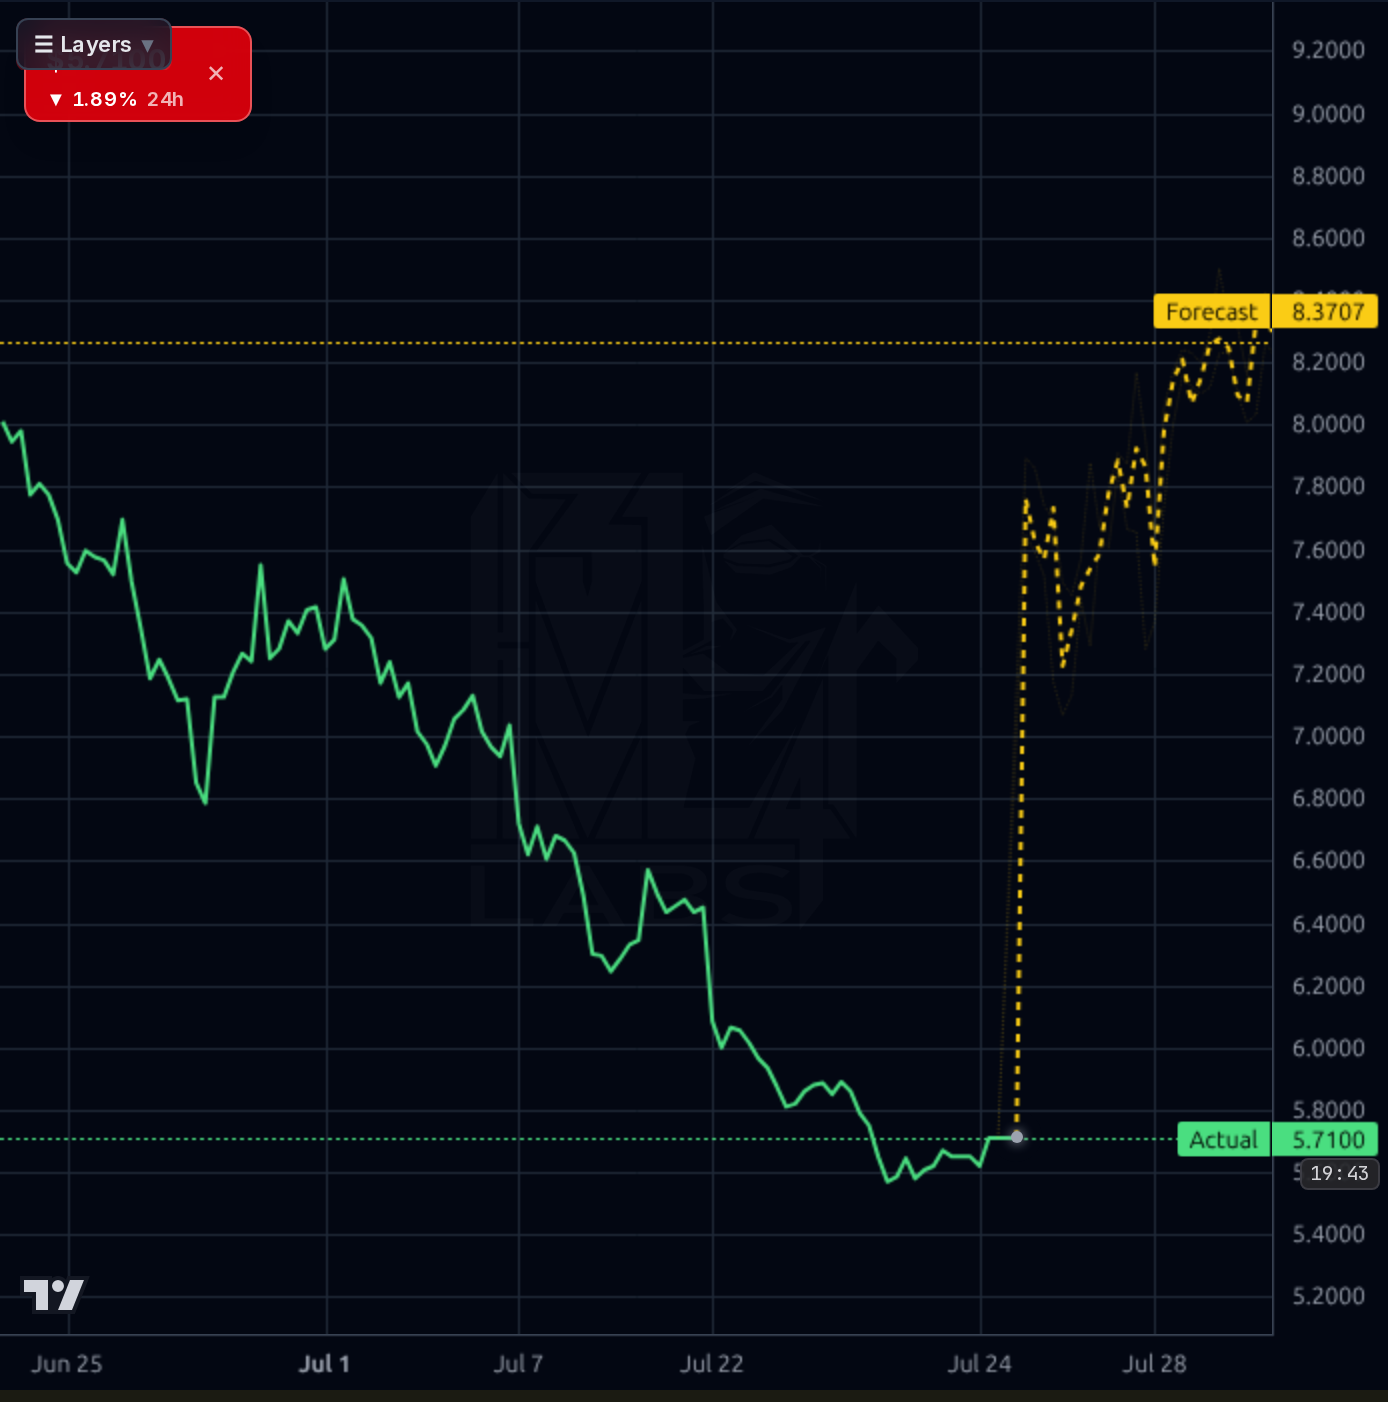
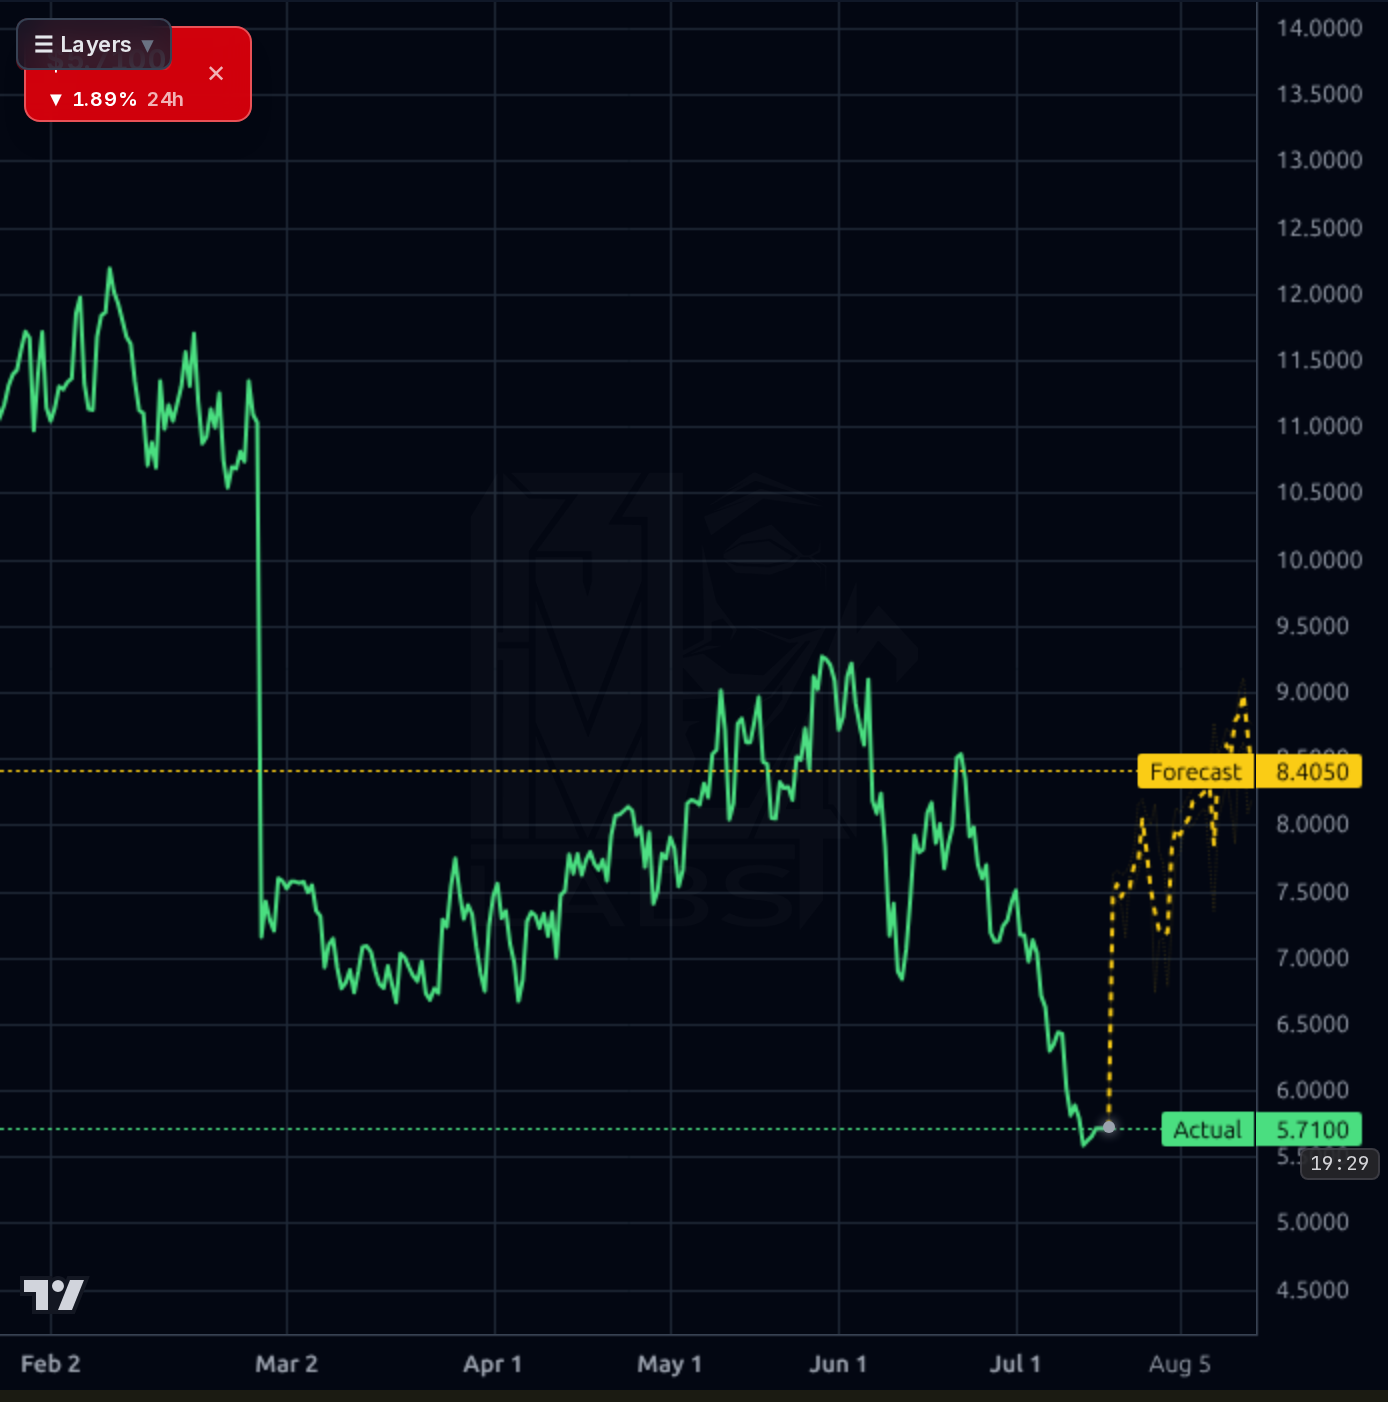
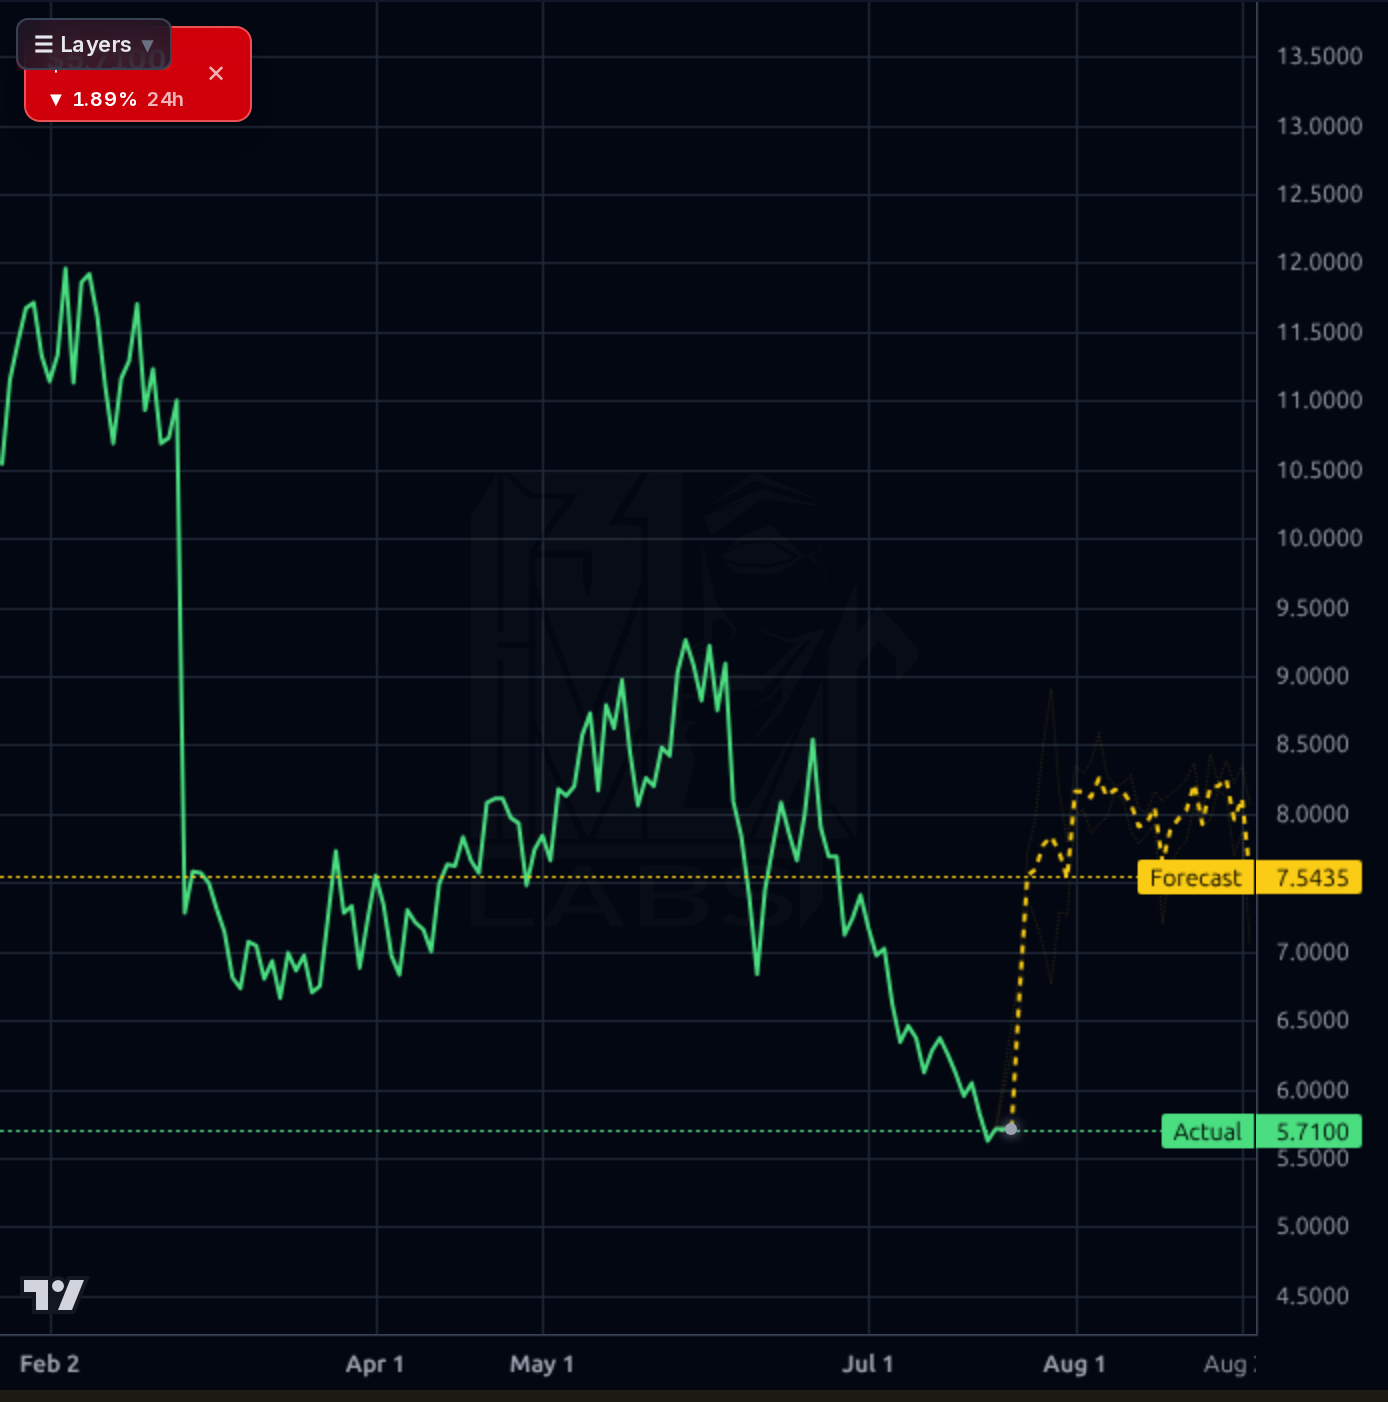
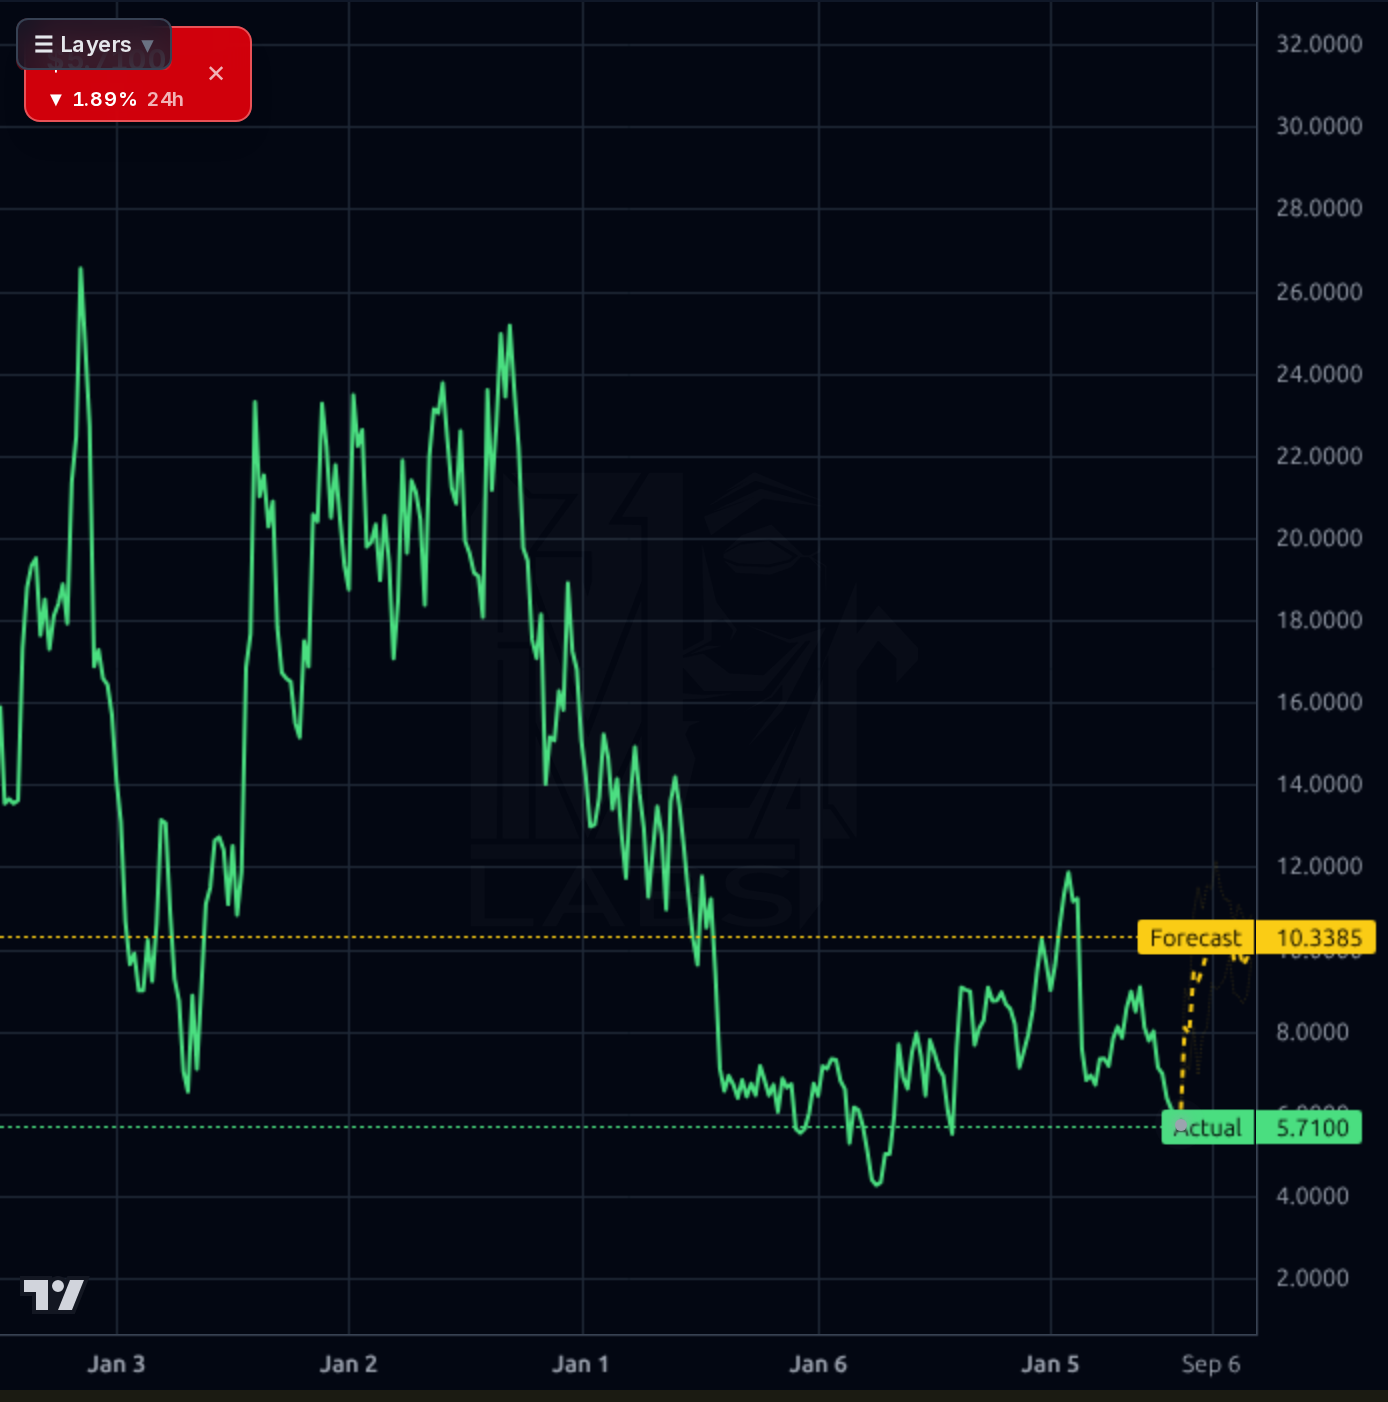
All timeframes are decisively bearish. Price at $5.62 sits -14% below SMA20, -26% below SMA50, and -33% below SMA200 — a classic downtrend cascade. The 1h chart shows price bouncing weakly off ~$5.60 support after a straight-line drop from $8 on July 1. The 4h and daily charts show the entire 2026 downtrend intact from $12+ highs, with the stock now testing the $5.39 52-week low that has held (barely) as the last structural support. The weekly chart shows the multi-year value destruction (~-70% 3Y, -59% 5Y) and price sitting in the lower quartile of a $4-$12 range. RSI 30.6 is oversold but the dossier lesson is clear: oversold has NOT marked bottoms on this name — the downtrend has persisted through multiple oversold signals. The AI forecast band ($7.54–$8.40) implies a 30-50% rip higher, but the model's realized directional accuracy is 10% at 1d and 33% at 1wk vs 91%/100% naive baselines — the forecast is unreliable in this regime and must be heavily discounted. If $5.39 breaks, next visible air pocket is $4.36 (the '4.36% off low' data point) and then the $4 zone flagged in social chatter.
Signal: The July 16 8-K disclosing the $203M Affordable Wire Management acquisition is the single most important recent catalyst — it extends TAM into utility energy infrastructure adjacency but layers material integration risk and likely incremental leverage onto an already stressed balance sheet. This is a management vote of confidence but also a distraction ahead of a binary print. The July 21 JP Morgan downgrade to Neutral with an $8 price target and Susquehanna's July 10 target cut from $9.50 to $7.25 (Neutral) show the sell-side losing patience. Noise: Zacks 'outpaced market' articles are backward-looking daily noise. TV mentions of 'array' are almost entirely unrelated (referring to arrays of models/tokens/backgrounds, not the ticker). Social sentiment is split 55/45 bullish, with retail explicitly waiting for $4 handles — not a contrarian bottom signal yet.
- Affordable Wire Management acquisition ($203M, closing pending) extends into utility energy infrastructure — potential cross-sell into existing tracker customer base
- DuraTrack D2S international rollout beyond US single-row markets validates TAM expansion (per dossier context)
- Forward EPS estimate of $0.91 vs TTM -$0.84 implies analysts expect a sharp earnings inflection — Aug 5 is the first test
- Short float 19.3% + $865M market cap = asymmetric squeeze potential IF the print confirms operational stability
- SmarTrack software/control layer offers a margin-accretive attach opportunity as installed base grows
- August 5 earnings is binary — negative OCF quarter #2 in a row would likely break $5.39 support
- D/E 2.85x with negative book value means any operational miss compounds into refinancing risk
- Sequential revenue deterioration $393M → $223M over two quarters undermines the growth narrative
- AWM acquisition financing terms undisclosed — likely incremental leverage or dilutive equity issuance
- Model forecasts have been beaten by naive baseline (10% vs 91% at 1d) — the yellow forecast band is unreliable
- Sell-side capitulating: JPM downgrade to Neutral $8 PT (Jul 21), Susquehanna cut to $7.25 (Jul 10)
- Solar policy/tariff uncertainty and 1.84 beta amplify macro drawdowns
- Prior bull targets have systematically failed to print on this name — apply aggressive haircut
Get AI analysis on any stock
This is one of hundreds of Kronos AI reports — scored fundamentals & technicals, bull/base/bear price targets, a multi-horizon plan, and continuously-updated forecasts across the market. Create a free account to explore them all.
Create your free account →Already a member? Sign in · Join our Discord