ARRY — AI Stock Forecast & Price Targets
Published 7/23/2026 · A free sample of K3vl4r’s AI-powered analysis.
Kronos price forecasts, scored fundamentals & technicals, and a multi-horizon plan.
View the live ARRY price forecast →
Array Technologies is a fragile solar-tracker turnaround trading at $5.82 (near 52-week low $5.39), with Q1 2026 showing tentative operational stabilization (28.2% GM, $2M net income) but negative Q1 operating cash flow (-$29M), heavy leverage (D/E 2.85x), and negative book value. With binary August 5 earnings ~13 days away, a fresh $203M M&A overhang, and the model's short-term forecast having been repeatedly beaten by the naive baseline, this is a HOLD/TRIM into the print — not a fresh long.
Do NOT initiate a fresh long into the August 5 earnings print (~13 days away). The setup is a binary event with 19% short float, negative operating cash flow last quarter, a fresh M&A to explain, and price sitting right on the $5.39 52-week low. Existing holders: TRIM into any bounce toward $6.20-$6.50 resistance to reduce event exposure. Invalidation for bears: a decisive weekly close back above $6.50 with volume; invalidation for bulls: a break of $5.39 which opens $4.50-$4.75. IV crush post-print is guaranteed — do not buy premium. If forced to play, small defined-risk position only. Earnings stance: NEUTRAL-BEARISH into print given cash-flow risk, but recognize squeeze risk if GM sustains at 26%+ and OCF turns positive.
1-6 month view is a HOLD with negative skew. The re-rating case requires: (1) Q2 GM sustained at 26%+, (2) operating cash flow back to positive, (3) constructive commentary on the Affordable Wire integration and financing, (4) backlog growth. If all four print, a move to $7.50-$8.50 is achievable (sell-side gravitates to $8-$9.82 target). If any one fails — especially cash flow — the stock likely tests $4.50 with meaningful downside from there. Expected return range: -25% to +30% wide dispersion. What changes my mind bullishly: a clean earnings beat with positive OCF and debt-refinancing clarity. What changes my mind bearishly: negative OCF two quarters running or any preferred-stock dilution announcement.
1-3 year terminal thesis is that ARRY is either a survivor that re-rates to 8-10x forward EPS on normalized ~$1.20-$1.50 EPS (implying $10-$15 range) driven by DuraTrack D2S international penetration, SmarTrack software attach, and utility infrastructure adjacency — OR it faces a solvency/dilution event given negative book value, $763M debt, and cyclical solar policy exposure (IRA/OBBBA overhang). The base case is muddle-through with modest re-rating to $8-$10 over 2 years. Biggest structural risk: capital structure — the company cannot service leverage through another cyclical downturn without equity issuance, and preferred-stock overhang is real. Solar tracker market itself is competitive with Nextracker as clear leader; ARRY needs to prove it can hold share in international markets.
Revenue trajectory is choppy and deteriorating on a YoY basis: Q1 2026 revenue of $223M is down sequentially from $393M in Q3 2025 and shows Sales Q/Q of -26.1%. Margins are the key debate — Q1 2026 gross margin bounced to 28.2% and operating margin to 2.0% after Q4 2025's disaster (GM 8.6%, operating loss -$46M, net loss -$146M from impairments), but one clean quarter does not confirm the 26-28% GM run-rate that forward EPS of $0.91 (fwd P/E ~6.4x) requires. Balance sheet is stressed: D/E 2.85x, total debt $763M vs. equity $268M, negative book value per share (-$1.39), and cash of only $201M against $763M debt. Cash flow quality is the critical red flag — Q1 2026 operating cash flow was -$29M and free cash flow -$37M, reversing the positive Q2-Q4 2025 trend and suggesting working-capital deterioration even as headline net income turned positive. ROE is -22.6%, ROIC -6.6%. The $203M Affordable Wire Management acquisition (announced July 16) is strategically sensible (adjacency into utility energy infrastructure) but adds integration risk and likely further leverage on an already stretched balance sheet. Capital allocation looks defensive/opportunistic rather than shareholder-return oriented; no dividend, no buyback capacity given leverage.
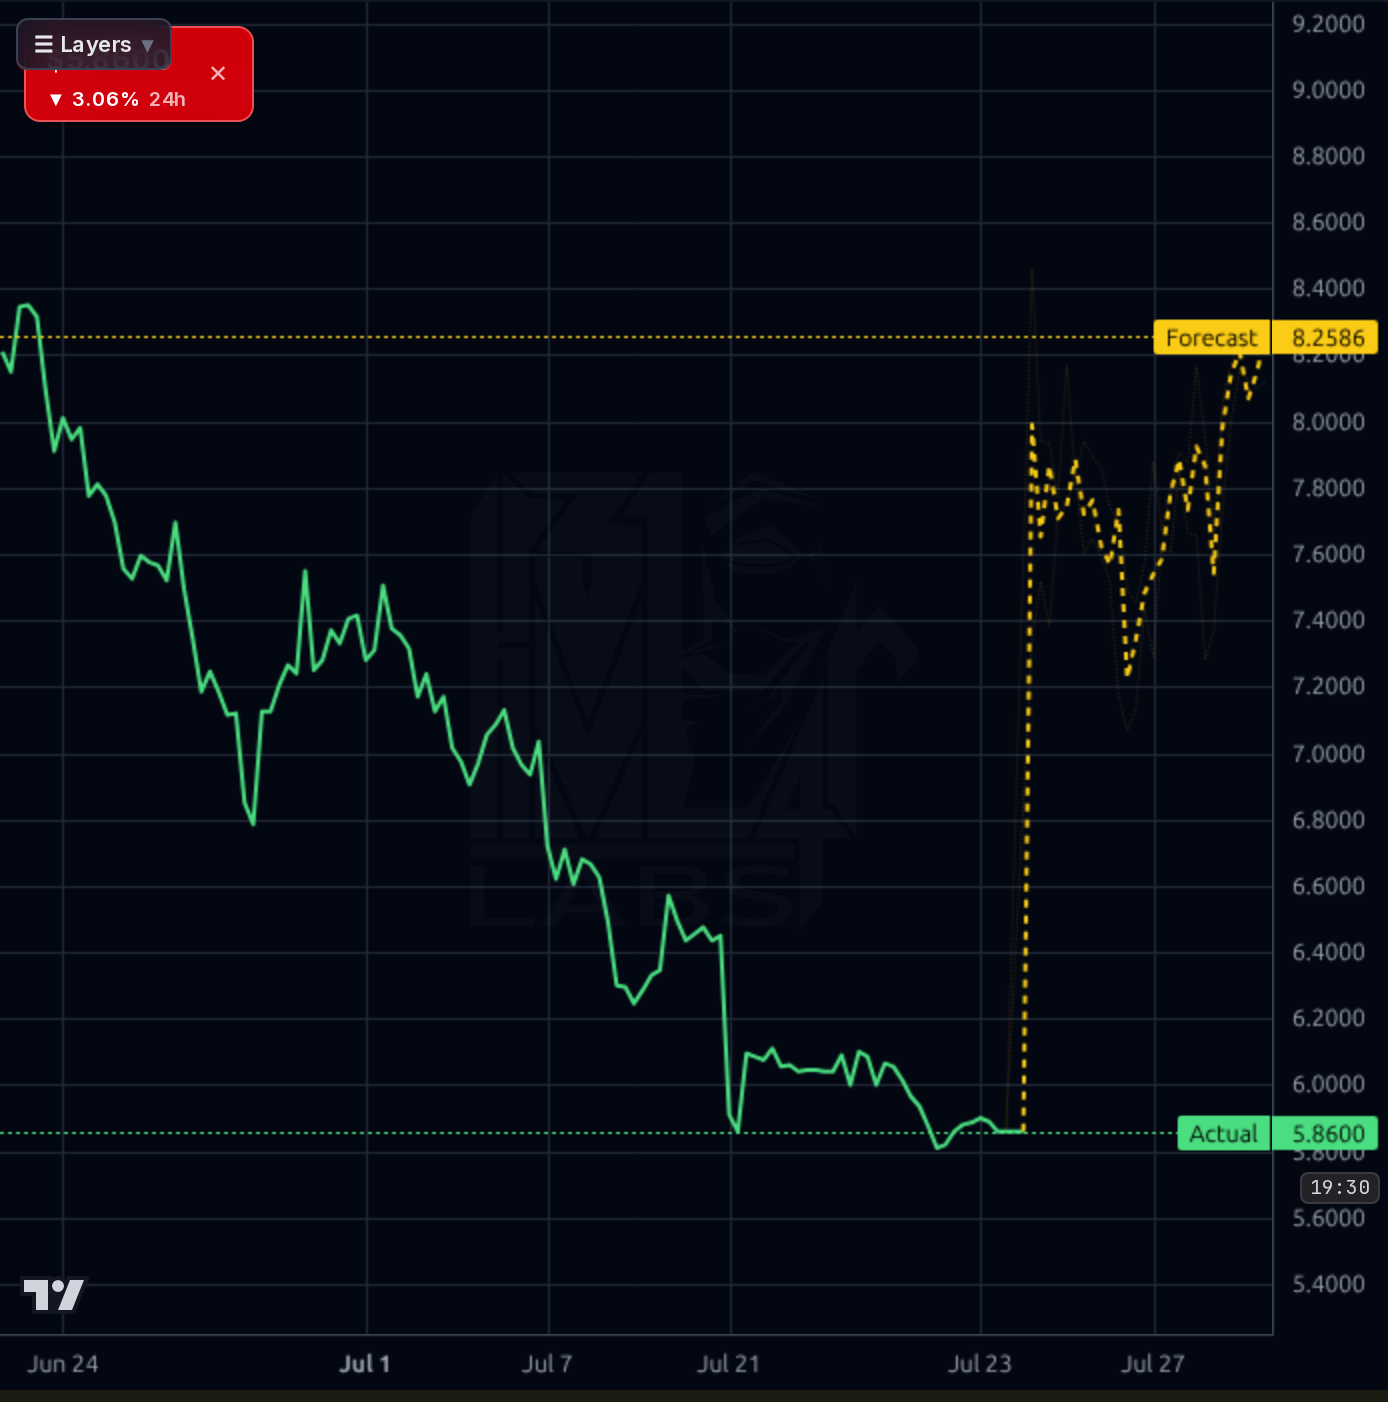
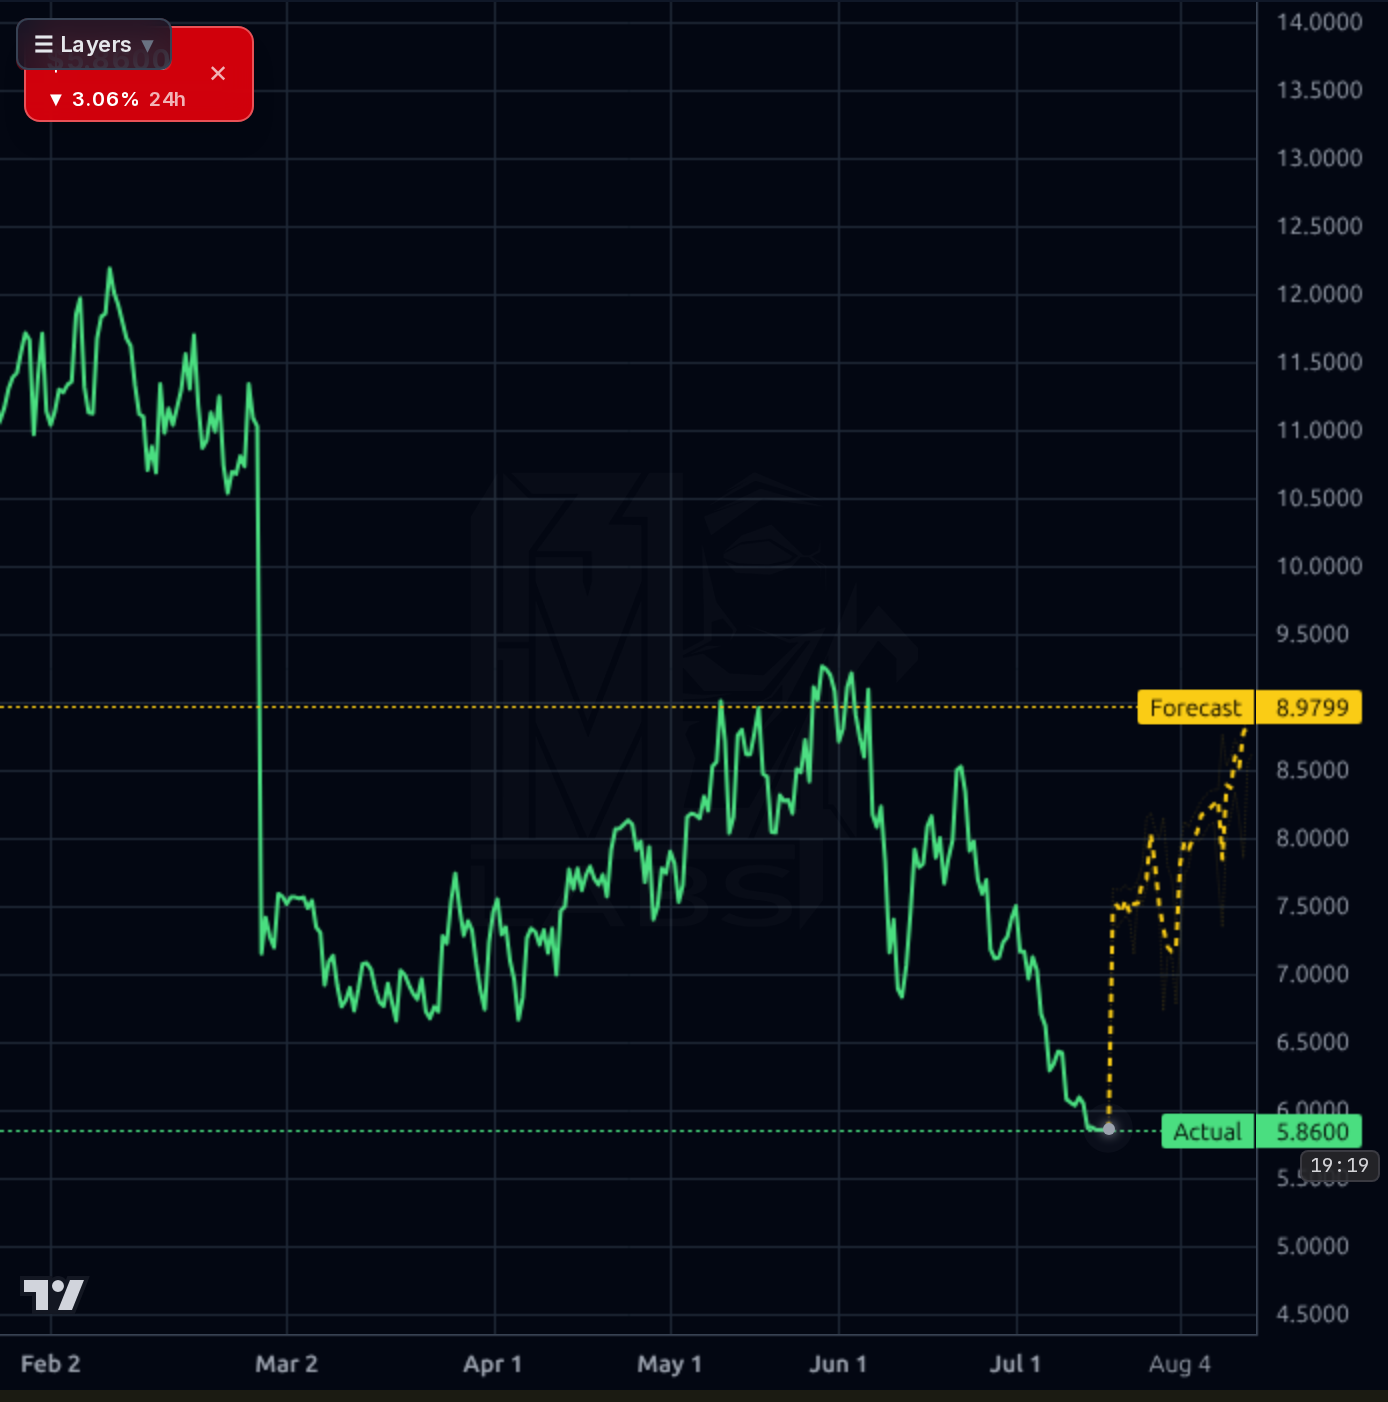
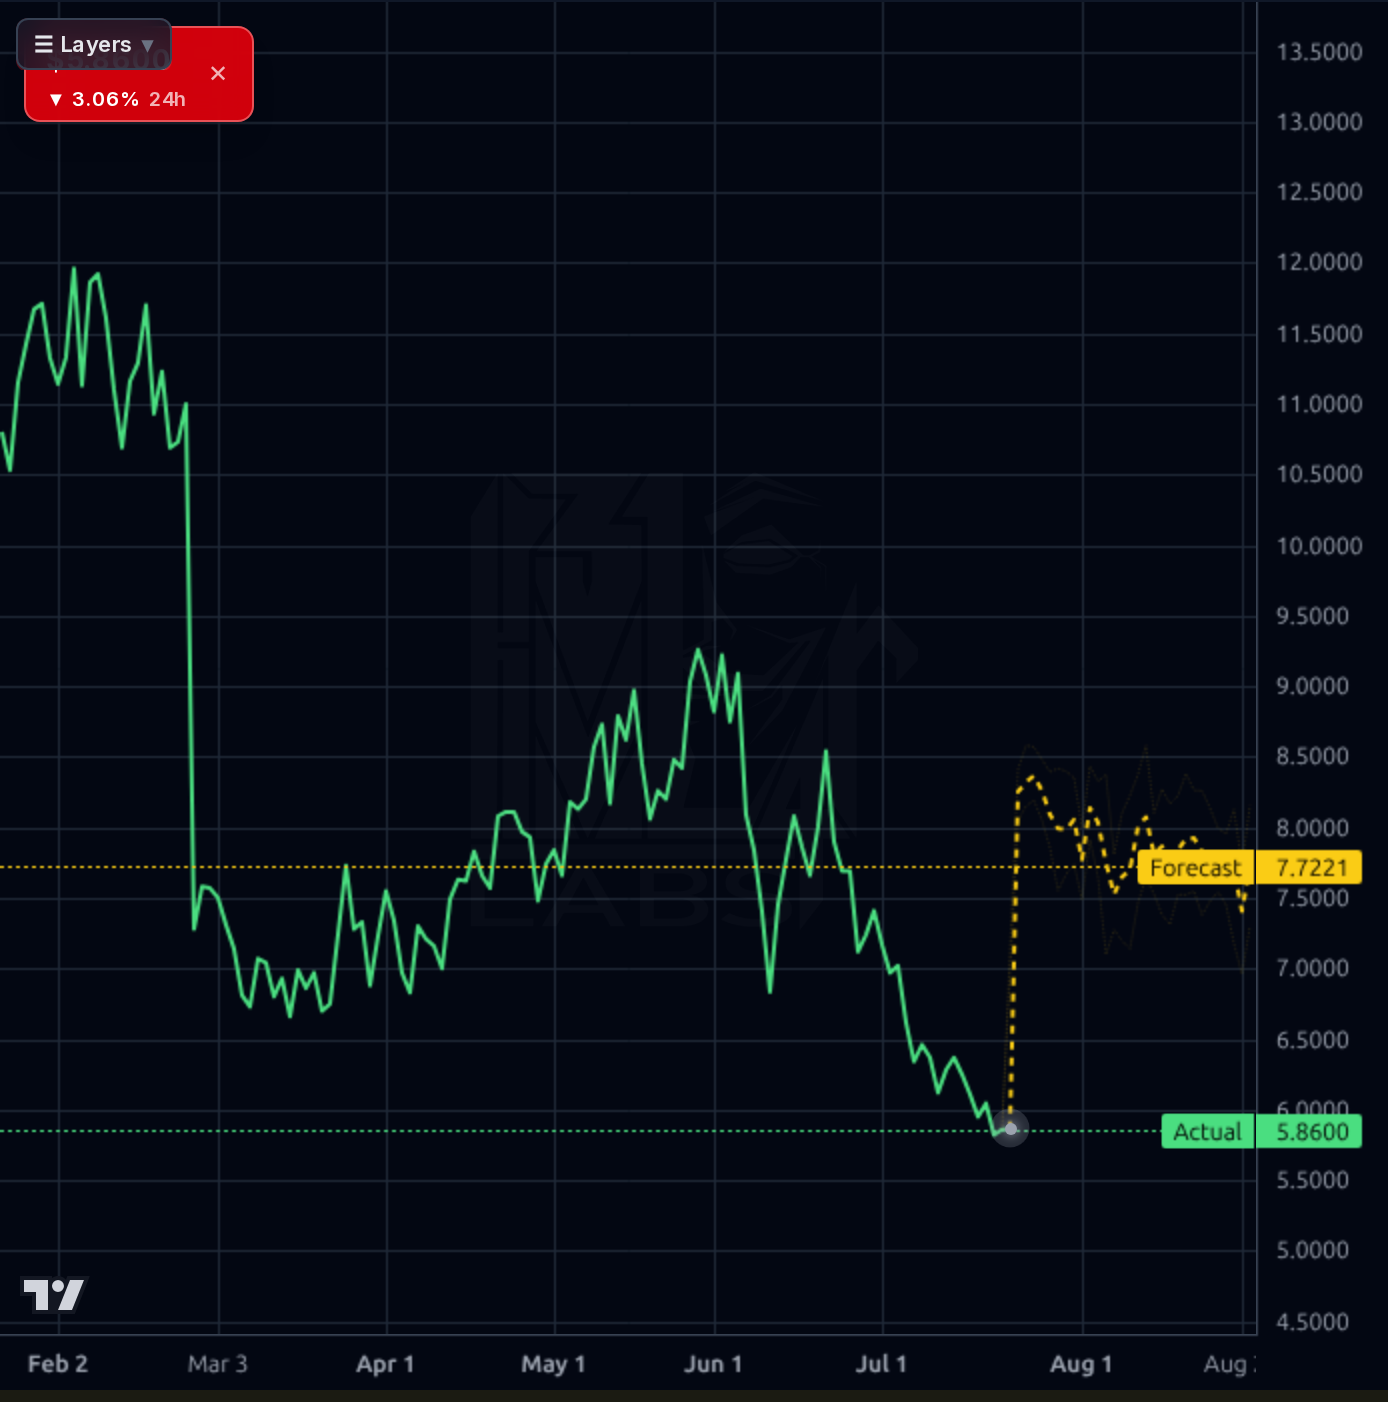
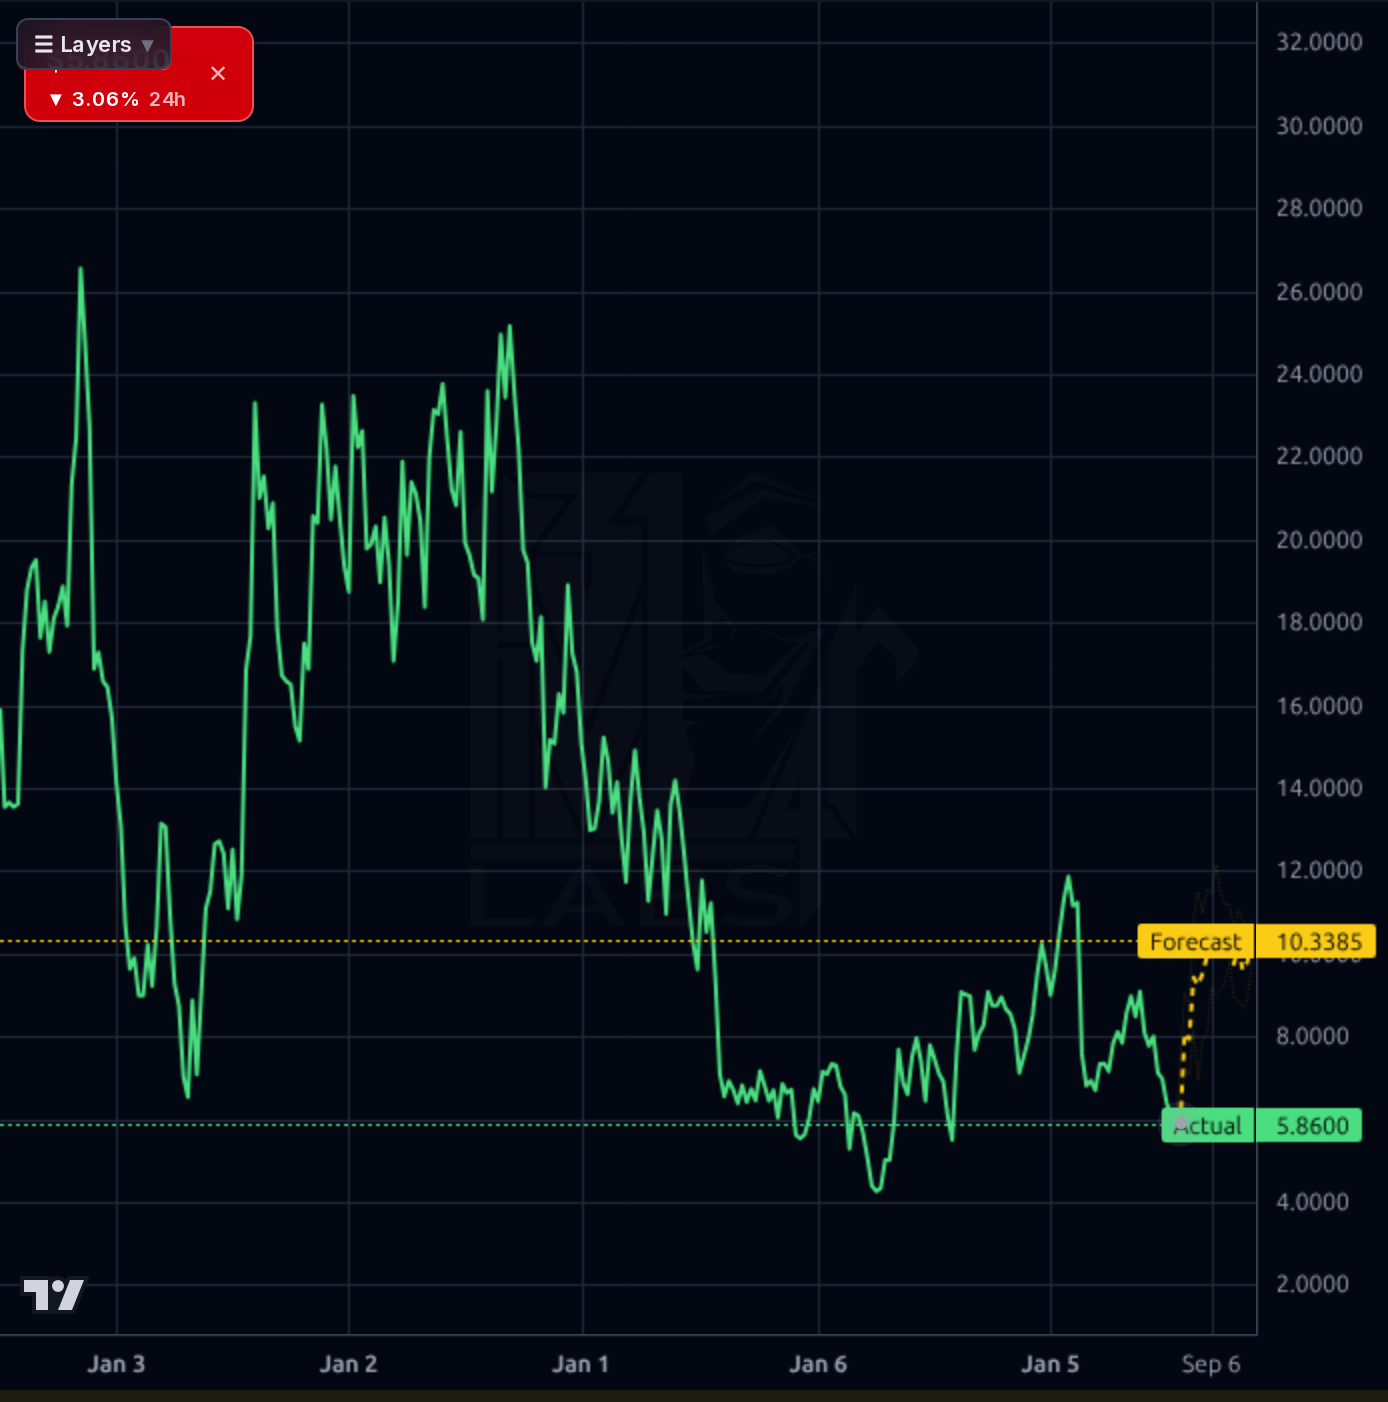
The trend is unambiguously bearish across every timeframe. The 1h chart shows a clean staircase down from ~$8.30 on June 24 to $5.86, with the recent low breaching the June basing range. The 4h/1d views show the stock has broken the $6.00-$6.20 support zone that had held into mid-July and is now testing the 52-week low at $5.39. The weekly chart shows a ~52% decline from the $12.23 high with no meaningful base yet. Momentum indicators confirm damage but no capitulation: RSI 32.6 (oversold but not extreme), price is -12.5% below SMA20, -24.0% below SMA50, and -30.9% below SMA200 — a full downtrend structure. Perf Month -31.9%, Perf Half Y -40.9%, YTD -36.9%. The model's forecast bands ($8.26 on 1h, $8.98 on 4h, $7.72 on 1d, $10.34 on 1wk) all imply sharp mean-reversion rallies, but the model's realized directional accuracy is 10% vs. a 91% naive baseline over 30 days — the forecast has been systematically wrong-way on this name and must be heavily discounted. Short interest at 19.3% of float (short ratio 4.5-4.9) sets up squeeze potential on any positive surprise, but also confirms deeply negative positioning. Key levels: $5.39 (52W low, must-hold), then air pocket to ~$4.50; resistance at $6.00-$6.20 reclaim, then $6.75, then $7.50.
The dominant signal is the July 16 8-K disclosing the $203M acquisition of Affordable Wire Management — a material strategic pivot into utility energy infrastructure adjacencies, which management is framing as TAM expansion. This is a real catalyst but comes with integration and financing overhang, and the market's response has been muted-to-negative (stock down ~5% since). JP Morgan's July 21 downgrade from Overweight to Neutral with an $8 PT and Susquehanna's July 10 PT cut from $9.50 to $7.25 both cut into the sell-side thesis at exactly the wrong time, right before the August 5 print. The Zacks 'outpaced the market' pieces are noise. Consensus target ($9.82) and Recom 2.09 still lean constructive, but the trend in analyst revisions is negative. TV mentions are all generic uses of the word 'array' — no signal. Social sentiment split 50/50 with retail flagging the preferreds overhang as the real earnings-day question — a legitimate concern given the leverage picture.
- Affordable Wire Management acquisition (July 16, $203M) opens utility energy infrastructure adjacency beyond pure solar tracking
- DuraTrack D2S dual-row tracker targeting international markets (Spain, Brazil, Australia) — TAM expansion beyond US single-row
- SmarTrack software/controls layer as higher-margin attach opportunity per forward EPS estimate implying 26-28% GM
- Gross margin normalization from Q1 2026's 28.2% print vs. Q4 2025's 8.6% collapse — the primary re-rating lever
- Analyst EPS Y/Y TTM +55% and EPS next Y +23.8% expectations create earnings-momentum tailwind IF Aug 5 confirms
- Binary August 5 earnings — negative Q1 operating cash flow (-$29M) creates real risk of a miss triggering break of $5.39 52W low
- D/E 2.85x with negative book value (-$1.39/sh) leaves no cushion; debt refinancing or preferred-stock dilution overhang flagged by retail
- JP Morgan downgrade (7/21) and Susquehanna PT cut (7/10, $9.50→$7.25) signal deteriorating sell-side conviction into the print
- Short float 19.3% of float creates two-way volatility — squeeze risk on any positive surprise, but also confirms negative smart-money positioning
- IRA/OBBBA solar-policy overhang and cyclical solar demand weakness (Sales Q/Q -26.1%) — company is a price-taker on macro
- M&A integration risk on the $203M Affordable Wire acquisition, likely funded with more debt on an already-stretched balance sheet
- Model's forecast has been beaten by naive baseline (10% vs 91% directional accuracy 30d) — the bullish forecast bands should be heavily discounted
Get AI analysis on any stock
This is one of hundreds of Kronos AI reports — scored fundamentals & technicals, bull/base/bear price targets, a multi-horizon plan, and continuously-updated forecasts across the market. Create a free account to explore them all.
Create your free account →Already a member? Sign in · Join our Discord