ARRY — AI Stock Forecast & Price Targets
Published 9/1/2026 · A free sample of K3vl4r’s AI-powered analysis.
Kronos price forecasts, scored fundamentals & technicals, and a multi-horizon plan.
View the live ARRY price forecast →
ARRY delivered a genuine Q2'26 operational inflection ($342M revenue, 29.1% GM, $121M OCF, $113.6M FCF, record $2.5B backlog) yet just broke to fresh 52-week lows at $4.42 after closing the $165M AWM cash acquisition, signaling the market is pricing capital-structure risk (2.54x D/E, negative book value) above operational execution. With RSI at 32, price -44% below 200DMA, and short float at 19.6%, this is a leveraged turnaround where the tape refuses to reward beats — HOLD with tight discipline until $4.48 either holds decisively or breaks toward the low-$3s.
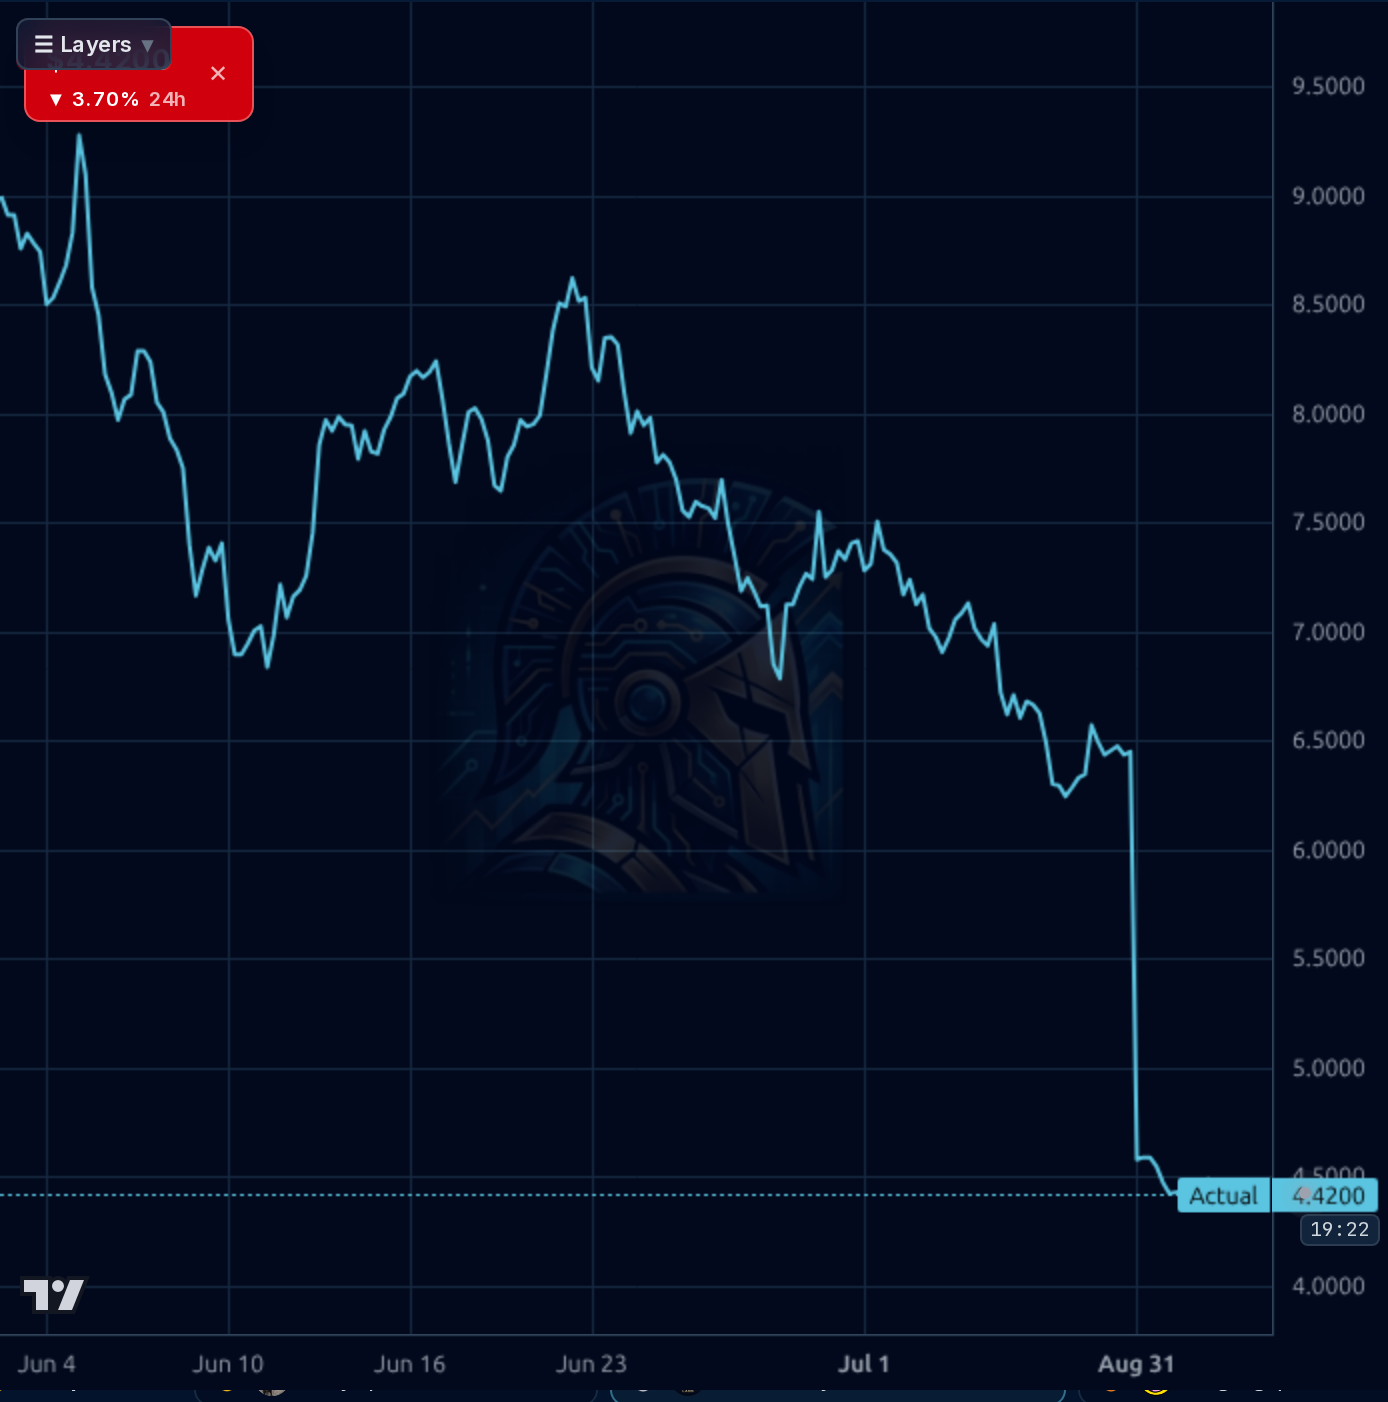
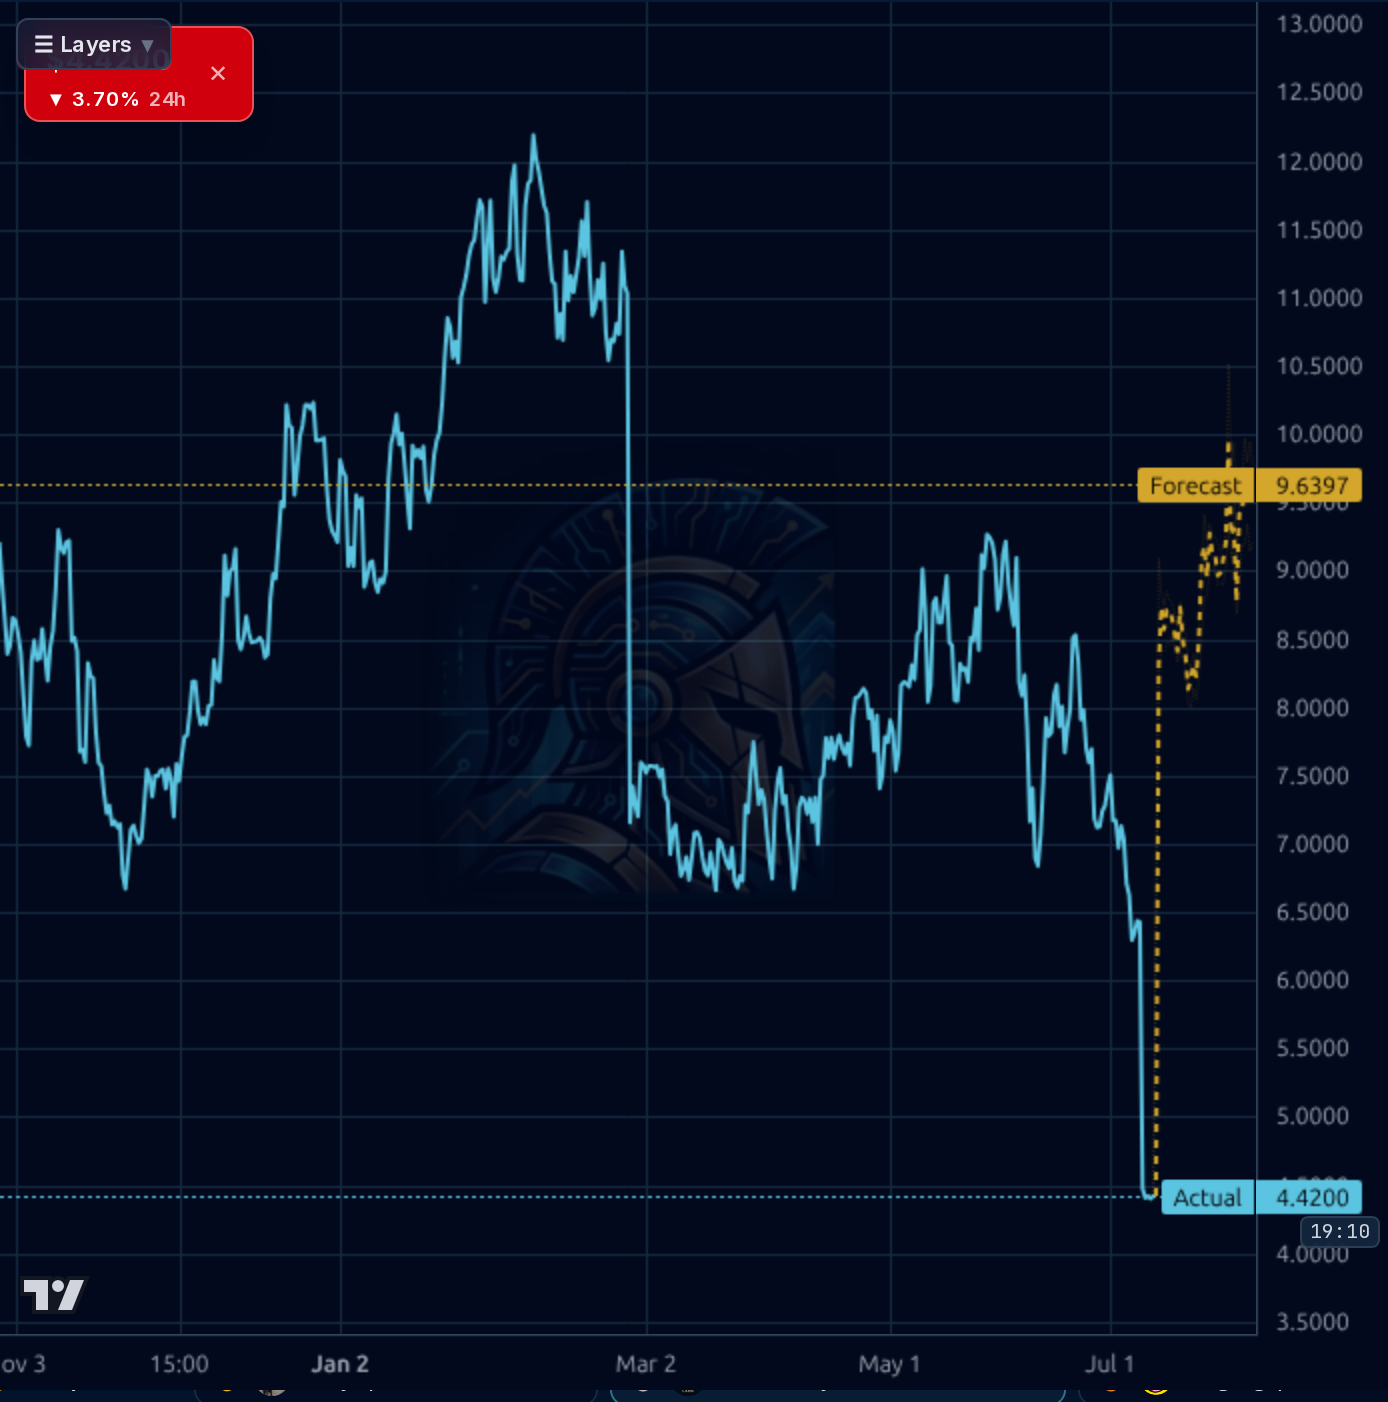
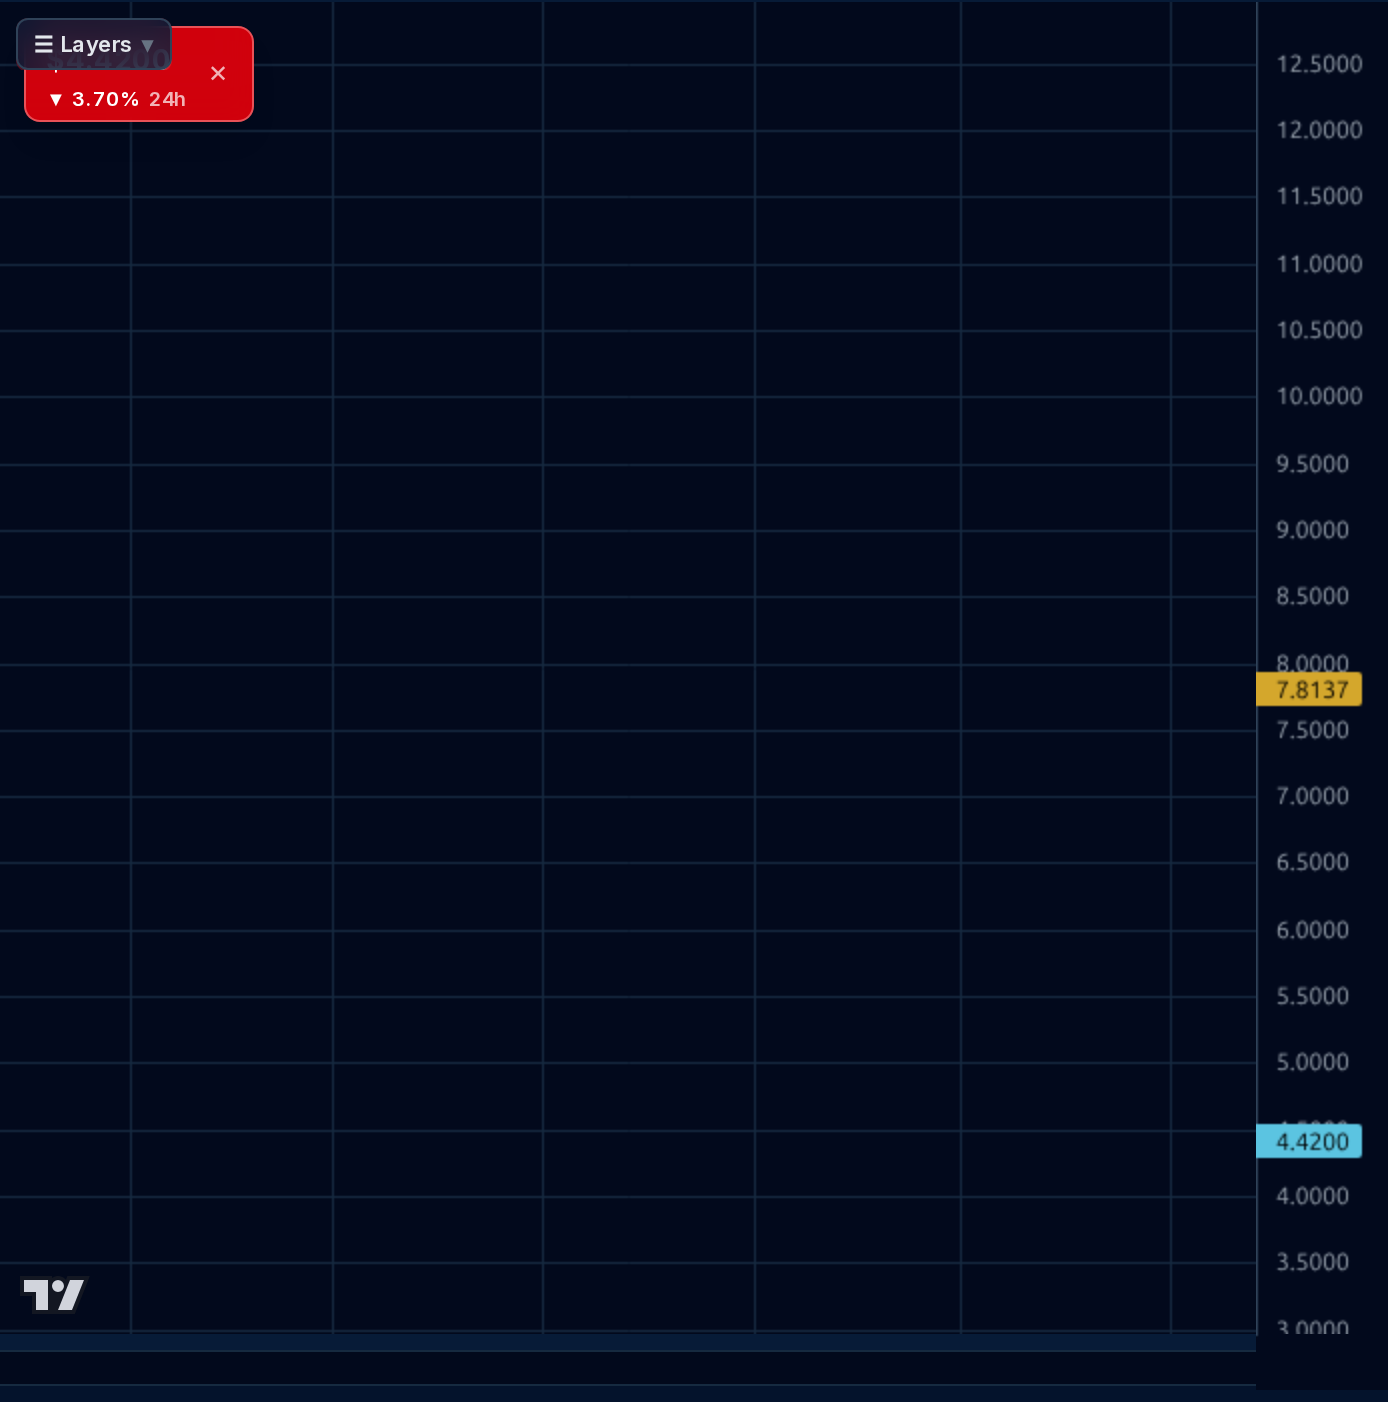
1-4 week view: HOLD with a hard stop-loss discipline. The $4.48 prior 52-week low is now broken intraday to $4.42; watch whether the daily closes hold above $4.30–4.40 or capitulate toward $4.00. Oversold RSI (32.5) and 19.6% short float set up potential for a violent squeeze on any positive catalyst, but forecast models on this name are demonstrably unreliable (6% 1d accuracy) so do not chase the projected bounce. For new positions: no add above $5.00; a starter position is defensible only on a reclaim of $5.00 with volume or on a flush to $3.75–4.00 that shows reversal structure. Invalidation for any bullish tactical view: a weekly close below $4.00.
1-6 month view: The path to re-rating requires two things — (1) Q3 print (November 4) demonstrating sustained positive OCF, not just adj EPS, and (2) clarity that the AWM cash drawdown does not force a dilutive equity raise. If both boxes are checked, the forward P/E of 5.0x and PEG of 0.37 leave room for a ~40-60% multiple expansion toward $6.50–7.00. If Q3 OCF reverts negative or refinancing chatter emerges, $3.50 becomes the next stop. Expected return range: -20% to +50% asymmetry, but with wide realized volatility (ATR $0.31, 4.5% daily vol). What changes my mind bullishly: a clean Q3 OCF number above $50M and explicit management commentary on debt paydown from FCF. What changes my mind bearishly: any equity issuance announcement or a Q3 GM print below 25%.
1-3 year view: If ARRY successfully converts the $2.5B backlog and the integrated APA platform (trackers + wire management + software) drives durable 25%+ gross margins with $150M+ annual FCF, this is a $10-12 stock at a modest 8-10x forward earnings on normalized $0.90-1.10 EPS. The multi-year drivers are utility-scale solar deployment cadence, international SkyLink penetration, and margin-accretive product mix. The biggest structural risk is that the 2.54x D/E capital structure is incompatible with a policy shock — an IRA/45X rollback, tariff regime change, or utility IRR compression from sustained high rates could force a distressed refinancing that permanently impairs equity holders. This name is either a multi-bagger or a zero-to-single-digit trap; there is very little middle ground given the leverage.
Q2'26 was the cleanest operational print in this cycle: revenue $342M (+53% QoQ off Q1's $223M), gross margin 29.1% (vs 8.6% in Q4'25), operating income $37.2M (10.9% op margin), net income $24.3M, and critically $121M operating cash flow / $113.6M FCF — the first tangible proof the tracker business can self-fund when backlog converts. Full-year guide of $1.4–1.5B revenue and $210–230M adj EBITDA implies material H2 acceleration. However, the balance sheet remains the fatal flaw: $753M total debt vs $296M equity (D/E 2.54x), book value -$1.31/share, ROE -26%, and net leverage still elevated near 3.7x TTM EBITDA. The August 31 close of the $165M AWM cash acquisition draws down the $307M cash balance meaningfully and extends TAM into wire management, but leaves the company thinner on liquidity heading into a still-uncertain policy environment. TTM sales growth of just 1.2% and profit margin -12.5% show the trailing picture remains ugly; the entire thesis hinges on Q3/Q4 reproducing the Q2 OCF result rather than reverting to Q1's -$29M working-capital drain.
The tape is unambiguously broken across every timeframe. Daily chart shows a violent gap-down from ~$6.40 to $4.42 in a single session (roughly -30%) following the AWM closing news, printing a fresh 52-week low and sitting -11.7% below the 20DMA, -24.3% below the 50DMA, and -44.1% below the 200DMA. RSI at 32.5 is oversold but not washed out. The 4h chart confirms a stair-step downtrend from the mid-June $8.60 high with no meaningful reversal candles. The 1h chart shows continued weakness with no basing action visible. The forecast band projects a mean-reversion bounce to ~$7.81 (1d) and $9.64 (4h) — however, realized directional accuracy on this name is 6% (1d) and 0% (1wk), materially worse than the naive baseline, so these bullish forecasts must be heavily discounted. Key levels: $4.48 (prior 52-week low) is the line in the sand; a decisive break opens $4.00 then sub-$4 with no meaningful support until $3.50. Upside resistance stacks at $5.00 (psychological), $5.50 (gap-fill zone), then $6.40 (pre-gap pivot). Momentum, trend, and structure all favor sellers until proven otherwise.
The dominant catalyst is the August 31 8-K confirming ARRY completed the AWM acquisition with ~$165M cash consideration — this closes an overhang but replaces it with liquidity concern given cash drops from $307M toward ~$142M pro forma. The August 20 investor webcast unveiled the integrated APA balance-of-system platform (foundations, tracking, electrical, controls, software), and Jefferies flagged the record $2.5B orderbook with ~50% traction from new products — genuine bullish signals that the market is choosing to ignore. Q2 earnings (August 5) beat with 53% QoQ revenue growth and raised guidance, yet the stock is down 15% since. Secondary color: an August 20 sector selloff tied to surging long-term Treasury yields pressuring solar cost-of-capital, and an August 27 StockStory piece flagging analyst optimism as potentially over-extended. Retail sentiment is 64% bearish. The signal-vs-noise read: fundamentals are inflecting, but macro (rates), capital structure (leverage), and dilution/cash-drawdown fears are dominating price action — exactly the pattern where beat/raise prints get sold.
- $2.5B record orderbook (+37% YoY, +$500M added in Q2'26) provides revenue visibility through H2'26 and into 2027
- AWM acquisition (closed Aug 31, ~$165M cash) extends TAM into utility-scale wire management with cross-sell to installed tracker base
- APA integrated balance-of-system platform (unveiled Aug 20) bundles foundations, trackers, electrical, controls, and software — margin-accretive integration play
- New products (SkyLink, DuraTrack D2S, OmniTrack) now ~50% of orderbook, driving mix shift toward higher-margin international and complex sites
- Raised 2026 guide ($1.4-1.5B revenue, $210-230M adj EBITDA, $0.68-0.75 EPS) implies H2 revenue acceleration to ~$835M and 26-27% adj EBITDA margin
- Q2'26 delivered $121M OCF / $113.6M FCF — first quarter proving operating leverage flows to cash when backlog converts, setting up potential for $200M+ annual FCF if sustained
- Capital structure: $753M debt vs $296M equity (D/E 2.54x), negative book value -$1.31/share, ROE -26% — any refinancing at depressed prices would be highly dilutive
- AWM cash drawdown of ~$165M reduces pro-forma cash to ~$142M, tightening liquidity heading into an uncertain rate/policy environment
- Q2 OCF durability unproven — Q1'26 OCF was -$29M and Q4'25 EBITDA was -$132M; single-quarter working-capital release is a real risk
- Technical structure fully broken: fresh 52-week lows at $4.42, price -44% below 200DMA, no visible support until $4.00 then $3.50
- U.S. solar policy risk (IRA/45X rollback, tariff regime) and elevated long-term Treasury yields compressing utility project IRRs and delaying orders
- Stock sold off ~28% into and after a genuine beat/raise with record backlog — market is discounting something the reported P&L does not yet show
- Short float 19.6% creates squeeze potential but also reflects sophisticated skepticism from institutional shorts
- TTM sales growth just 1.2%, EPS Q/Q -70.9% — trailing fundamentals remain weak; entire thesis depends on H2'26 execution
Get AI analysis on any stock
This is one of hundreds of Kronos AI reports — scored fundamentals & technicals, bull/base/bear price targets, a multi-horizon plan, and continuously-updated forecasts across the market. Create a free account to explore them all.
Create your free account →Already a member? Sign in · Join our Discord