BBD — AI Stock Forecast & Price Targets
Published 9/15/2026 · A free sample of K3vl4r’s AI-powered analysis.
Kronos price forecasts, scored fundamentals & technicals, and a multi-horizon plan.
View the live BBD price forecast →
BBD trades at a compelling 8x trailing / 6.1x forward P/E with a ~7% dividend yield and improving fundamentals (Q2 net margin 22%, EPS Q/Q +32%), but near-term technicals are ambiguous with the AI model showing bearish 1wk forecasts (unreliable in-sample) and a cluster of executive sales in early September. The setup favors patient accumulation on weakness rather than chasing, given a risk-off market backdrop and Brazilian macro sensitivity.
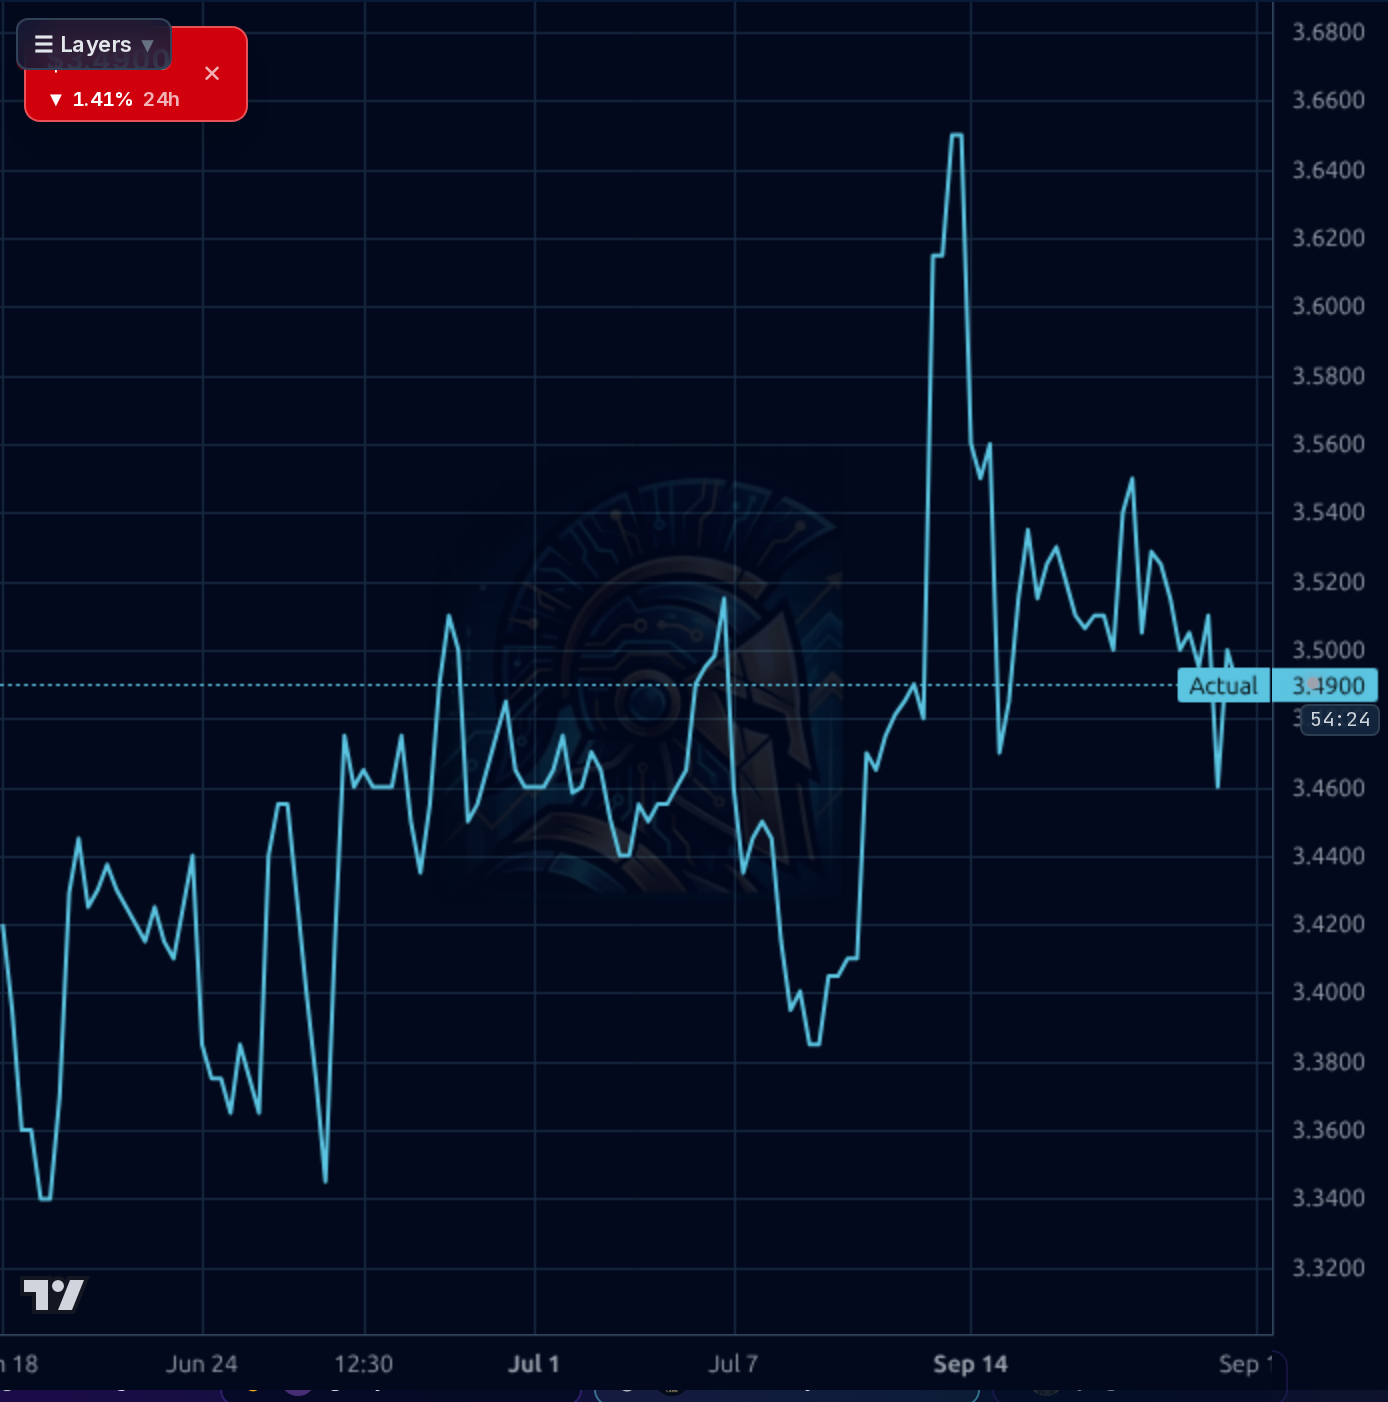
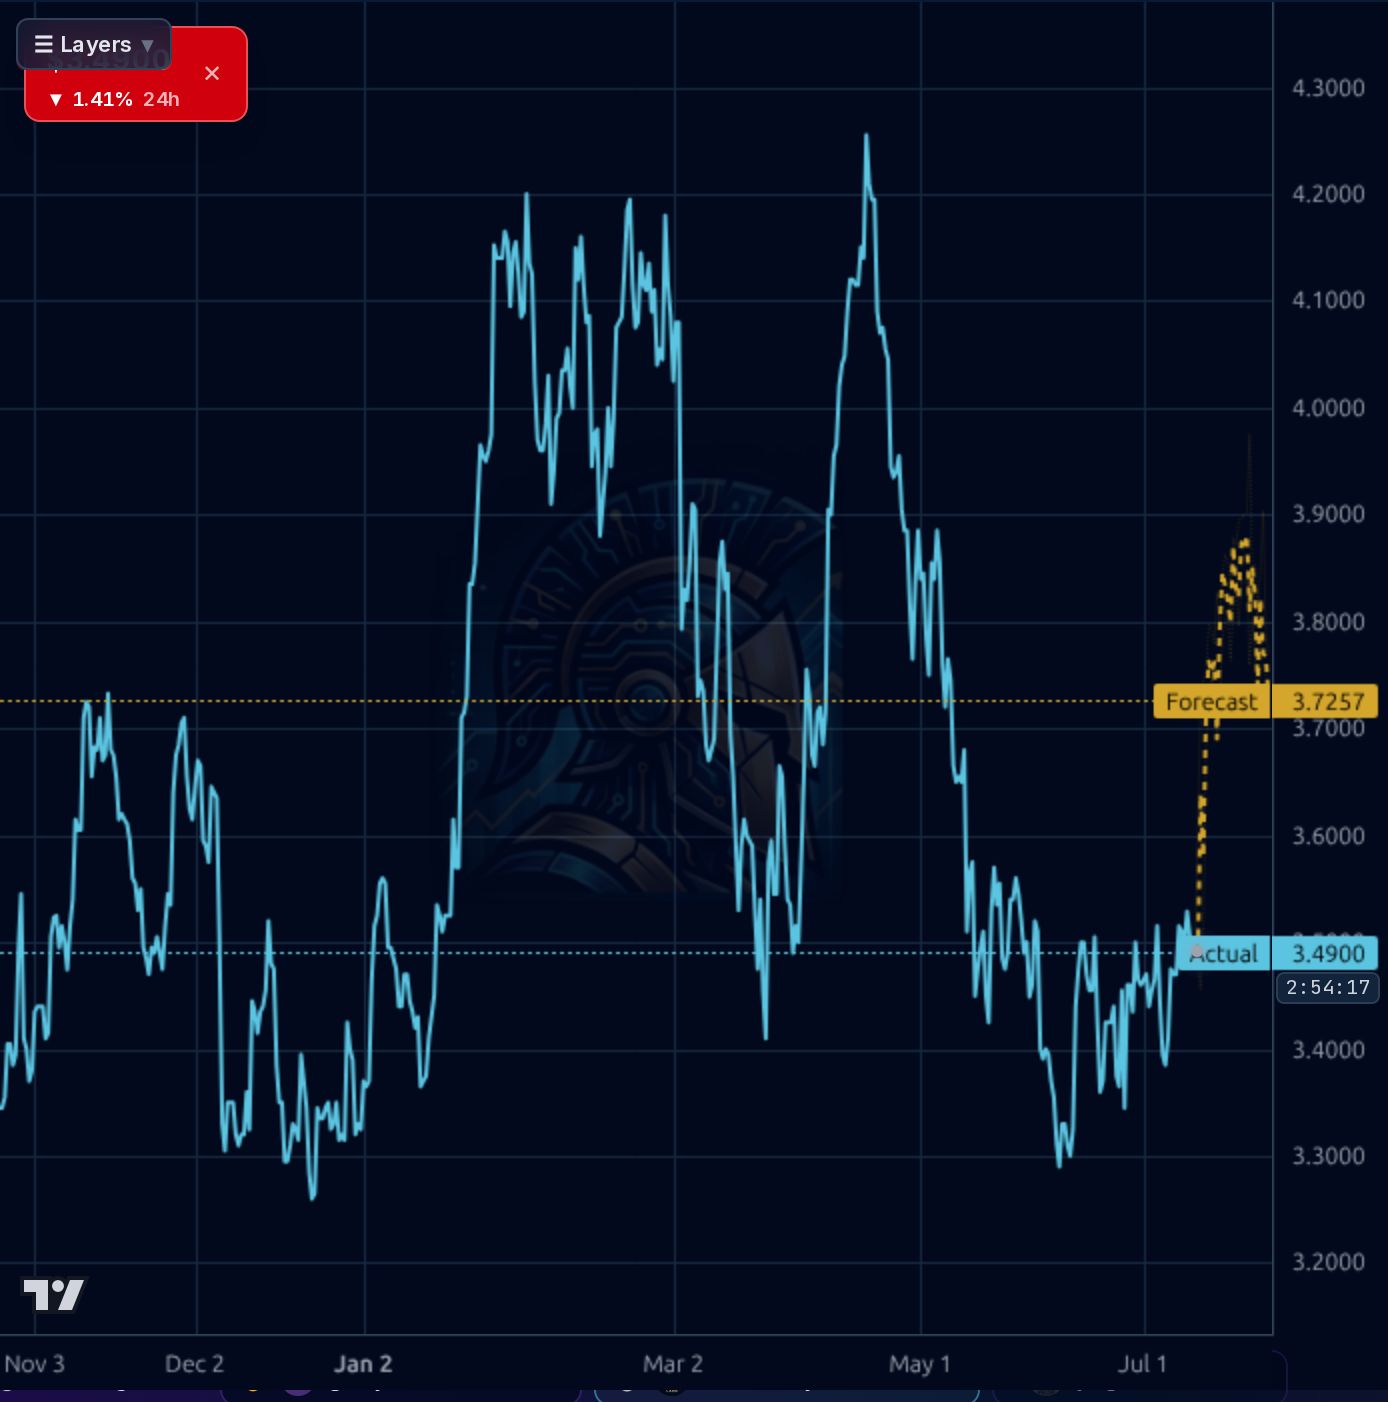
Neutral-to-mildly-constructive over 1–4 weeks. Price sits mid-range at $3.49 with the recent range $3.40–$3.65 defining the trade. Prefer to add on a pullback to $3.40 (SMA50 confluence) with tight invalidation below $3.30. On strength, wait for a clean daily close above $3.60 before adding. Do not chase into the ex-dividend date (10/5). Size any new position at 1/3 of intended weight given the risk-off market regime and the recent insider selling cluster. Discount the AI 1wk bearish forecast — its realized accuracy has trailed the naive baseline.
Constructive over 1–6 months. The earnings improvement (Q2 net margin 22%, EPS Q/Q +32%) plus a forward P/E of 6.1x and consensus target of $4.63 create an asymmetric setup: base case return of +12–18% to $3.90–$4.10 (retest of the April high area) with the ~7–8% dividend adding to total return. Key catalysts: next earnings print (likely early November), Brazilian rate policy trajectory, and any updates on subsidiary listings. Thesis breaks if Q3 earnings show margin reversal, or if BRL weakens materially / Selic path turns hawkish again.
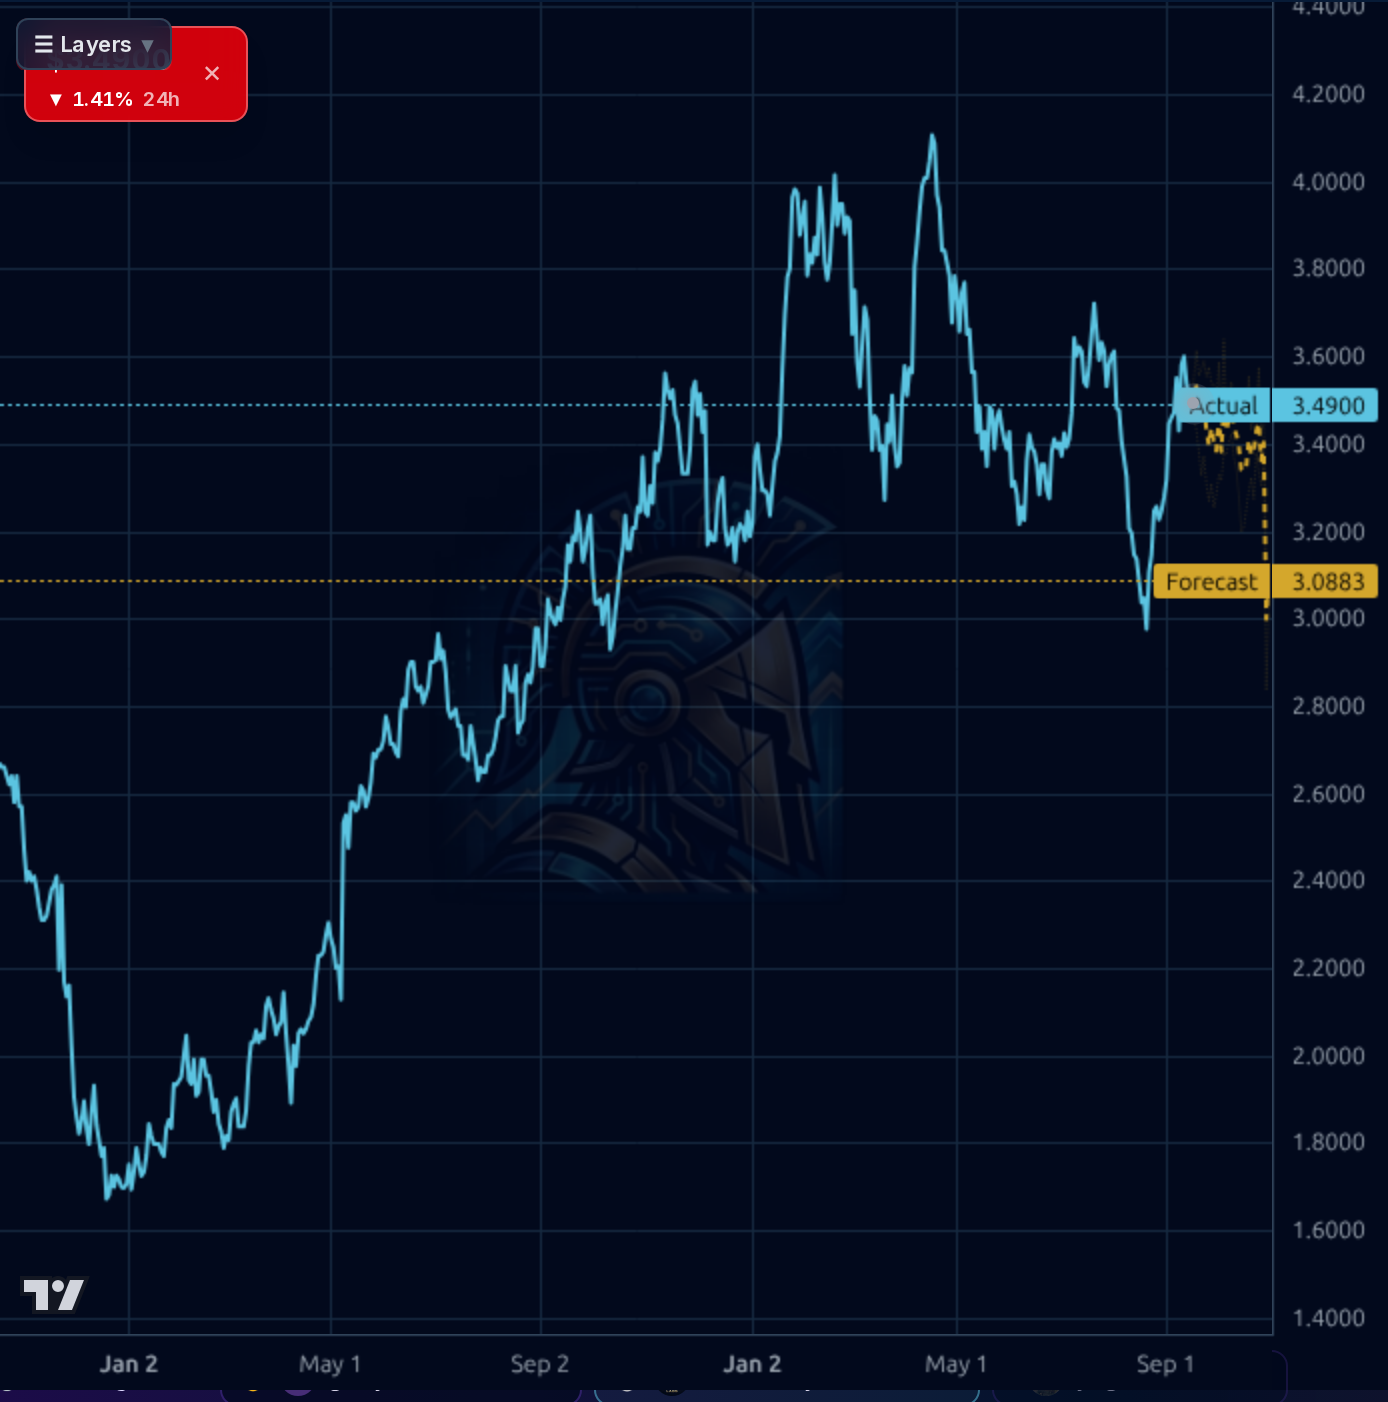
Positive 1–3 year view. BBD is a franchise cyclical trade — the multi-year weekly chart from $1.70 (2023) to $3.50 today shows a bank exiting a bad credit cycle. If ROE mean-reverts toward the 15–17% range (from 13.8% now, still below Itaú's ~20%+), earnings power supports a mid-teens fair multiple, implying $4.50–$5.50 over 2–3 years plus compounding dividends. Biggest structural risk: Brazilian sovereign credit deterioration or a policy-driven Real devaluation that would compress USD-denominated returns for ADR holders, plus digital-bank competition (Nubank) pressuring net interest margins on retail products.
Bradesco's earnings trajectory is clearly improving: quarterly net income rose from R$5.50B (Q3'25) to R$6.50B (Q4'25) to R$7.14B (Q2'26), with net margin expanding to 22.2% in Q2'26 from 19.7% in Q3'25. TTM sales growth of +32% Y/Y and EPS Y/Y TTM of +27.7% support the recovery narrative, with ROE at 13.8% and ROIC at 4.1% — respectable for a Brazilian bank exiting a credit cycle. Valuation is genuinely cheap: 8.04x trailing P/E, 6.10x forward P/E, 1.06x P/B, and a 0.54 PEG. The dividend TTM yield is 6.83% with an estimated forward yield of ~8.5%, backed by only a 6.82% payout ratio (misleading here as bank payout ratios are calculated differently, but the dividend is well-covered by earnings). The balance sheet shows the typical bank profile — total assets R$2.47T against equity of R$181B (D/E 4.62), so leverage is high but appropriate for the industry. Operating cash flow is lumpy (-R$52.6B in Q2'26 after +R$86.2B in Q1'26), reflecting working-capital swings typical of large banks rather than a genuine cash issue. Key friction: profit margin at just 6.15% and ROA at 1.06% indicate the franchise still under-earns versus Itaú, leaving room for continued mean-reversion upside.
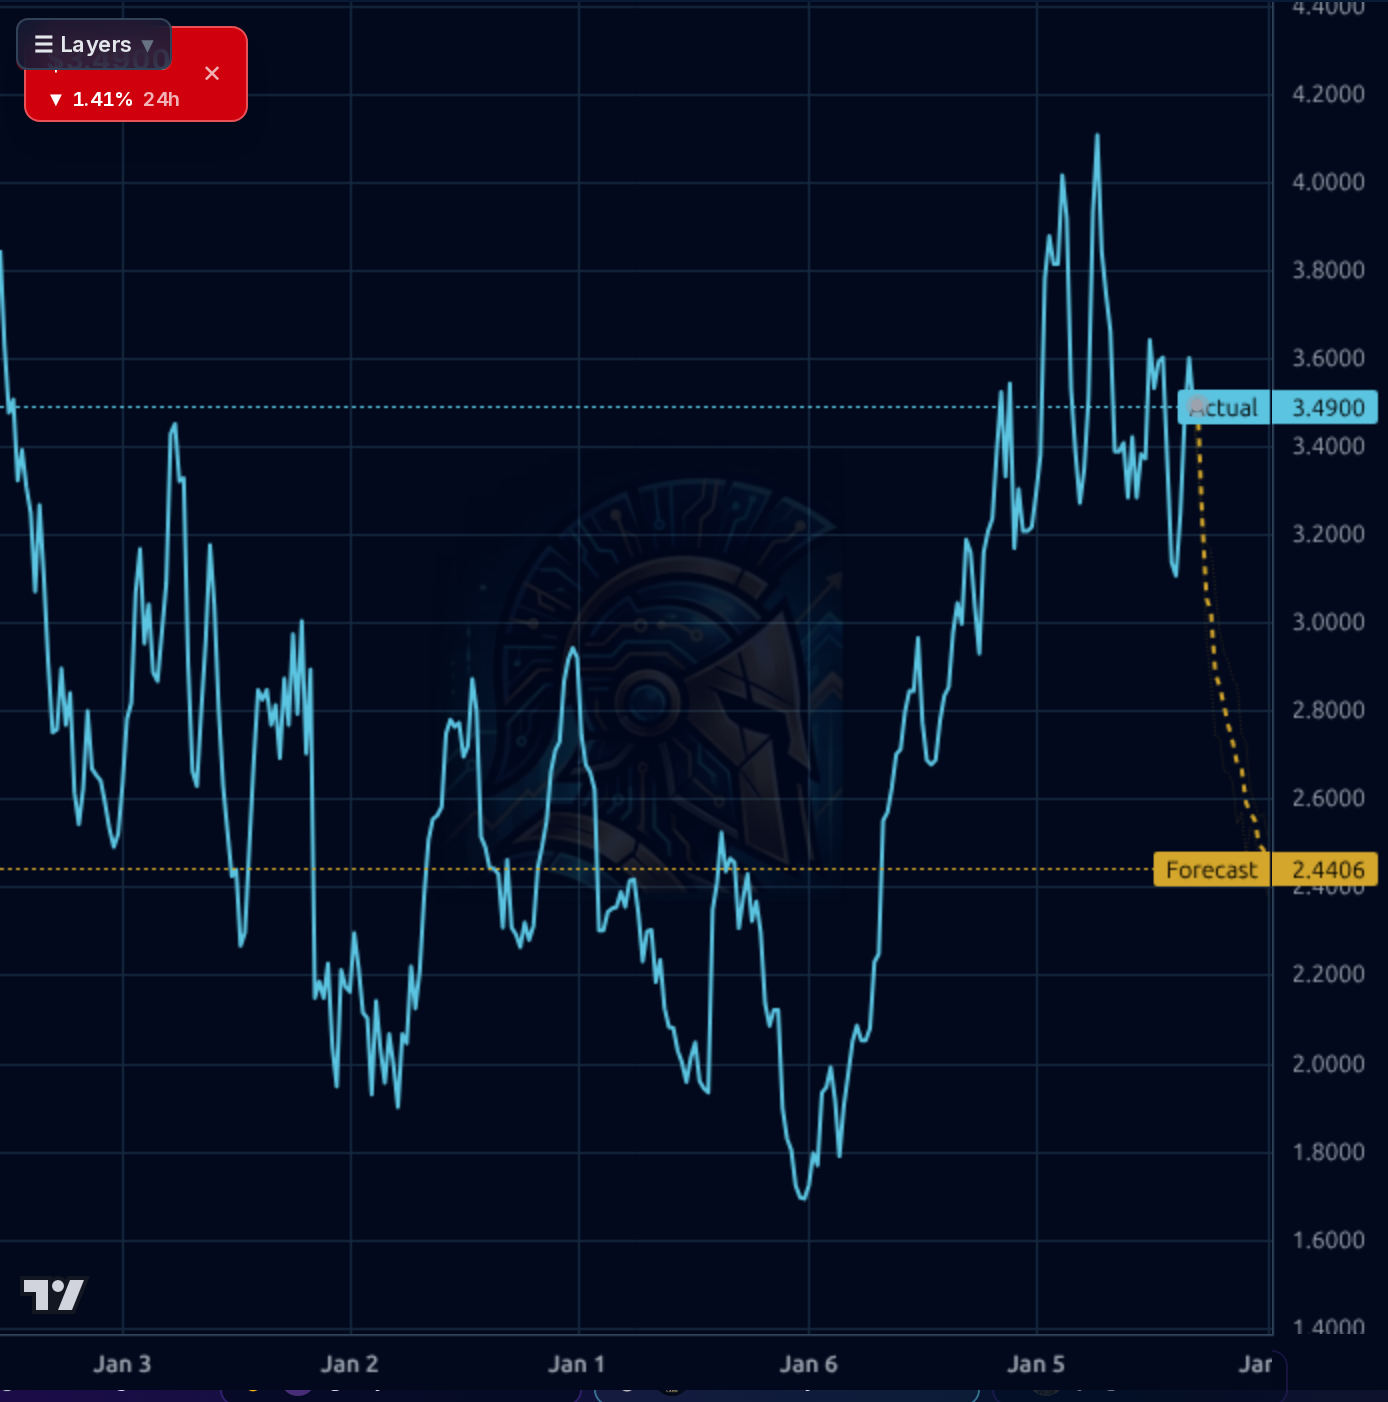
Across timeframes the picture is mixed-to-mildly-constructive. The 1h chart shows BBD chopping in a $3.46–$3.55 range after peaking near $3.65 in early Sep, with the current $3.49 print sitting at short-term support. The 4h view shows the stock has recovered from an early-Sep low near $3.30 back to $3.49, having failed to hold prior structure near $3.60–$3.65. The 1d chart is the most constructive: BBD has broken the multi-month downtrend from the April $4.10 high and is now +5.3% above SMA20 and +2.3% above SMA50, though still -2.3% below SMA200 and -18.5% off the 52-wk high. The weekly chart shows a multi-year uptrend from the 2023 lows near $1.70 that remains intact. RSI(14) at 56.8 is neutral-bullish with room to run. The model's forecast band is bearish on the 1wk view (target $2.44) but this forecast is materially unreliable — 33% directional accuracy vs 83% naive baseline — so it should be heavily discounted. The 4h forecast shows a modest bounce to $3.72, which aligns better with the price action. Key levels: support $3.40 (SMA50 zone) then $3.30 (early-Sep low); resistance $3.55–$3.65 (recent range top), then $3.80–$4.10 (weekly range).
Signal: Analyst rating upgraded from 2.33 to 2.00 on 9/8 (consensus target $4.63, ~32% upside from spot), and a Simply Wall St piece cited a fair-value fine-tune to R$22.62 for BBDC4 — modest but consistent with the improving earnings backdrop. Also material: a cluster of executive open-market sales in early September totaling ~$2.1M (CFO $1.3M, another officer $463k, plus smaller sells), which is a mild negative but relatively small in dollar terms and could reflect diversification rather than a directional view. Noise: retail social sentiment is 100% bullish among tagged messages but the sample size is tiny (4 messages), and most posts are options-promo spam that should be disregarded. The upcoming 10/5 ex-dividend date is a minor near-term technical factor (~$0.06 step-down).
- Continued net margin expansion — from 19.7% (Q3'25) to 22.2% (Q2'26), if sustained implies further EPS beats
- Analyst consensus upgrade (2.33 → 2.00 on 9/8) with $4.63 price target suggests sell-side is warming to the recovery story
- Forward dividend yield estimate of 8.5% ($0.30) versus TTM 6.83% ($0.24) indicates payout growth expected
- Potential value-unlock from subsidiary listings (payments network) referenced in prior thesis — pending timeline confirmation
- TTM sales growth of +32.4% Y/Y and EPS Y/Y TTM +27.7% suggest operating leverage on the recovery
- Cluster of executive open-market sells in early September (~$2.1M including CFO $1.3M) — mild negative sentiment signal
- High leverage (D/E 4.62x, LT D/E 2.25x) makes BBD sensitive to Brazilian macro shocks and credit-cycle turns
- Lumpy operating cash flow (-R$52.6B Q2'26 after +R$86.2B Q1'26) — bank-specific but adds noise for equity investors
- Risk-off market backdrop (breadth 44% >200dMA and deteriorating) reduces appetite for EM financials
- AI model forecasts unreliable (1wk directional accuracy 33% vs 83% naive baseline) — timing signals are weak here
- BRL / Selic policy volatility can swing USD ADR returns independent of fundamentals
- Under-earns vs Itaú (ROA 1.06%, profit margin 6.15%) — franchise quality gap persists
Get AI analysis on any stock
This is one of hundreds of Kronos AI reports — scored fundamentals & technicals, bull/base/bear price targets, a multi-horizon plan, and continuously-updated forecasts across the market. Create a free account to explore them all.
Create your free account →Already a member? Sign in · Join our Discord