BBIO — AI Stock Forecast & Price Targets
Published 8/4/2026 · A free sample of K3vl4r’s AI-powered analysis.
Kronos price forecasts, scored fundamentals & technicals, and a multi-horizon plan.
View the live BBIO price forecast →
BBIO's technical chart shows strong momentum above $79 with a 3.58% daily gain, but fundamentals reveal severe negative margins (-124.41%) and high debt ($2.5B), offset by promising pipeline advances like Encaleret's FDA acceptance for ADH1. The stock is trading near its 52-week high ($93.42) with aggressive short interest (15.22%), creating a volatile environment where positive catalysts could trigger sharp moves.
Wait for earnings (Aug 10) — if positive, buy near $79.94; invalidation at $75.00 due to short interest pressure
Hold through Q3 with target of $85.00 by end of year; catalysts include FDA decisions on Encaleret and BBP-418. Change mind if negative clinical data emerges or cash burn exceeds runway.
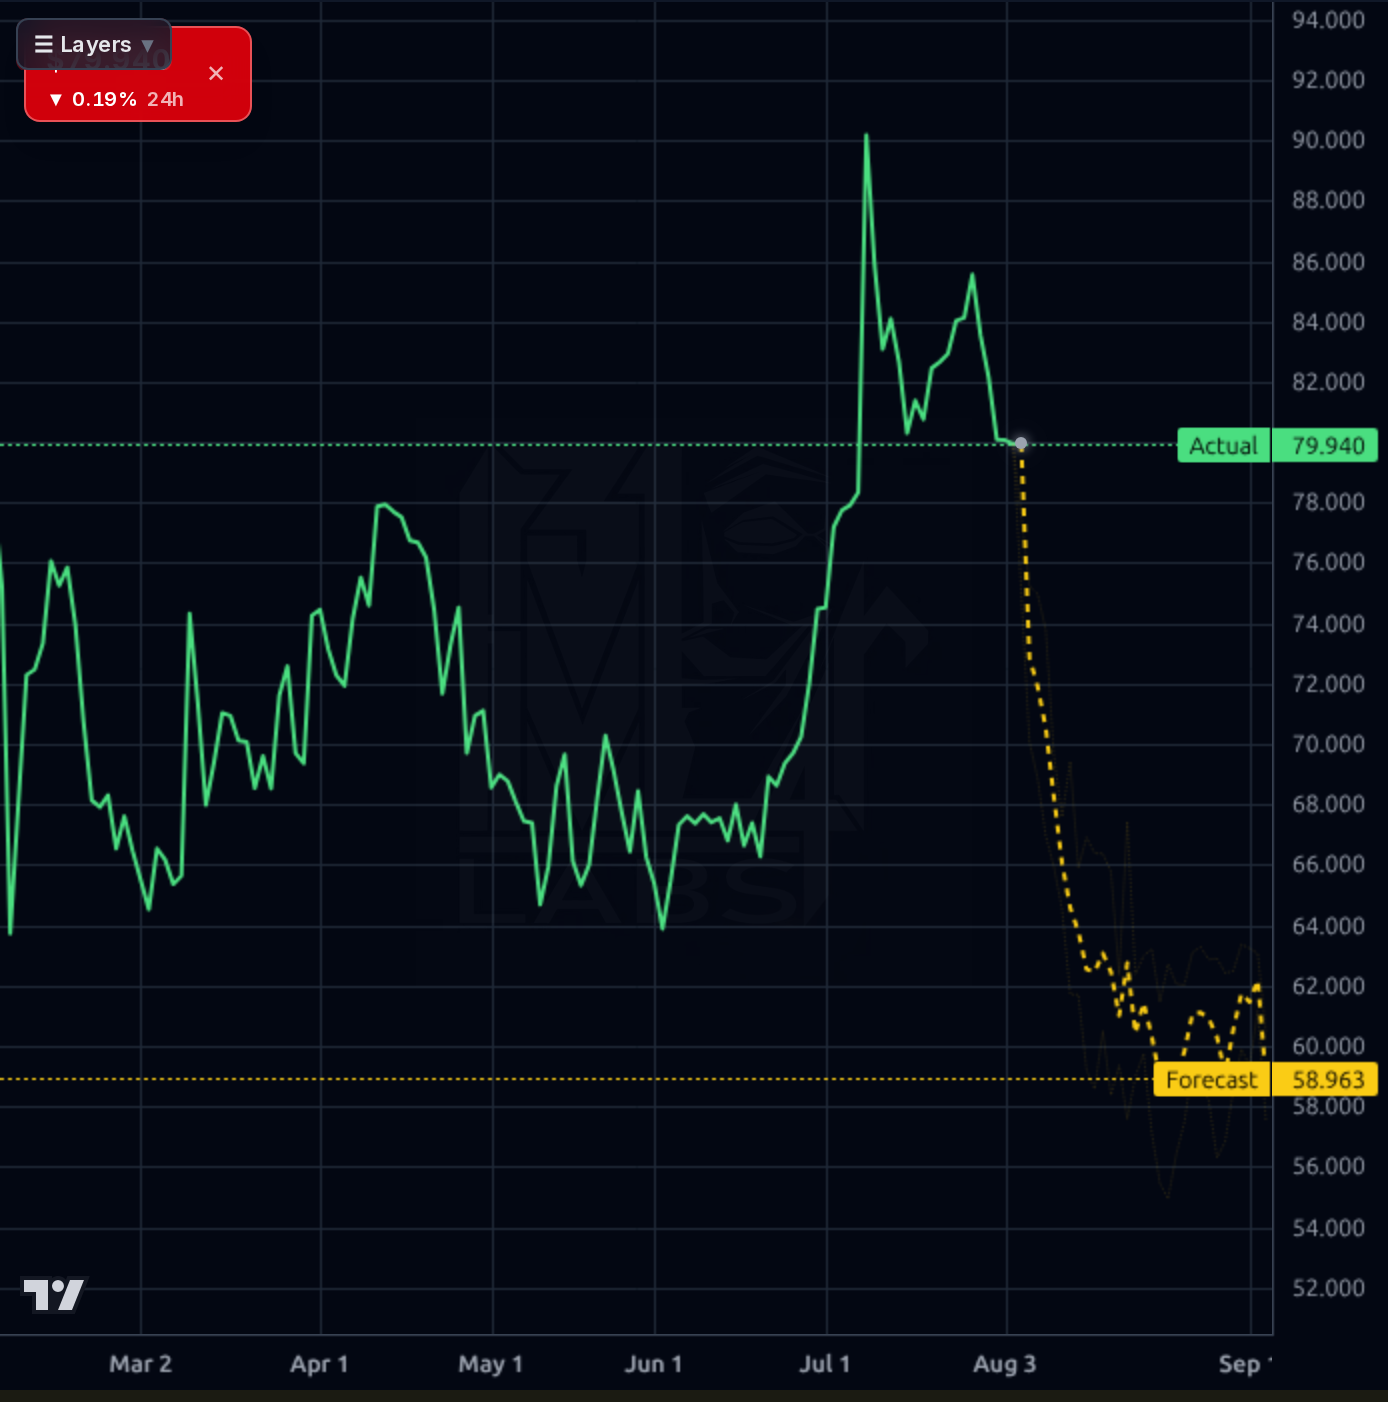
Terminal thesis: $93.42 (52-week high) as the market prices in successful pipeline outcomes. Structural risk is regulatory delays or failed trials, which could trigger a sharp correction to $58.963
Revenue has surged 355% YoY to $579.96M, driven by strong sales growth (66.78% QoQ), but operating and net margins are severely negative (-86.94%, -124.41%). The balance sheet shows high debt ($2.5B) with a current ratio of 1.52, indicating liquidity pressure. Cash flow is negative (-$317.9M), reflecting heavy R&D investment. Capital allocation prioritizes pipeline advancement over profitability, with no dividends or buybacks. What's working: strong sales growth and high gross margins; what's broken: unsustainable negative operating margins and debt levels.
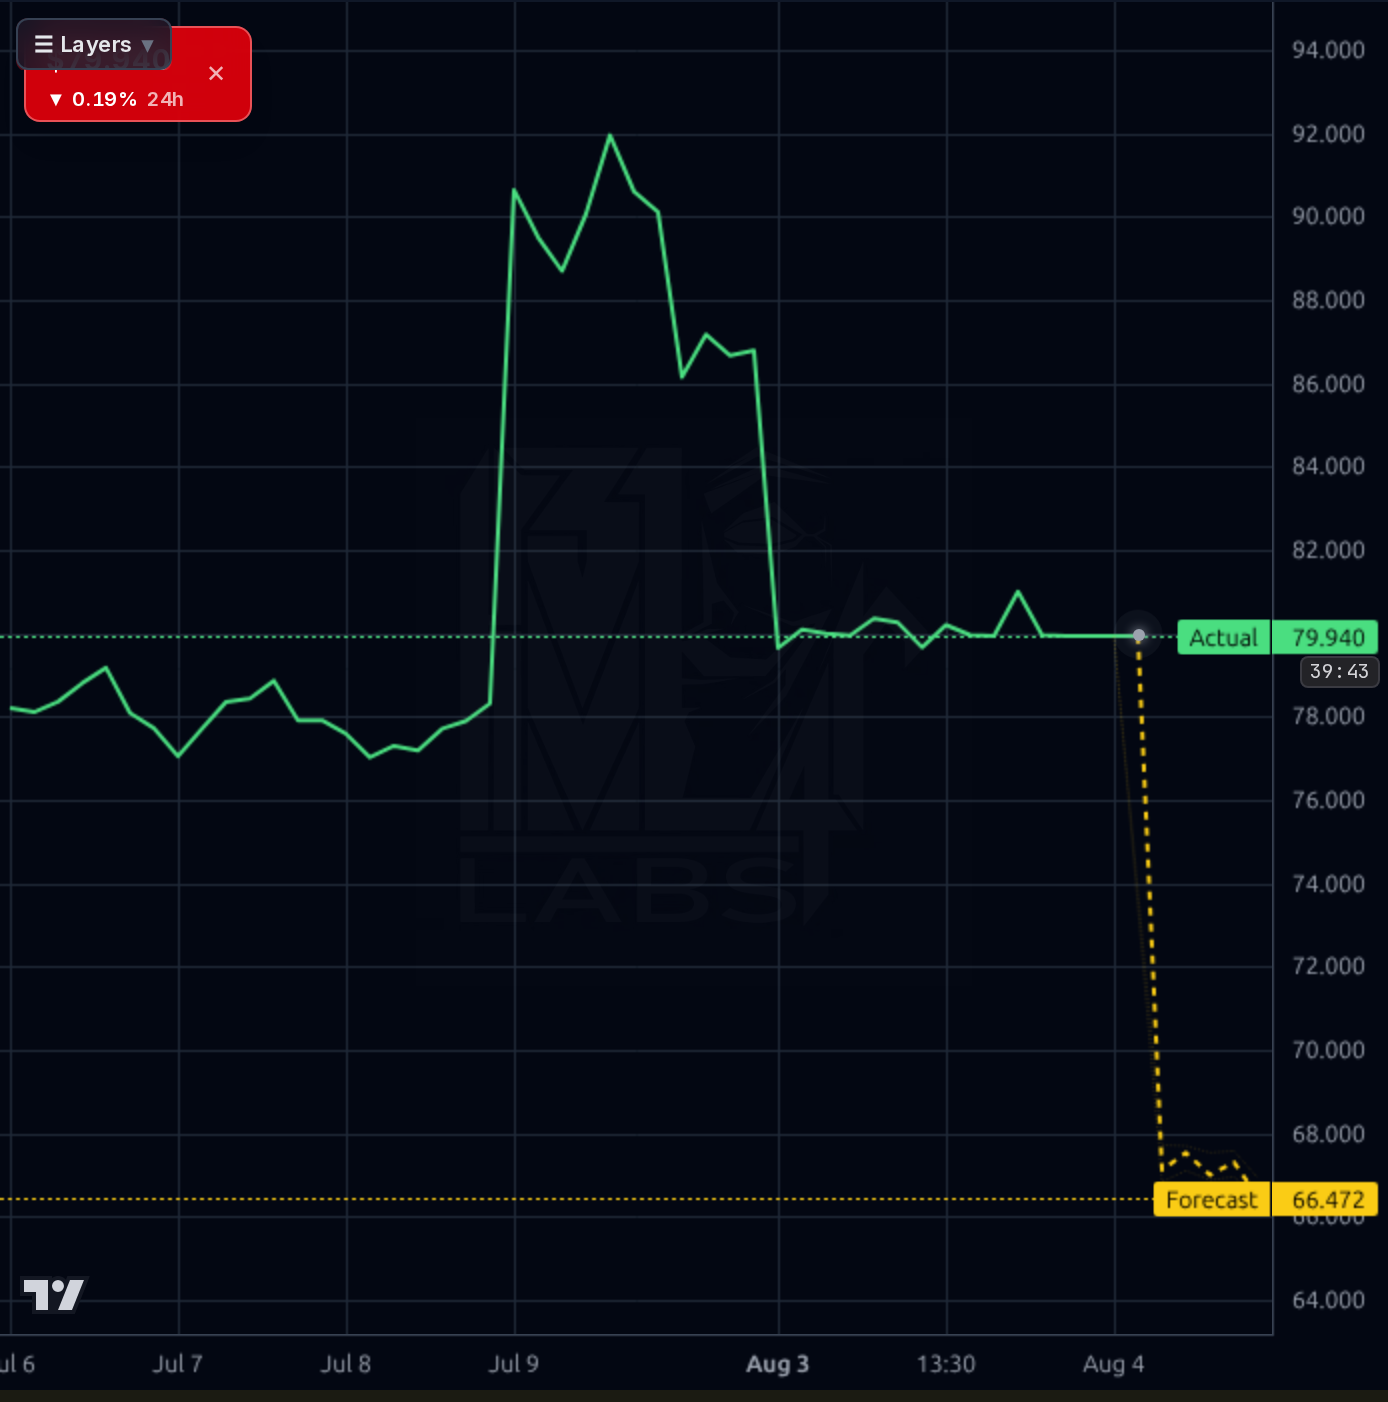
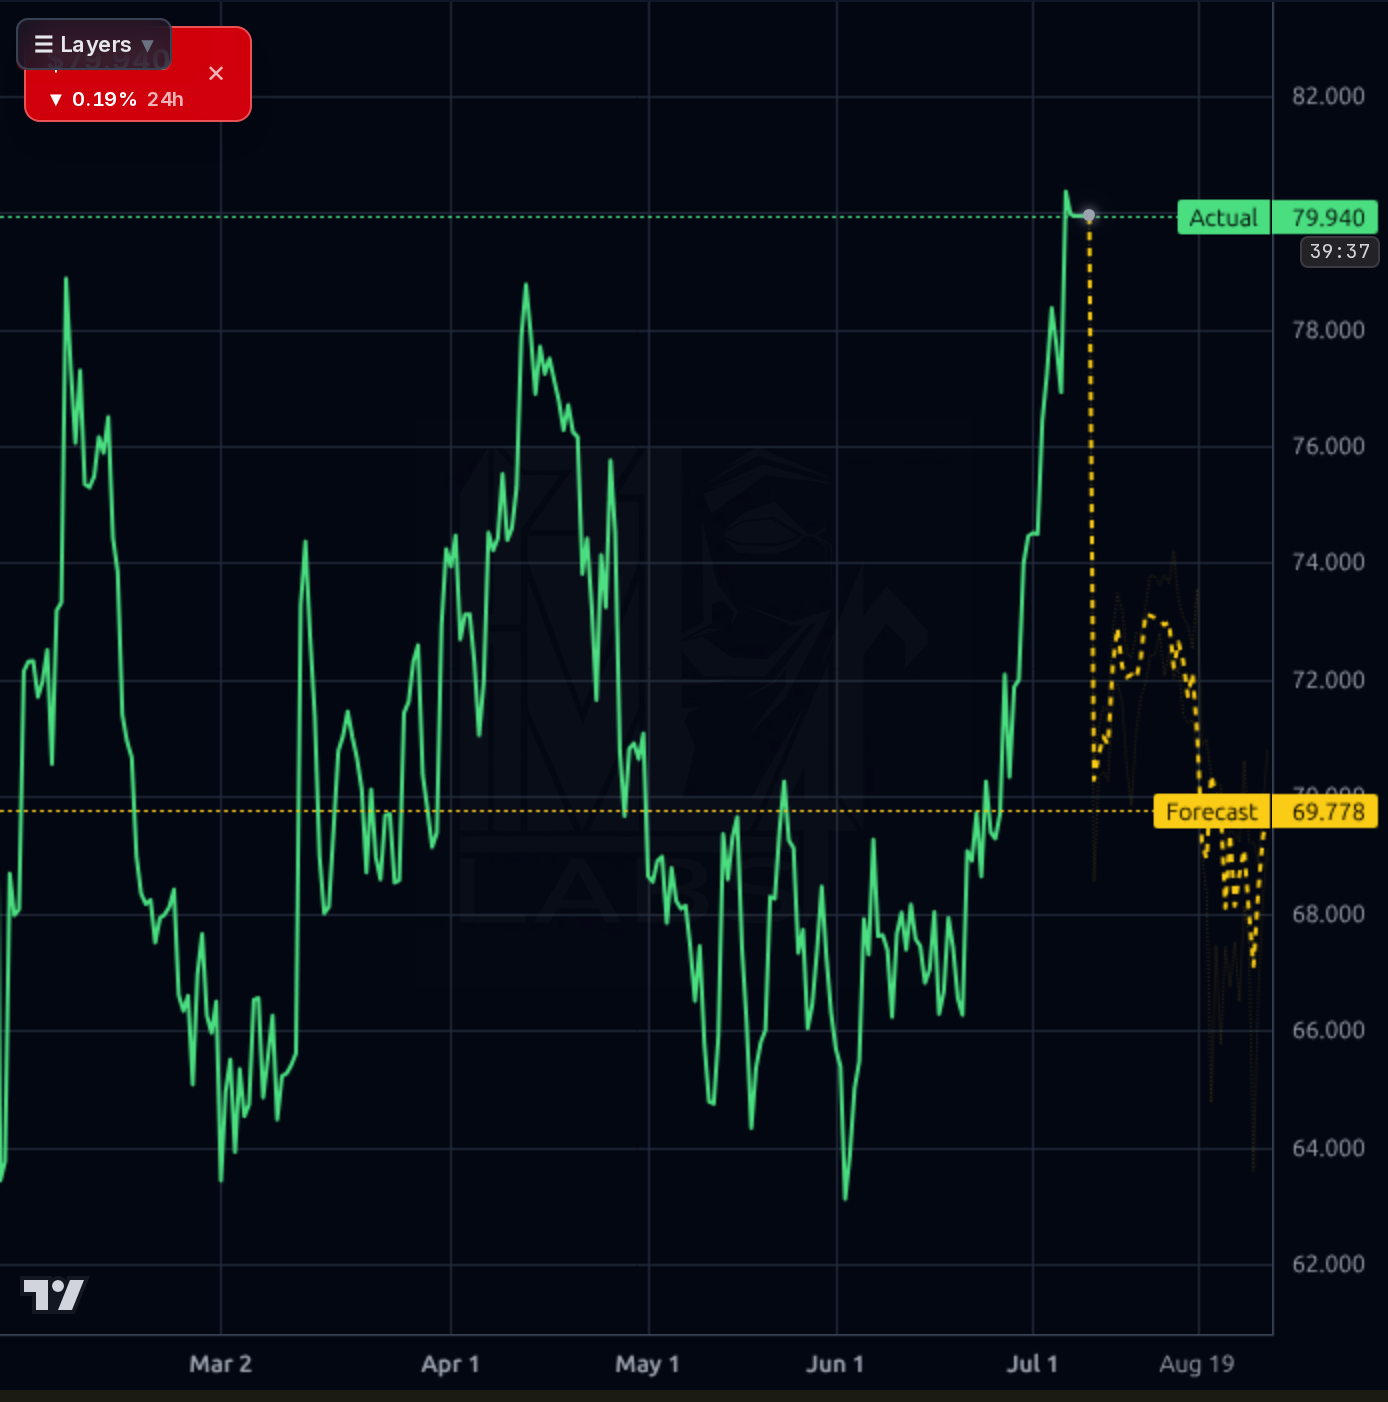
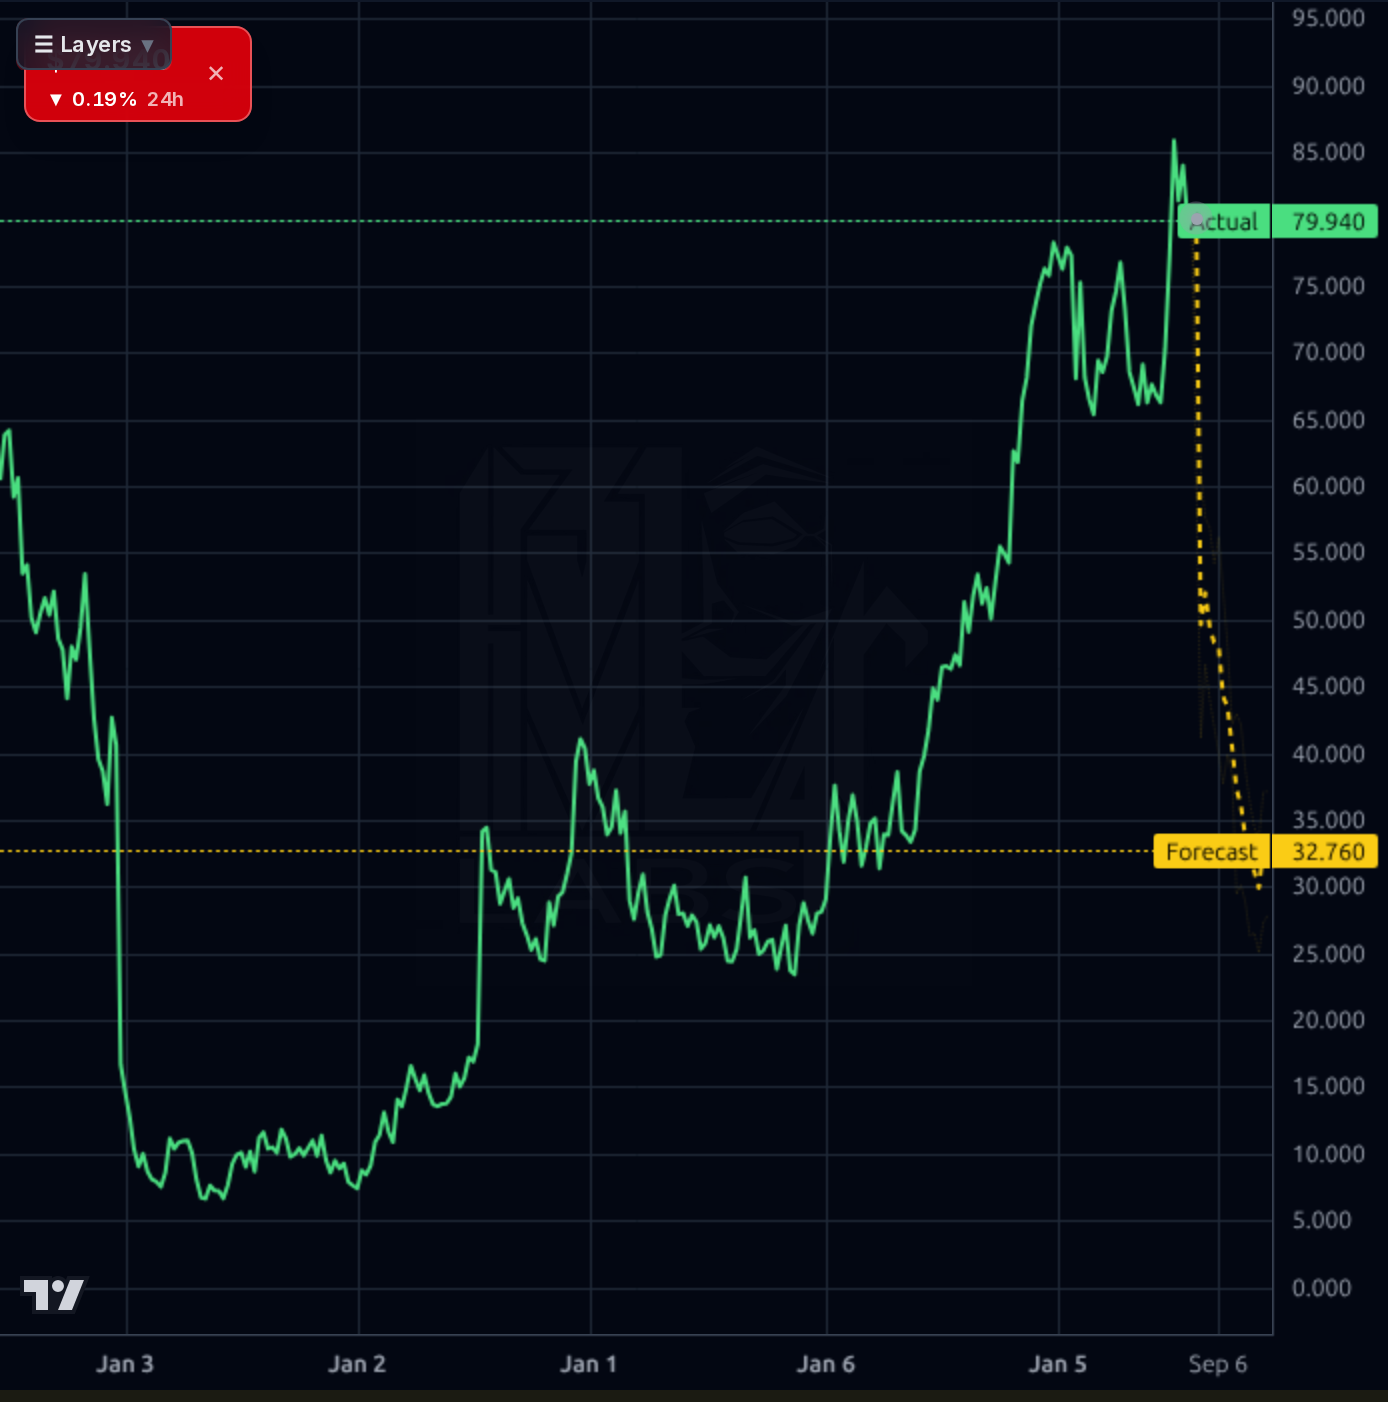
The chart shows a bullish trend above $79 with recent volatility around the 52-week high ($93.42). Support is at $79.94 (actual price), with resistance near $80.09 (previous close) and $93.42 (52-week high). The Kronos AI forecast band shows a downward trajectory from $79.94 to $58.963, indicating potential downside risk if momentum breaks. RSI at 50.56 suggests neutral momentum, but the short-term volatility and aggressive short interest (15.22%) create high uncertainty.
Key news includes FDA acceptance of Encaleret for ADH1 (Aug 4), which is a major positive catalyst. The $2.21B stock filing (Aug 3) adds liquidity concerns, while the upcoming earnings report (Aug 10) is a binary event with high IV crush risk. Citigroup's target price increase to $93.00 provides upside potential but must be weighed against negative margins and debt.
- FDA acceptance of Encaleret for ADH1 (Aug 4) validates core science and provides near-term catalyst
- BBP-418 FDA decision expected by May 2027 drives long-term growth potential
- Negative operating margins (-86.94%) threaten liquidity if cash burn exceeds runway
- High short interest (15.22%) creates volatility risk during minor setbacks
- Regulatory delays or failed trials could trigger severe correction to $58.963
Get AI analysis on any stock
This is one of hundreds of Kronos AI reports — scored fundamentals & technicals, bull/base/bear price targets, a multi-horizon plan, and continuously-updated forecasts across the market. Create a free account to explore them all.
Create your free account →Already a member? Sign in · Join our Discord