BBVA — AI Stock Forecast & Price Targets
Published 8/4/2026 · A free sample of K3vl4r’s AI-powered analysis.
Kronos price forecasts, scored fundamentals & technicals, and a multi-horizon plan.
View the live BBVA price forecast →
BBVA's strong fundamentals and recent capital raising are offset by technical overextension and near-term earnings uncertainty. The stock trades at attractive valuation metrics but faces significant short-term volatility ahead of its October 2026 earnings report. Recent Q2 results show robust growth, yet the chart indicates a potential pullback toward forecast bands.
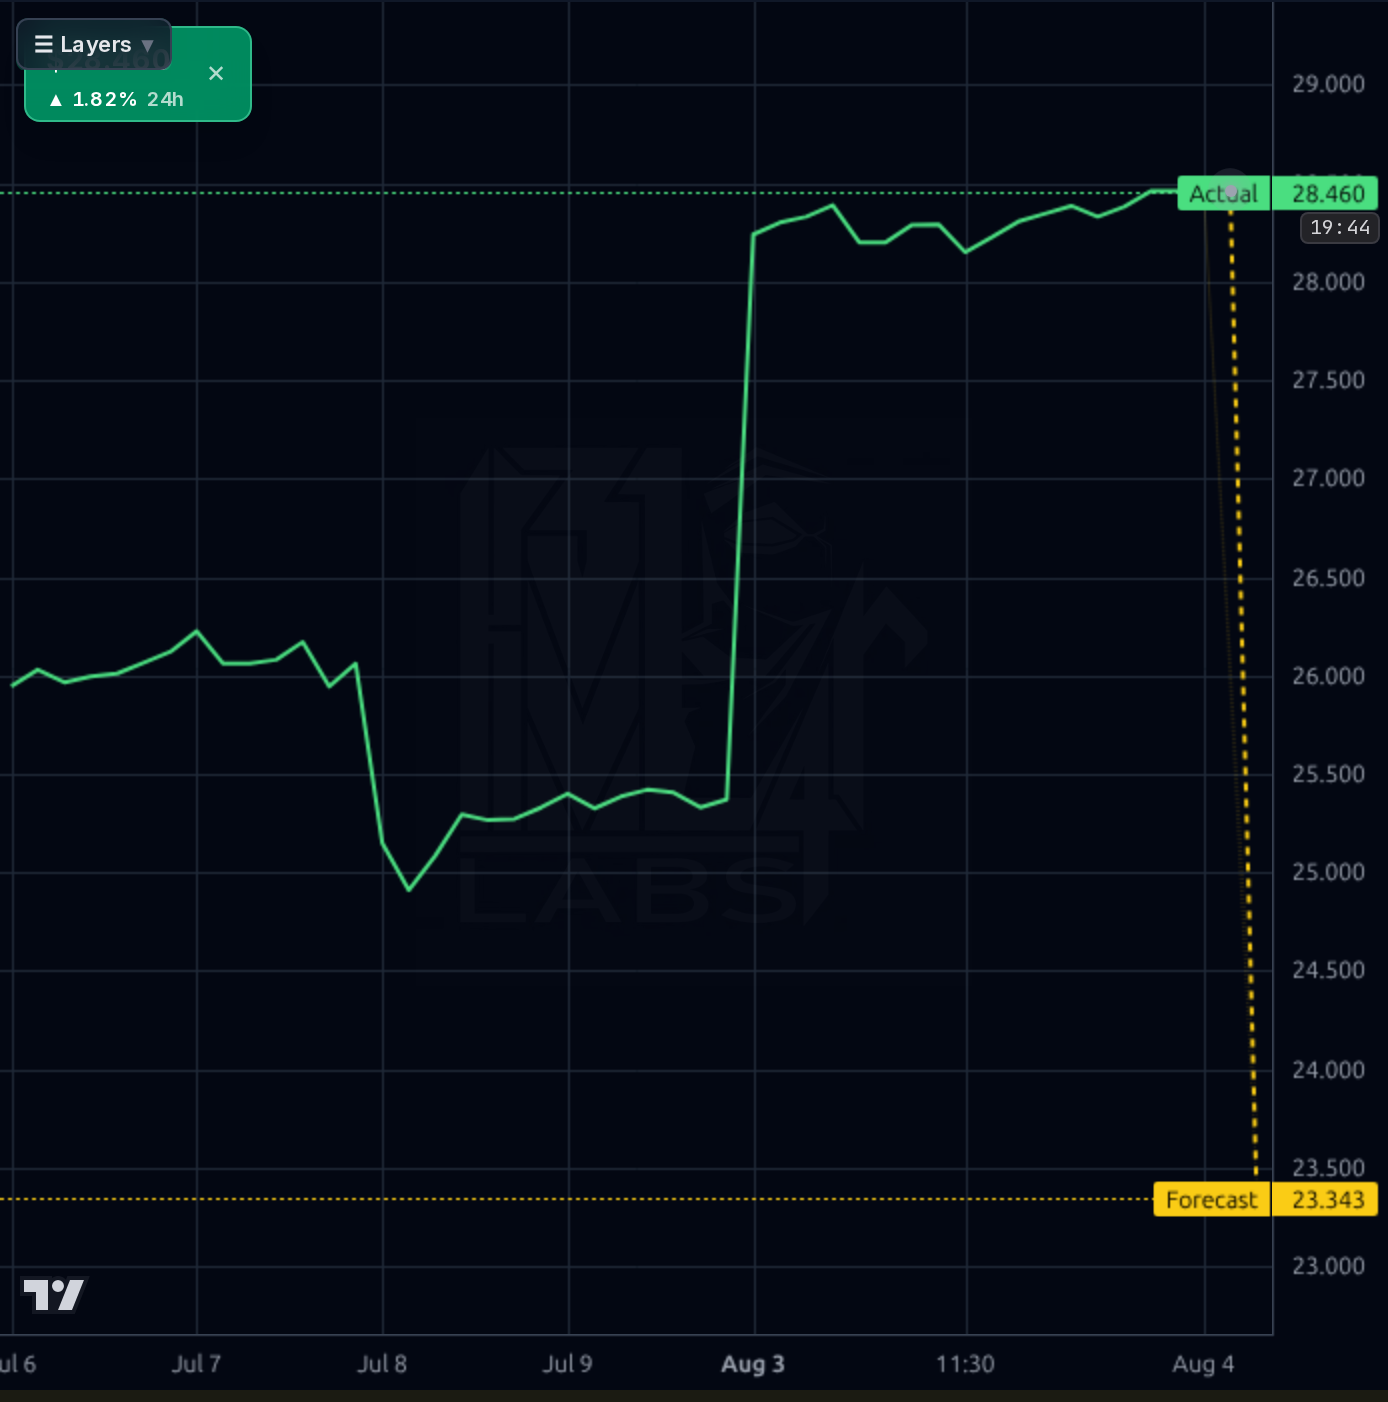
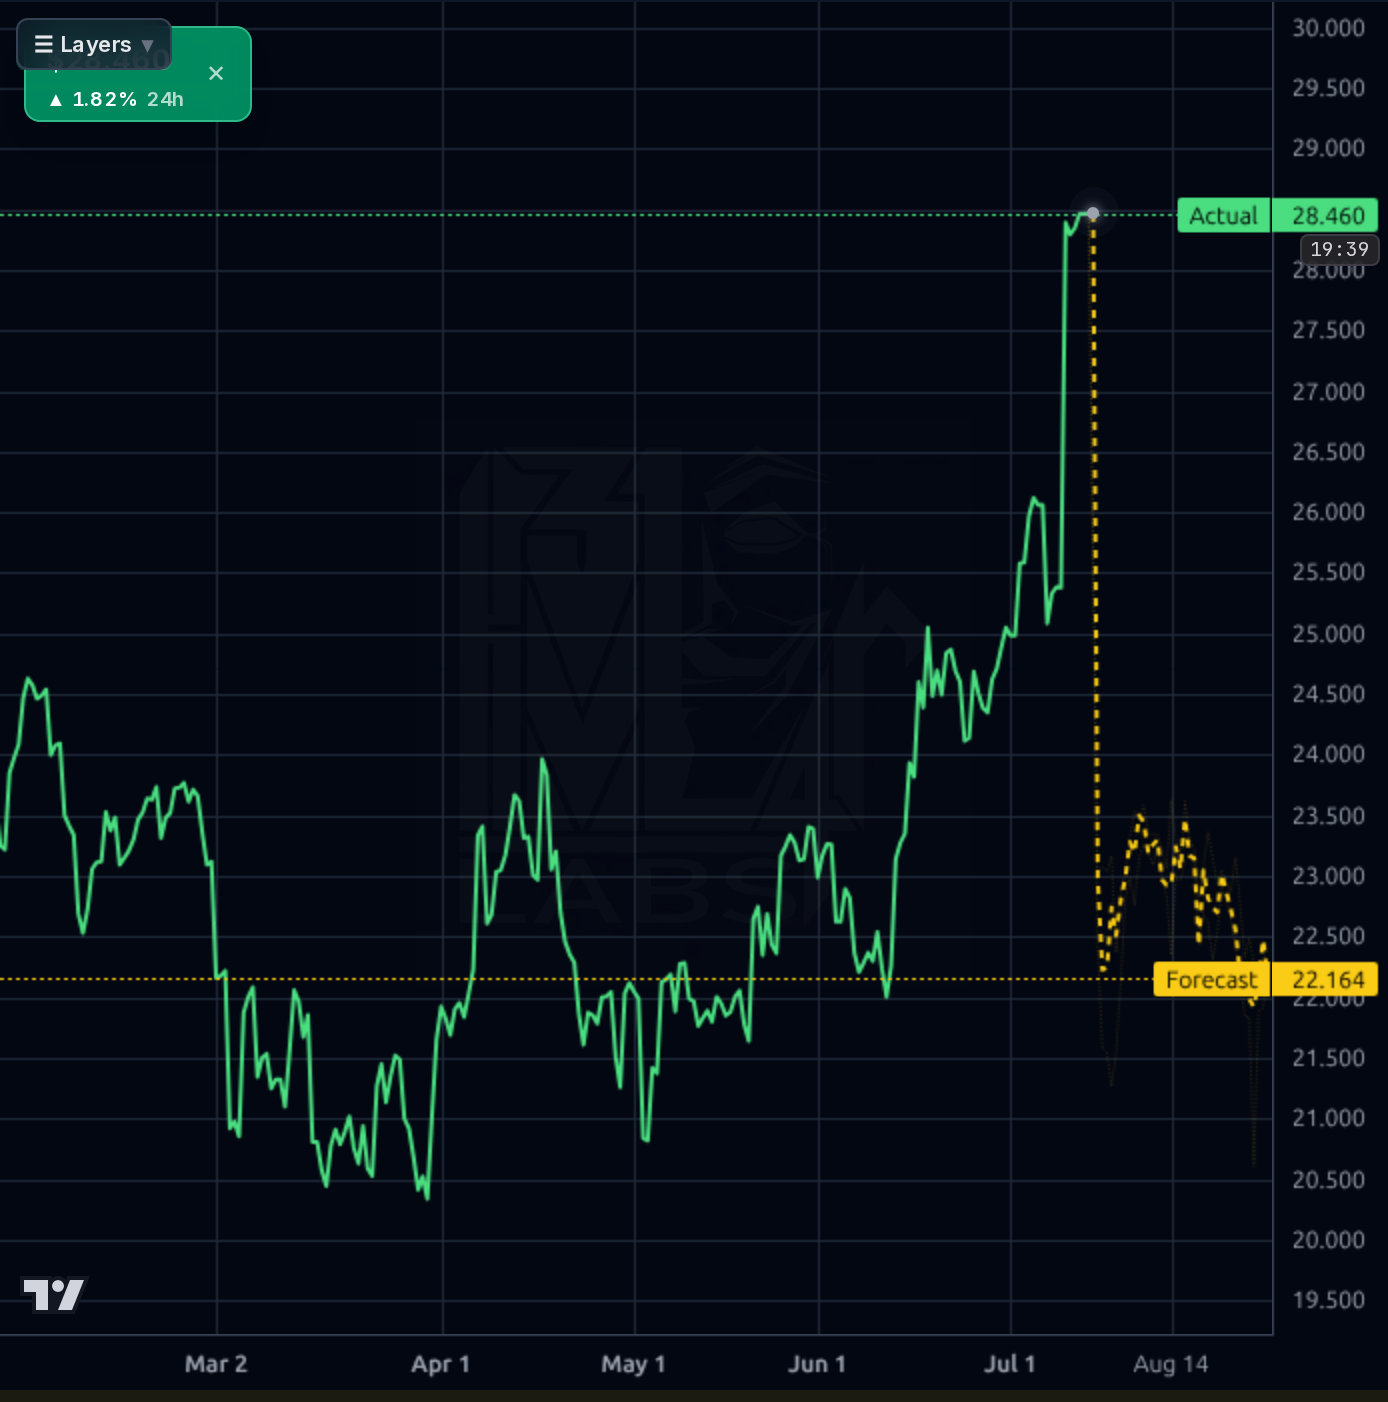
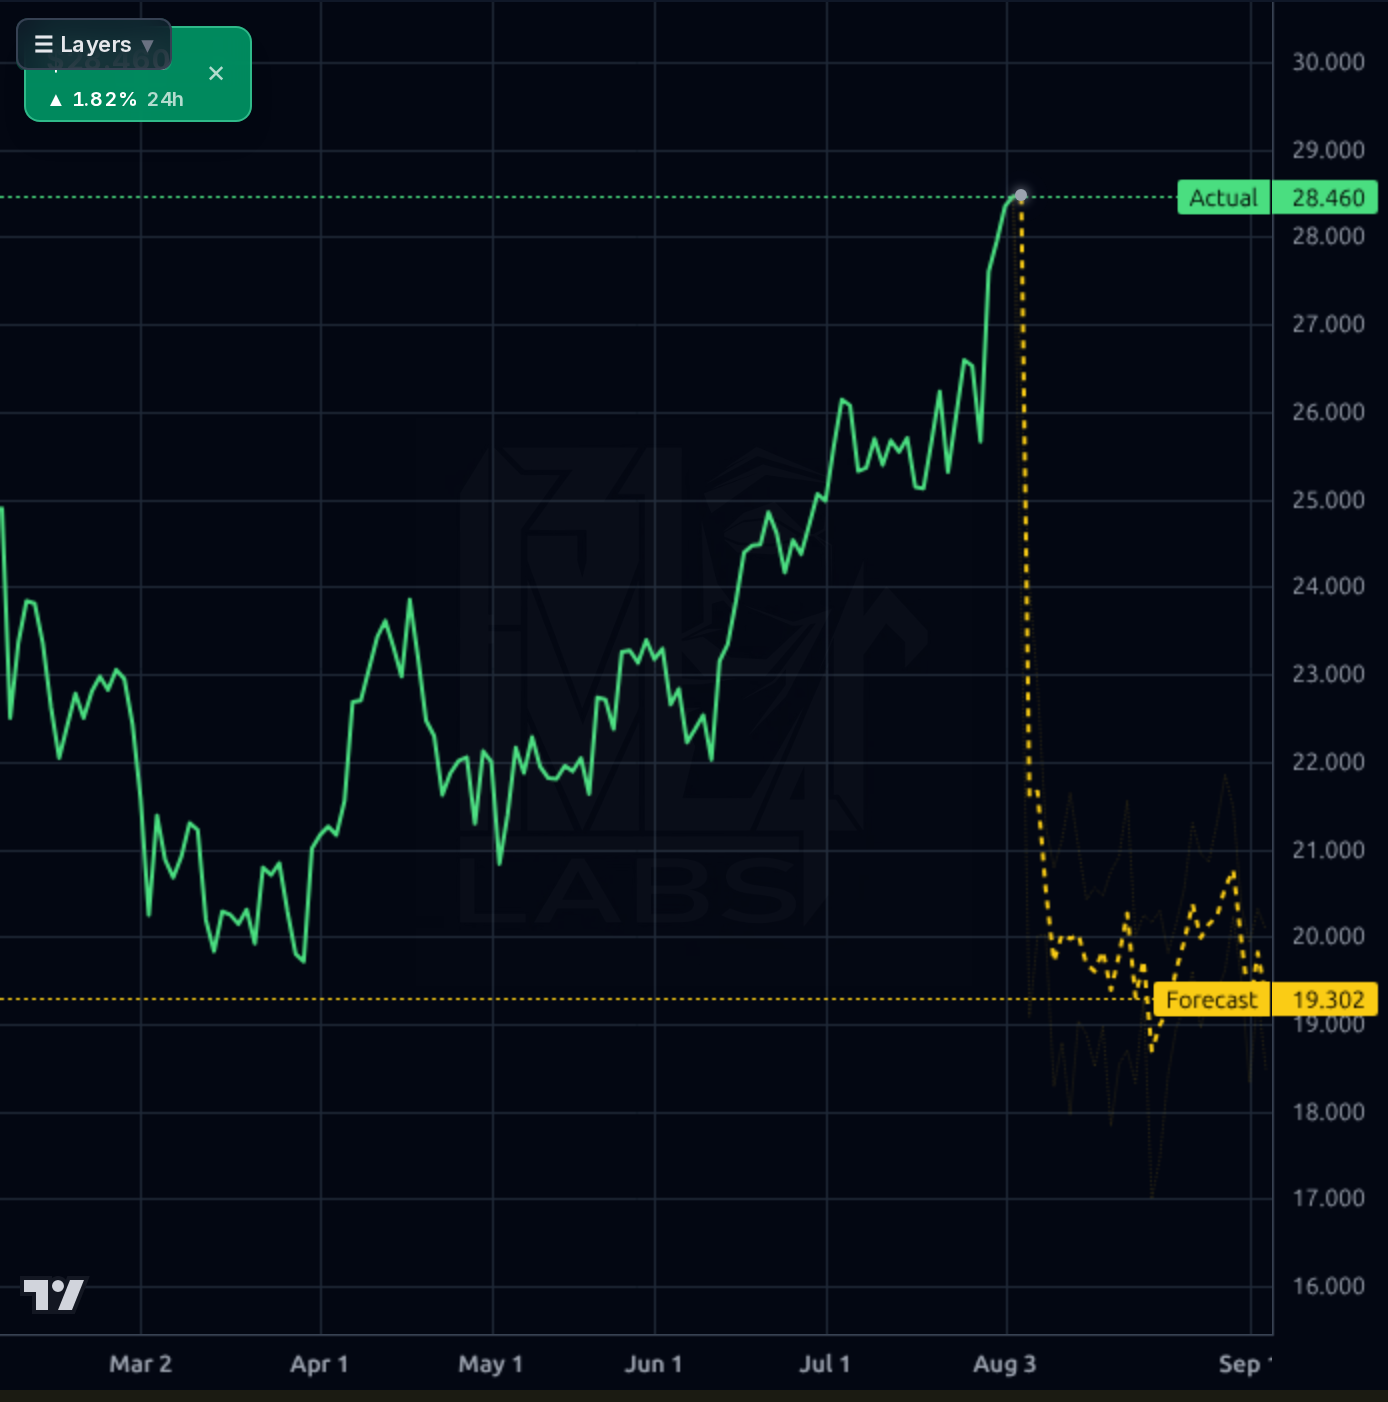
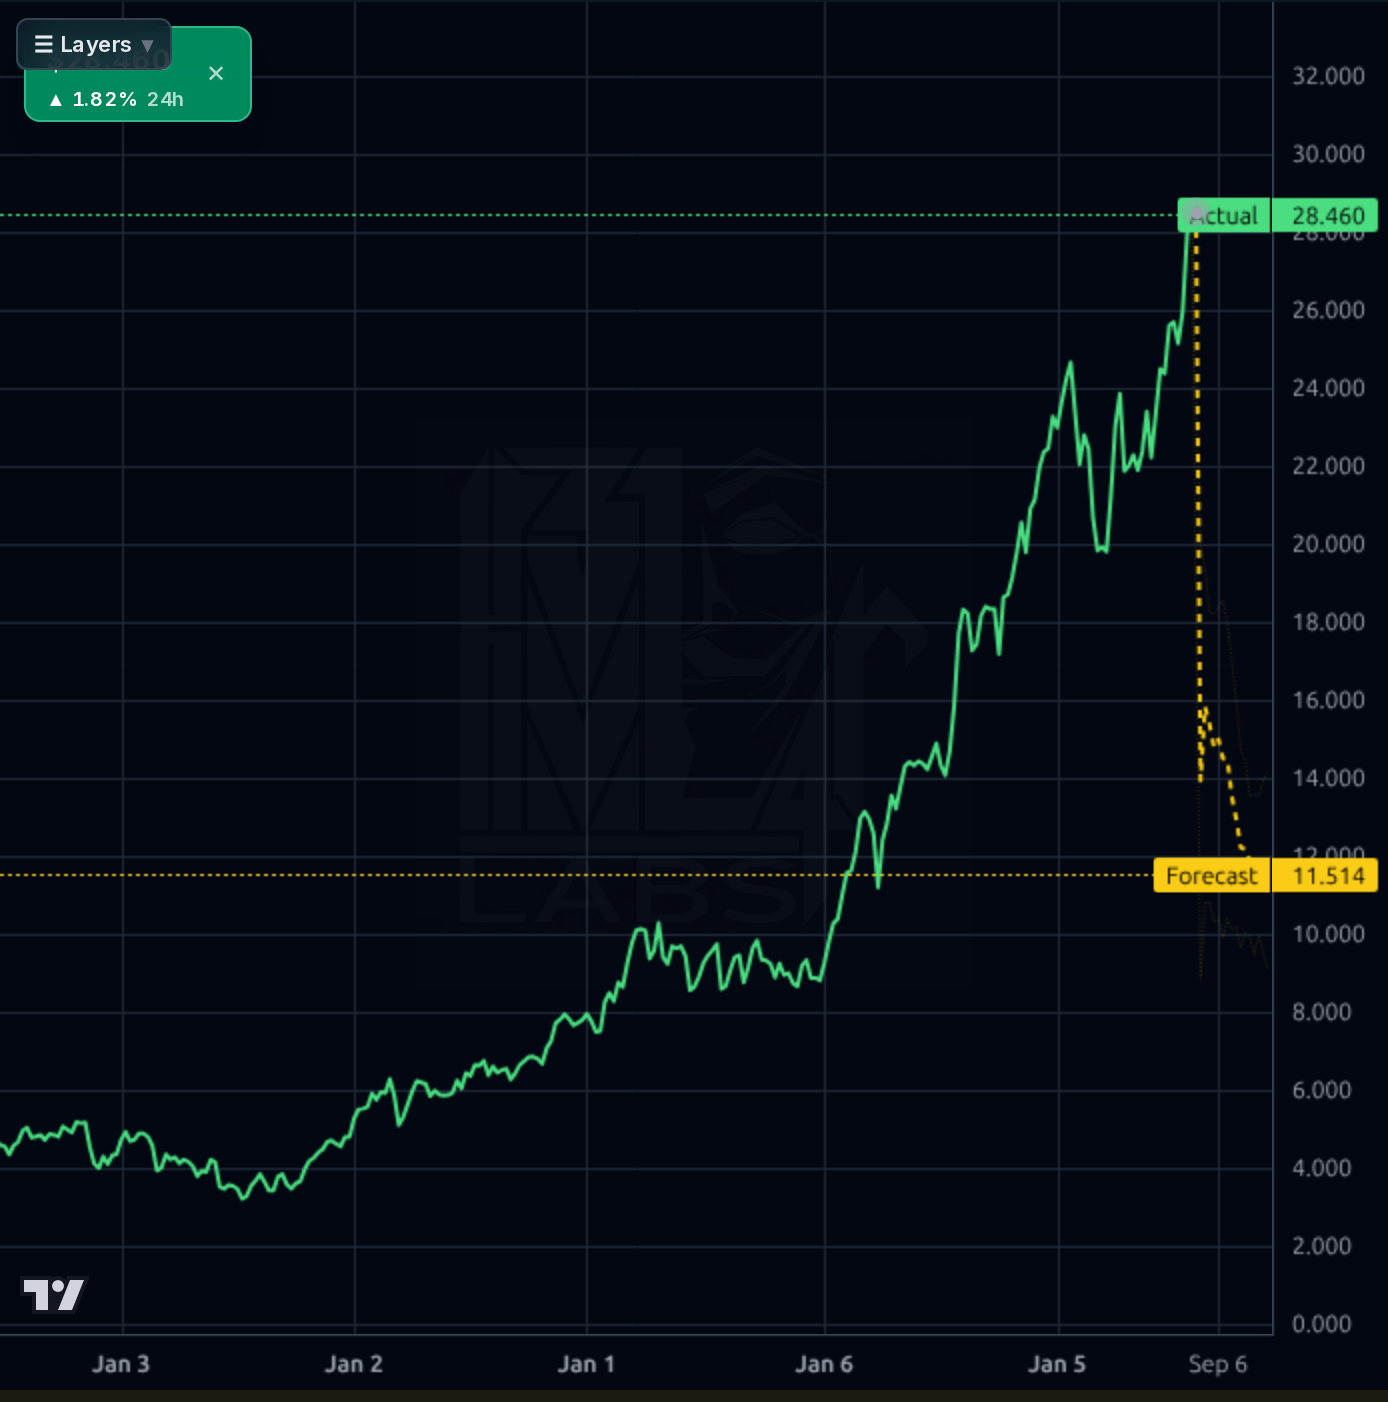
Hold near $28.46; invalidation below $27.95 would trigger a trim. Target the lower forecast band ($19.30) if momentum fades, but current RSI (68.99) suggests no immediate pullback risk. Monitor short interest for any spike.
Accumulate on dips to $24.80; catalysts include Q4 earnings and potential share repurchase execution. Expected return range: 15-20% over 6 months if technical resistance holds. Change of mind if the forecast band breaks below $19.30 or short interest rises above 1.0%.
Terminal thesis: BBVA's international expansion (especially in Mexico and Spain) will drive sustainable growth, with a target price of $35.00 by 2028. Structural risk is regulatory headwinds in key markets, but the company's strong capital position mitigates this risk.
Revenue grew 24.99% QoQ to $10.5B, driven by strong loan growth (17.7% YoY) in Spain and Mexico. Net margins expanded to 29.15%, supported by efficient capital management with a current ratio of 0.28. The balance sheet shows healthy liquidity ($108.5B cash), though debt-to-equity is high at 3.44. Capital allocation remains strong with a dividend yield of 3.86% and an extraordinary €2B share repurchase program announced in Q2. However, the forward P/E of 11.50 suggests valuation may be stretched relative to historical averages.
The chart shows a sharp breakout above $28.40 with recent price action near the upper forecast band (Actual: $28.46). The 20-day SMA is at 8.90% and 50-day at 15.03%, indicating upward momentum but with technical resistance near $28.46. The model's forecast bands show a potential pullback toward the lower band ($19.30) if momentum fades, though current RSI (68.99) suggests no immediate overbought condition. Short interest is low at 0.64%, but the recent 24h gain of 1.82% indicates short-term volatility.
BBVA reported record Q2 earnings ($3.06B net profit, +11.4% YoY) with strong loan growth in key markets. The $28.46 price action aligns with the recent breakout above the 52-week high of $28.39. However, the yen surge and regulatory concerns (e.g., Spanish bribery allegations) introduce noise. The stock's current valuation (forward P/E 11.50) appears attractive but is vulnerable to technical corrections.
- Record Q2 loan growth of 17.7% YoY driven by Spain (7.4%) and Mexico (near 10%)
- €2 billion extraordinary share repurchase program announced in Q2
- Technical overextension near $28.46; potential pullback toward forecast band ($19.30)
- Regulatory headwinds from Spanish bribery allegations and yen volatility
Get AI analysis on any stock
This is one of hundreds of Kronos AI reports — scored fundamentals & technicals, bull/base/bear price targets, a multi-horizon plan, and continuously-updated forecasts across the market. Create a free account to explore them all.
Create your free account →Already a member? Sign in · Join our Discord