BDC — AI Stock Forecast & Price Targets
Published 7/14/2026 · A free sample of K3vl4r’s AI-powered analysis.
Kronos price forecasts, scored fundamentals & technicals, and a multi-horizon plan.
View the live BDC price forecast →
Belden has sold off hard (-20.5% quarter, -12.3% YTD) into an oversold RSI of 33.8, now trading at $102.26 with a forward P/E of ~10.6x and PEG of 0.91 despite double-digit revenue growth and a fresh RUCKUS acquisition closing July 1. The setup is attractive on valuation and analyst posture (mean recom 1.00, avg PT $148.67), but Q1 free cash flow turned negative (-$63M), debt/equity sits at 107%, and a binary earnings print lands July 30 — argues for measured accumulation rather than aggressive entry.
Do NOT chase the forecast bounce ahead of the July 30 earnings print — that is the binary catalyst and IV crush risk is real. A starter position (1/3 target size) here at $102 with a hard stop below $99 (breach of 52W low invalidates) is defensible for a mean-reversion trade to $110-115. Better risk/reward: wait for the print. Above-consensus results with FCF recovery could open a fast move to $118; a miss with continued cash-flow weakness likely retests $95 and lower. Explicitly: earnings is the invalidation for any pre-print swing.
Over 1-6 months the thesis is a valuation re-rating from 10.6x forward P/E toward the sector's mid-teens as RUCKUS synergies show up in reported numbers and operating cash flow normalizes. Expected return range: -10% to +25% (roughly $92 to $128). Catalysts: July 30 print, Q3 print showing FCF recovery, any deleveraging commentary. What would change my mind: two consecutive quarters of negative FCF, guidance cut, or debt covenant concerns given the 107% D/E in a still-elevated rate environment.
Belden is a picks-and-shovels play on data center densification, industrial automation, and 5G/FTTH buildout — the RUCKUS deal extends this into intelligent wireless networking. If integration works, the 12% forecast 5Y EPS growth is achievable and current $102 becomes a strong entry. Multi-year drivers: AI-driven data-center capex, industrial reshoring cable/connectivity demand, RUCKUS cross-sell. Biggest structural risk is that Belden is a levered cyclical trading like a growth story — a hard industrial capex downturn coinciding with the debt load could force dilutive equity issuance or forced deleveraging.
Revenue trajectory is healthy — TTM sales of $2.79B with Sales Y/Y TTM +9.28% and Q/Q +11.44%, and the last four quarters ($672M → $698M → $720M → $696M) show sustained scaling. Gross margin has held in a tight 36.6-38.5% band and operating margin near 11-12%, so unit economics are stable. ROE of 18.9% and ROIC of ~9% are respectable, and the trailing P/E of 17.2x with forward P/E of 10.6x and PEG 0.91 imply the market is pricing sharp EPS acceleration (forward EPS $9.63 vs trailing $5.94, +62%). The problems are on the balance sheet and cash conversion: total debt of $1.38B against equity of $1.28B (D/E 107%), and Q1 2026 operating cash flow swung to -$18.7M with FCF at -$63M after four prior positive quarters — a red flag likely reflecting working capital build and RUCKUS integration costs, but one that needs to reverse by Q2/Q3. Dividend is a rounding error (0.2% yield, 3.4% payout) — capital is going to M&A and debt service, not shareholders.
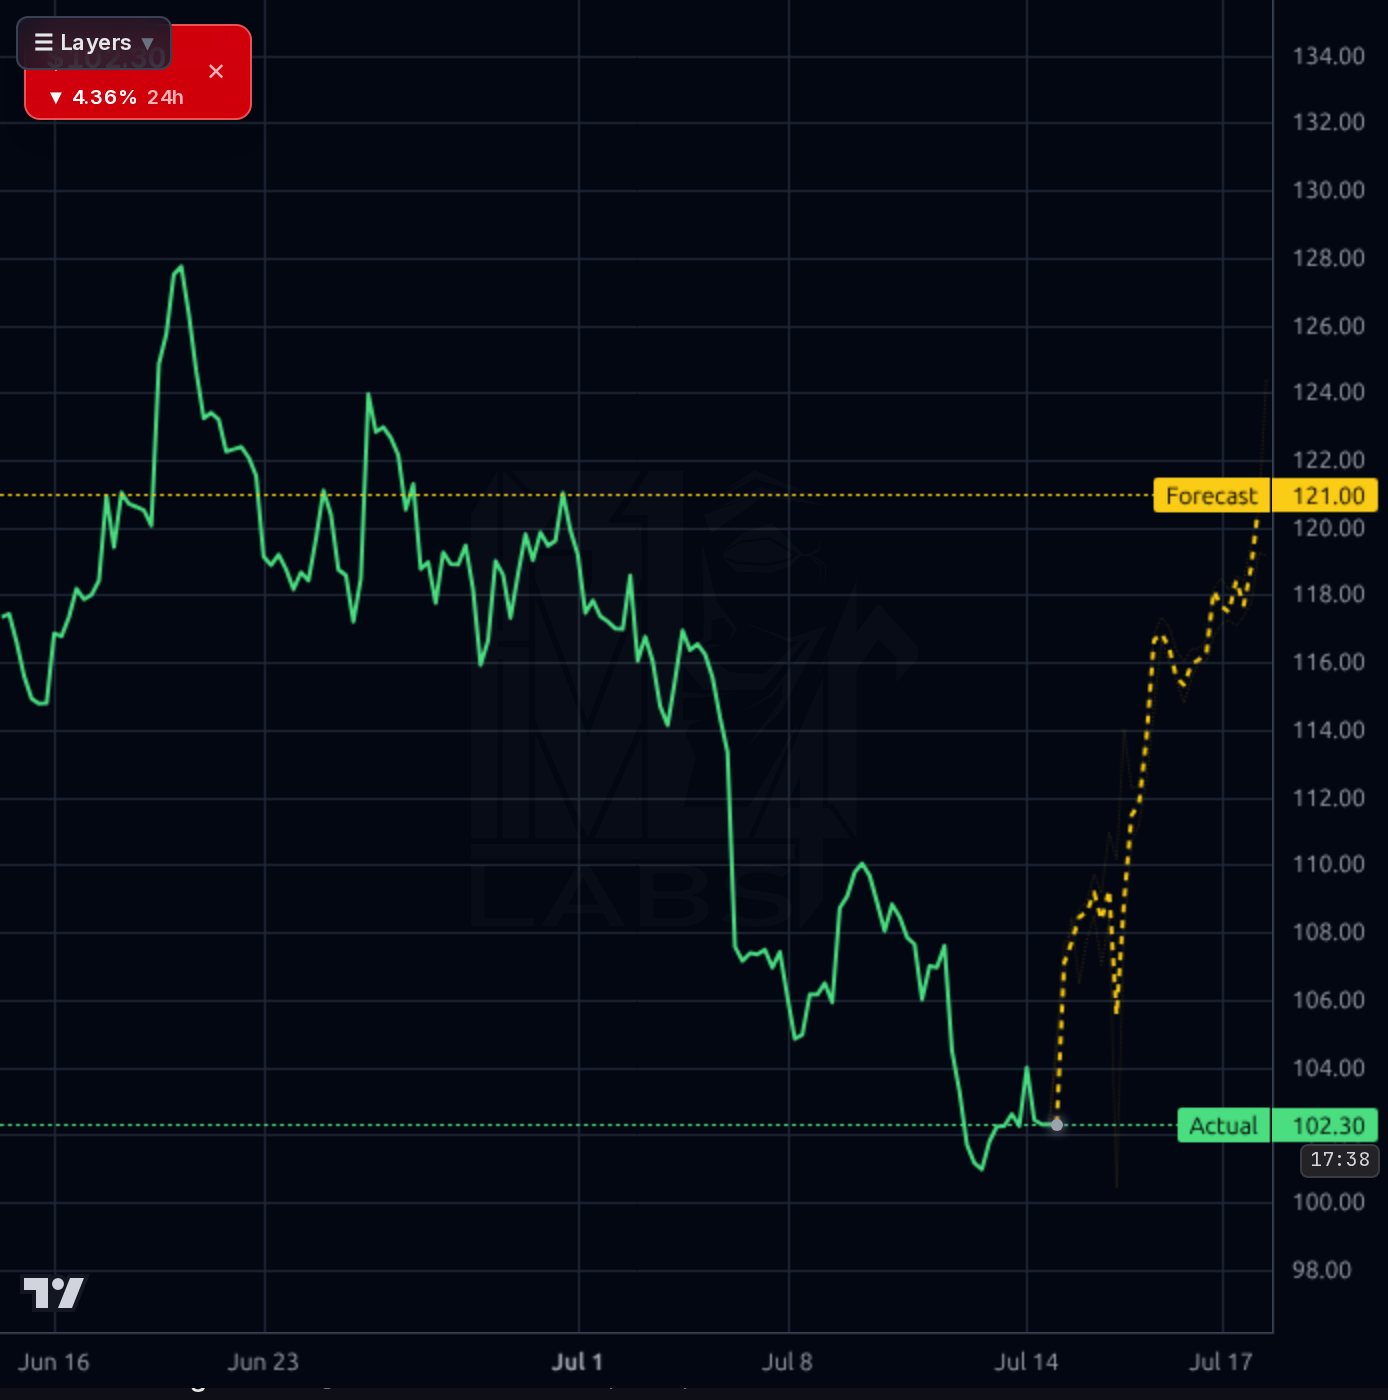
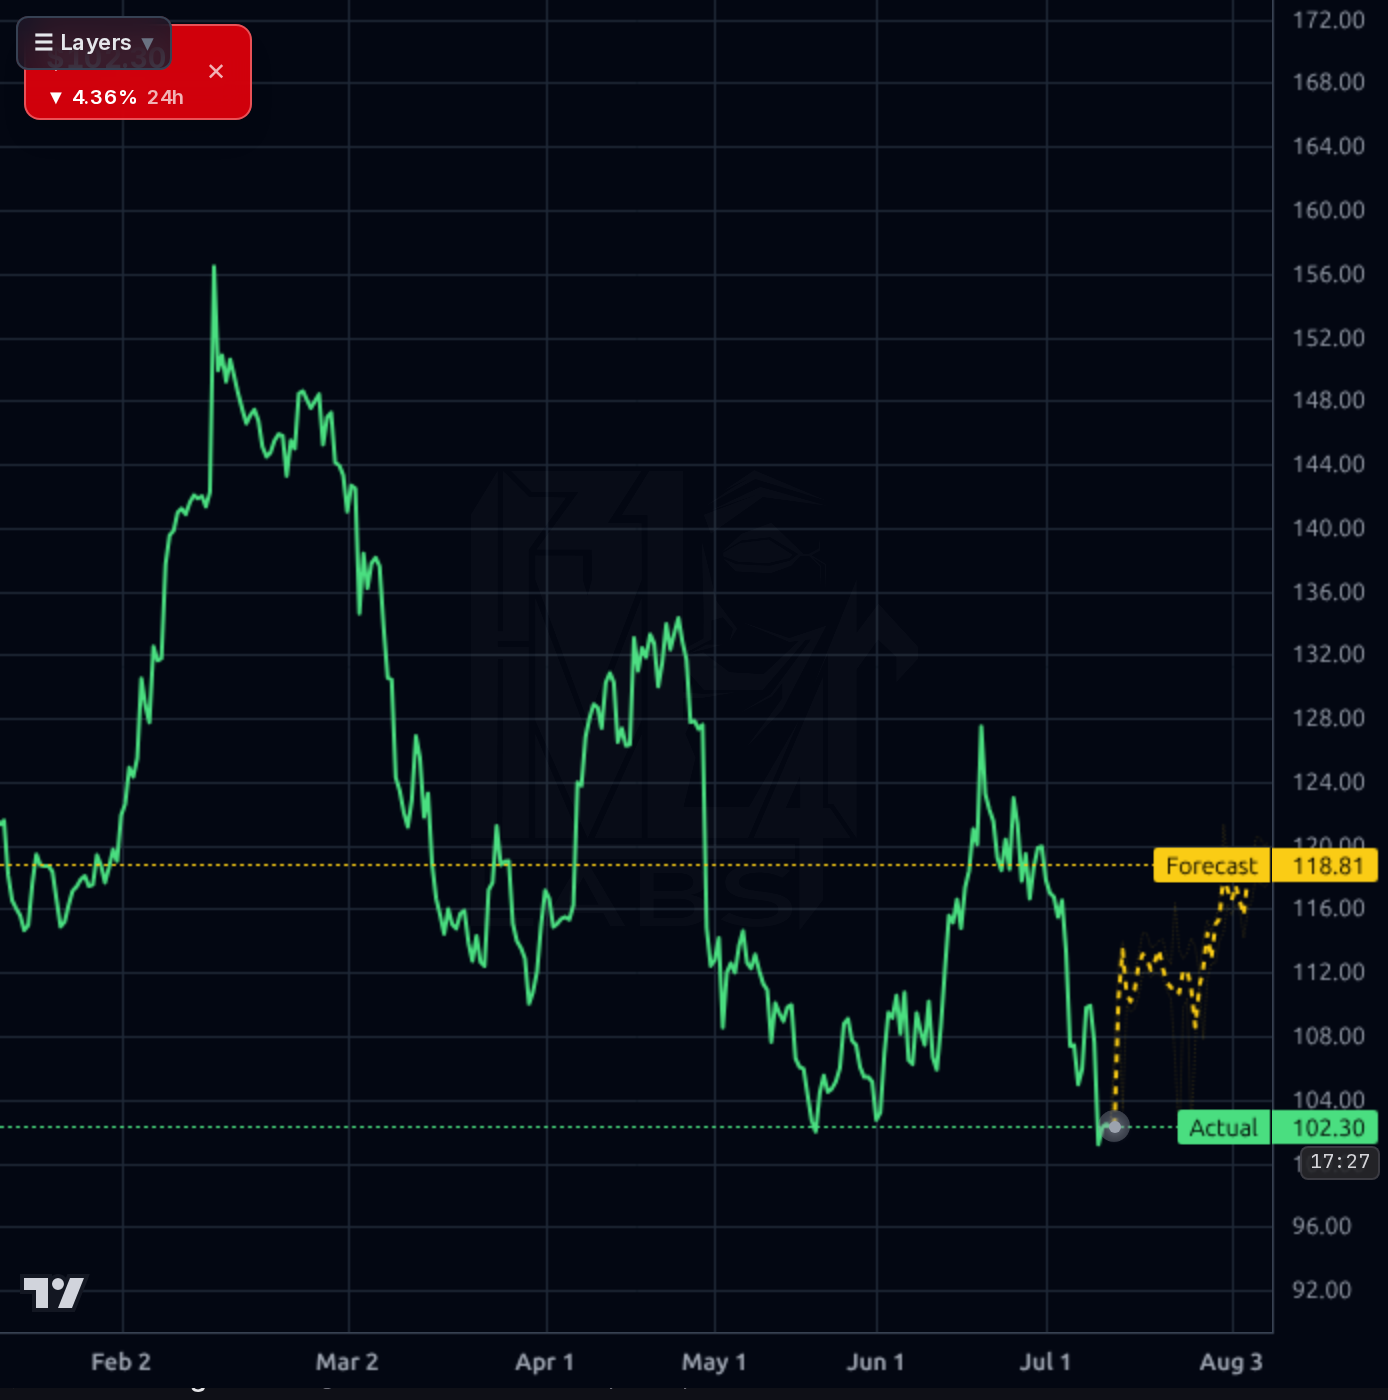
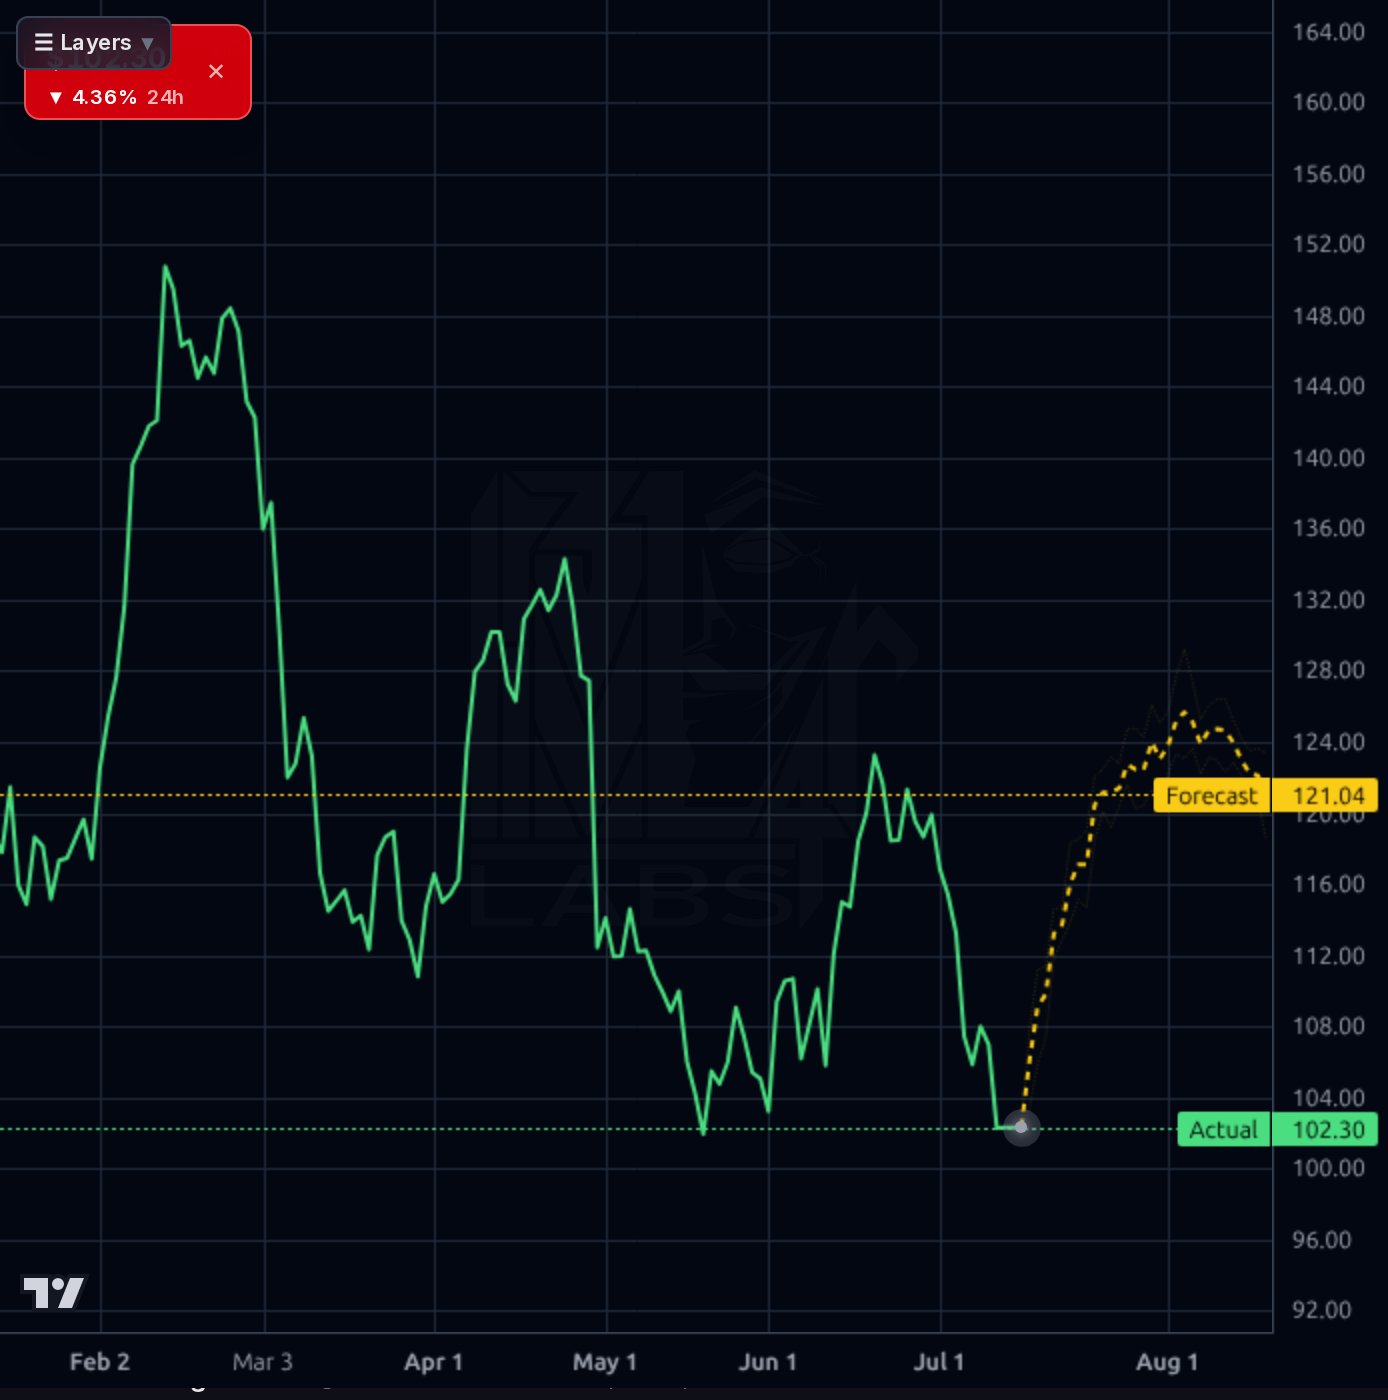
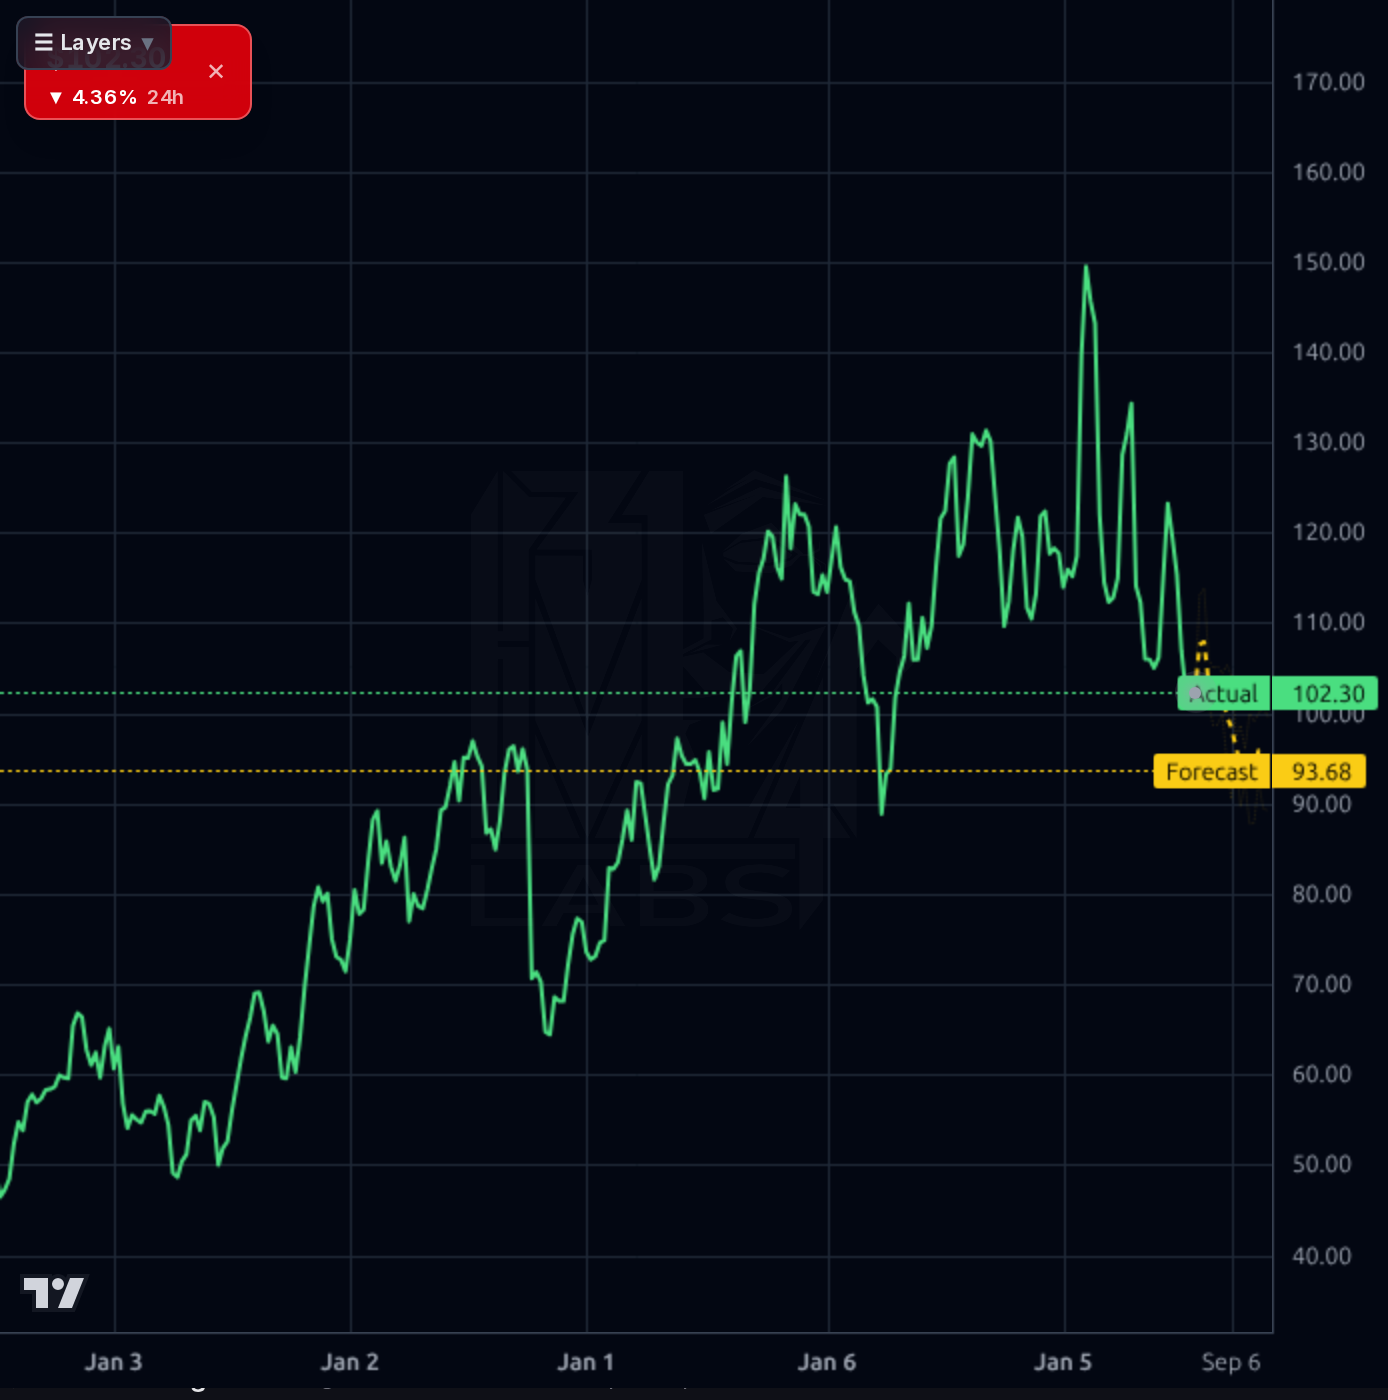
The chart picture is decisively bearish in the near term. On the 1D and 4H, price has broken down from the $118-124 range that held through May-June and printed a fresh 52-week low near $101, now sitting at $102.26 — 36% below the 52W high of $159.99, with SMA20/50/200 all above (distances -11.3%/-8.2%/-14.3%). RSI(14) at 33.8 is approaching oversold but not yet capitulating; a -9.7% weekly performance and -20.5% quarterly print confirm distribution. That said, the 1H forecast band projects a mean-reversion bounce toward $121 over the next several days, and the 1D model targets $121.04 into early August — plausible given the depth of the selloff and proximity to a psychological $100 floor. The 1wk model, curiously, points lower to $93.68, so multi-week reliability is mixed. Note the model's realized 1D directional accuracy is only 12% vs a 91% naive baseline in this regime — the short-term bullish forecast should be discounted materially. Key levels: support $100-101 (52W low + round number), resistance $110 then $118-121 (prior range low).
The signal-worthy item is the July 1 closing of the RUCKUS Networks acquisition from Vistance, confirmed by an 8-K covering material agreement/M&A completion — this is the growth catalyst underlying management's forward EPS uplift and the reason for the aggressive $155 Truist PT (raised from $150 on July 2) and Zacks upgrade to #2 Buy on July 3. A P14 Capital bull thesis was circulated the same week. Noise to discount: generic 'BDC dividend cut' article from July 13 is about BIZD (a BDC ETF), not Belden — do not conflate. The Amphenol article is peer context, not company-specific. Social sentiment is uniformly bullish but volume is tiny (27 messages) and includes promotional pump content — treat as contrarian-neutral rather than confirming.
- RUCKUS Networks acquisition closed July 1, 2026 — expands intelligent wireless networking portfolio and underpins forward EPS estimate of $9.63 (vs trailing $5.94)
- Forward P/E compression from 17.2x trailing to 10.6x forward implies ~62% expected EPS growth into next fiscal year
- Sales Q/Q growth of +11.4% suggests demand acceleration in core copper/fiber connectivity for data centers and 5G/FTTH
- Analyst consensus at 1.00 (strong buy) with $148.67 mean target — 45% upside if consensus is directionally right
- EPS next 5Y estimated at 12.28% CAGR, supporting PEG of 0.91
- Q1 2026 operating cash flow of -$18.7M and FCF of -$63M breaks a positive streak — must reverse or thesis breaks
- Debt/equity of 107% ($1.38B debt) leaves little room if rates stay elevated or business softens
- July 30 earnings is a binary event; -20.5% quarterly performance suggests institutional derisking ahead of print
- Short float 6.85% and short ratio 4.75 elevated for a large cap — someone is positioned against this
- Technical breakdown to new 52W lows; SMA200 still -14% overhead means a real trend repair is needed
- Historical model directional accuracy (12% vs 91% naive baseline on 1D) means the bullish forecast band is unreliable in current regime
- Prior 'accumulate' call at $116.86 has drawn down 12.5% — momentum has been a trap on this name
Get AI analysis on any stock
This is one of hundreds of Kronos AI reports — scored fundamentals & technicals, bull/base/bear price targets, a multi-horizon plan, and continuously-updated forecasts across the market. Create a free account to explore them all.
Create your free account →Already a member? Sign in · Join our Discord