BDC — AI Stock Forecast & Price Targets
Published 7/17/2026 · A free sample of K3vl4r’s AI-powered analysis.
Kronos price forecasts, scored fundamentals & technicals, and a multi-horizon plan.
View the live BDC price forecast →
Belden has sold off to $101.53, just above the 52-week low of $99.55, with RSI 34.7 signaling oversold conditions after a -20.5% quarter. Valuation is genuinely cheap (Forward P/E 10.5x, PEG 0.86) and RUCKUS closed July 1, but Q1 OCF turned negative (-$18.7M) and the July 30 earnings print is a binary catalyst 13 days out — no reason to press either side before then.
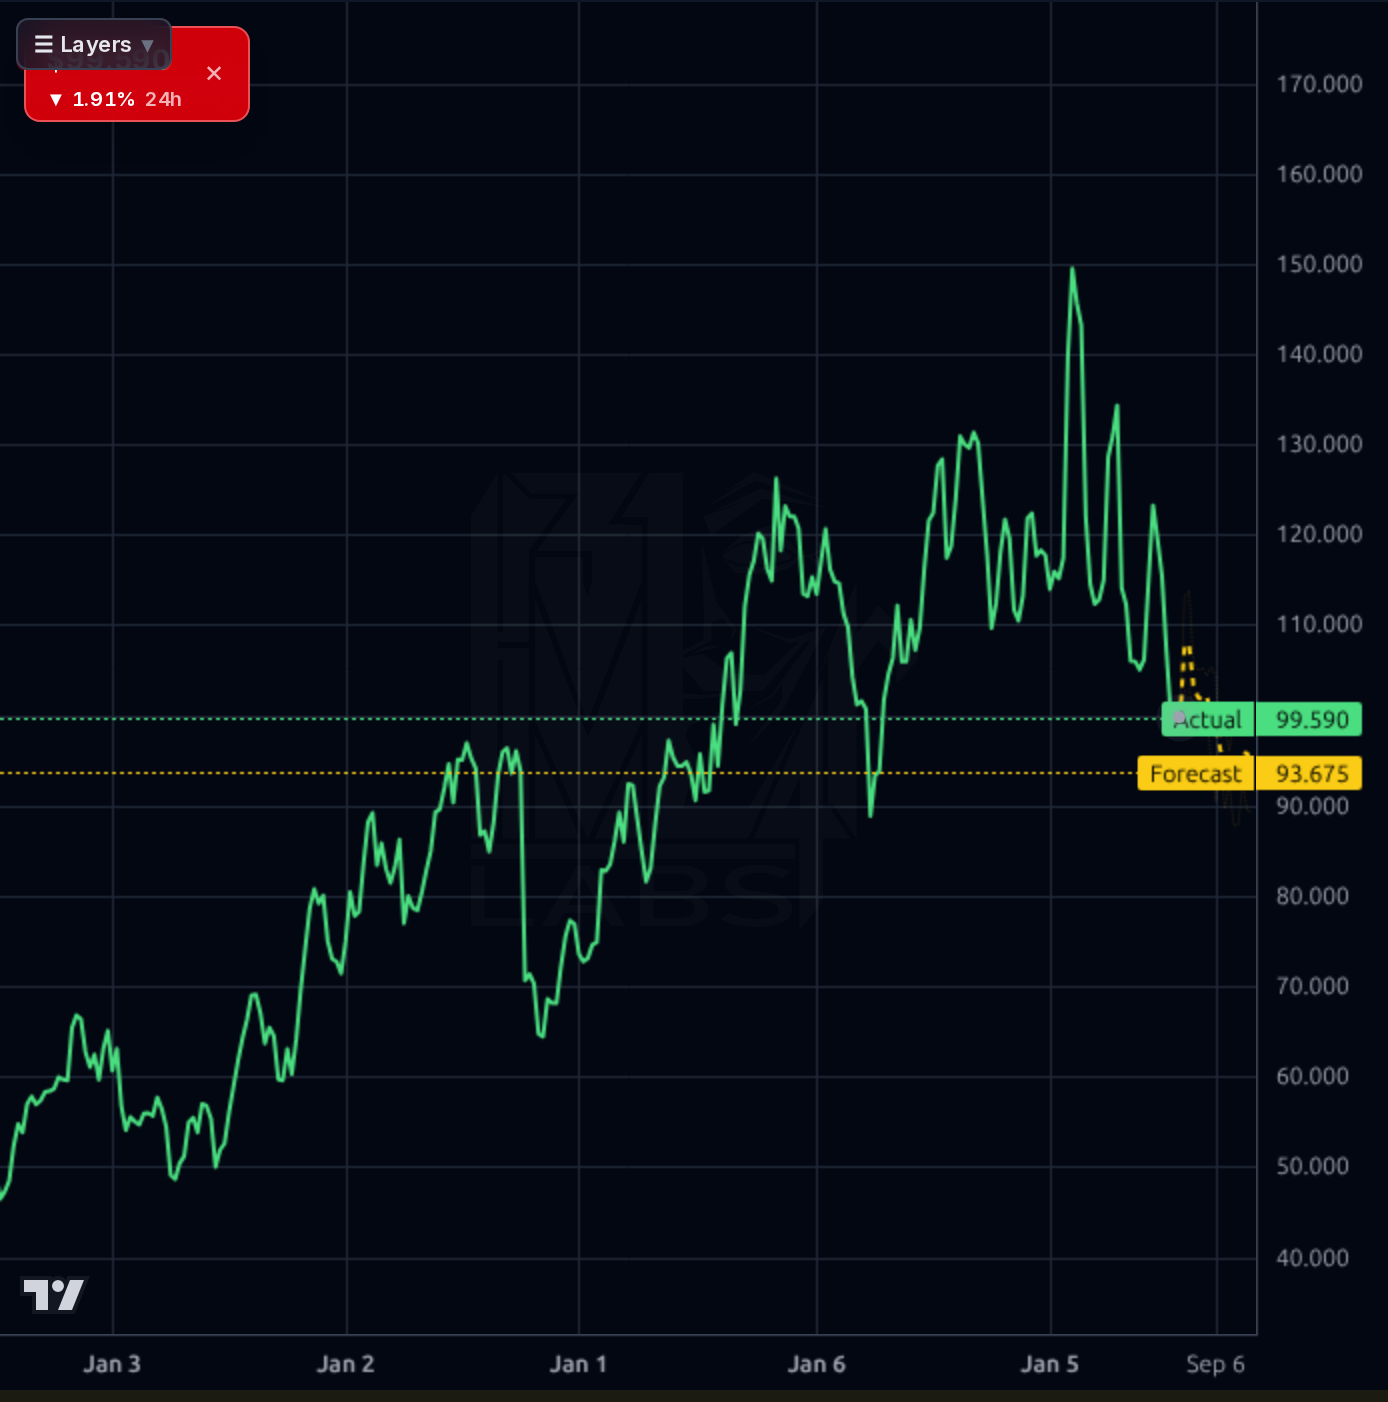
HOLD / do not add ahead of the July 30 print. The stock is oversold (RSI 34.7) and pressing 52-week-low support at $99.55, which sets up a potential bounce toward $108-110, but the earnings gap risk within 13 days dominates. If already long, tolerate the tape and keep size modest; if flat, wait for the print. A close below $99.50 opens $93.68 quickly. Invalidation for any tactical long: daily close below $99. Do NOT initiate swing shorts here either — reward/risk is poor into an oversold binary event with an oversold RSI.
1-6 month view: constructive but earnings-gated. If Q2 shows OCF back to positive territory ($60-100M range) and management provides a credible RUCKUS accretion path, the setup for a re-rating toward $115-120 is real given Forward P/E 10.5x vs sector peers at 15-18x. If Q2 misses on cash flow or guides down, expect a gap to $88-93 and a longer basing period. Expected return range from $101.53: -15% to +18% over 6 months, skewed by the print outcome. Position sizing should assume you may need to double down or exit — don't be all-in either way pre-earnings.
1-3 year thesis: Belden is a value/quality name in the industrial connectivity + intelligent networking secular trend (data center capex, 5G, factory automation, fiber-to-the-home). If RUCKUS integration delivers the implied $9.63 forward EPS at even a 14x multiple, that's a $135 stock — 33% upside from here with dividends. The multi-year drivers are IT/OT convergence, edge compute, and the industrial automation cycle. The biggest structural risk is that the company has now levered up meaningfully (D/E 107%) into a hardware-heavy business where cycle downturns hit hard; a demand air-pocket combined with sticky integration costs could compress FCF for longer than the market can stomach.
Top-line remains healthy: Q1'26 revenue $696.4M (+11.4% Y/Y implied by Sales Q/Q), TTM revenue $2.79B (+9.3% Y/Y). Gross margins are stable at 37.1% (Q1) vs 38.5% (Q2'25), and operating margin held at 11.2%. Q1 net income $51M/$5.94 TTM EPS supports P/E 17x trailing / 10.5x forward. ROE 18.9% and ROIC ~9% are respectable for the industry. The clear break is cash generation: Q1'26 OCF flipped to -$18.7M with FCF -$63M after four consecutive positive quarters ($56M/$65M/$121M in prior three); capex actually stepped up to $44M. Balance sheet is stretched — total debt $1.35B against equity $1.28B (D/E 1.07x) and only $272M cash, with the RUCKUS deal (closed 7/1) adding integration cost and likely more leverage. Current ratio 2.09 offers near-term cushion. Dividend is a rounding error (0.2% yield, 3.4% payout) so shareholder returns hinge on buybacks/deleveraging. Bottom line: quality metrics are fine, but the working capital / cash conversion regression must reverse in Q2 or the thesis breaks.
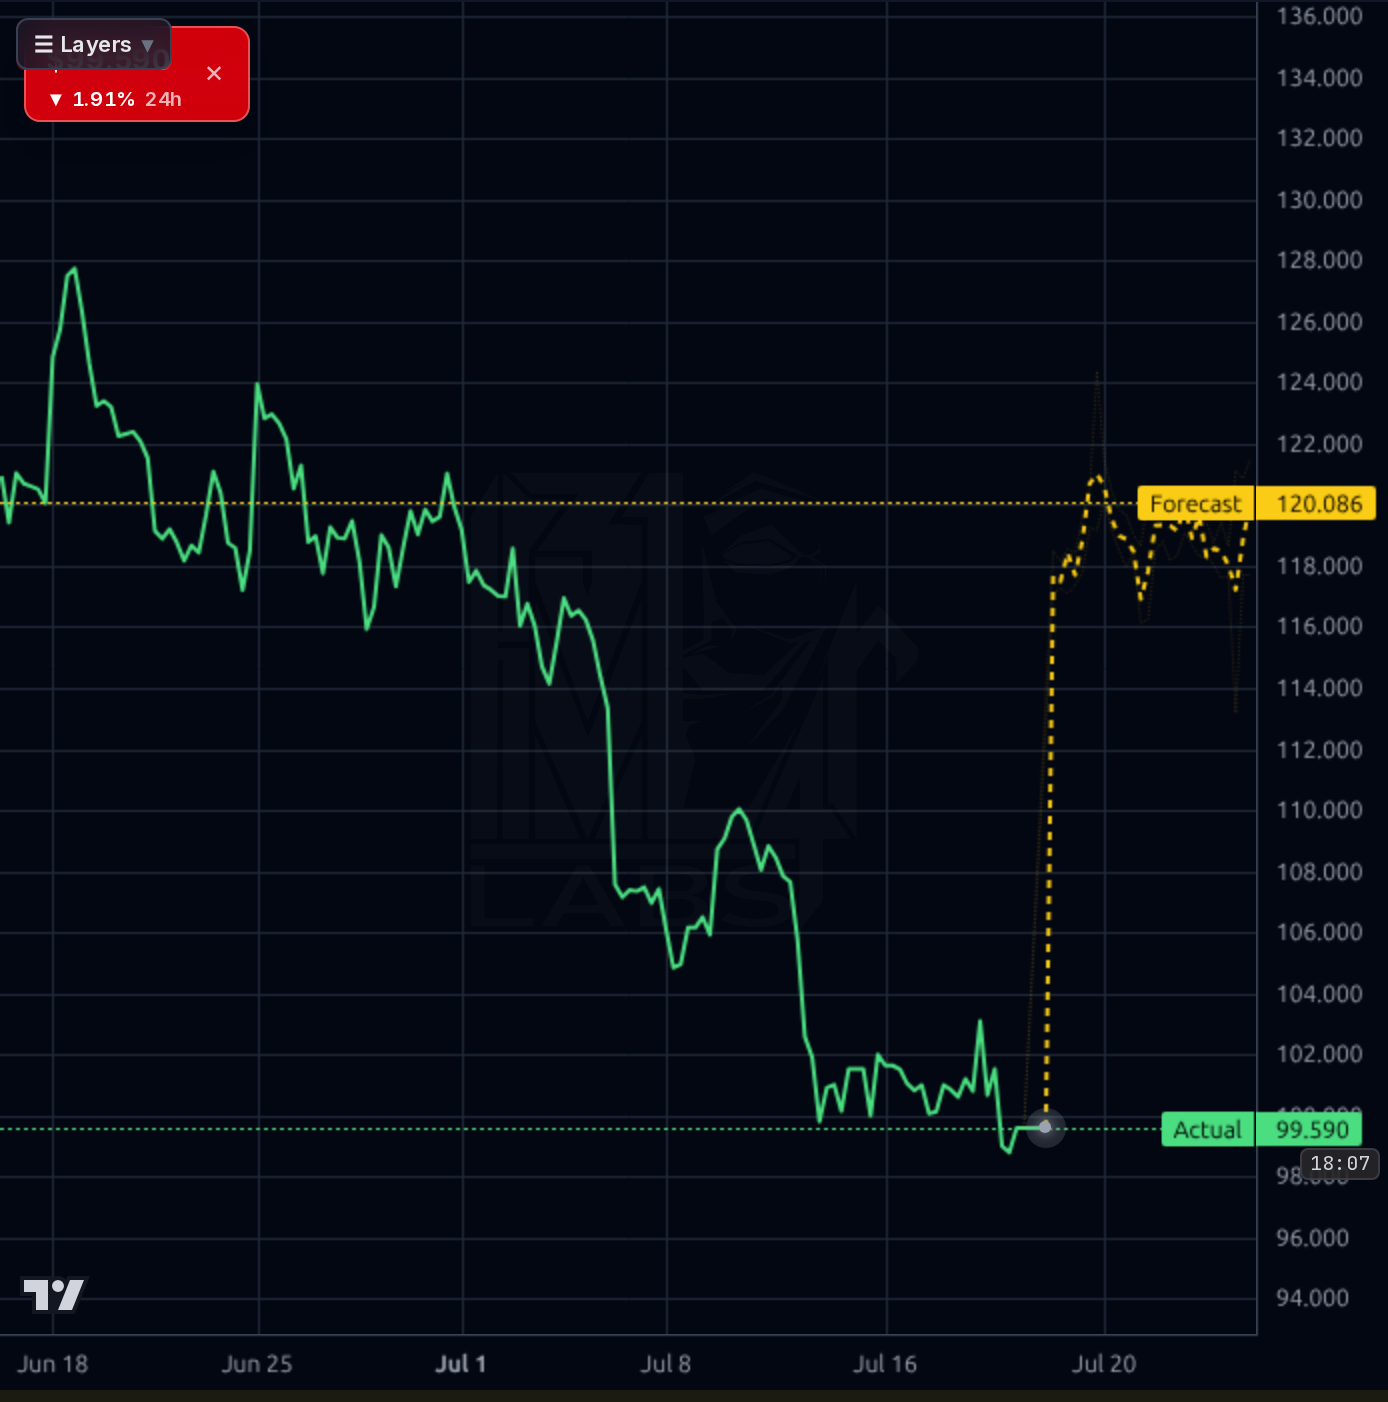
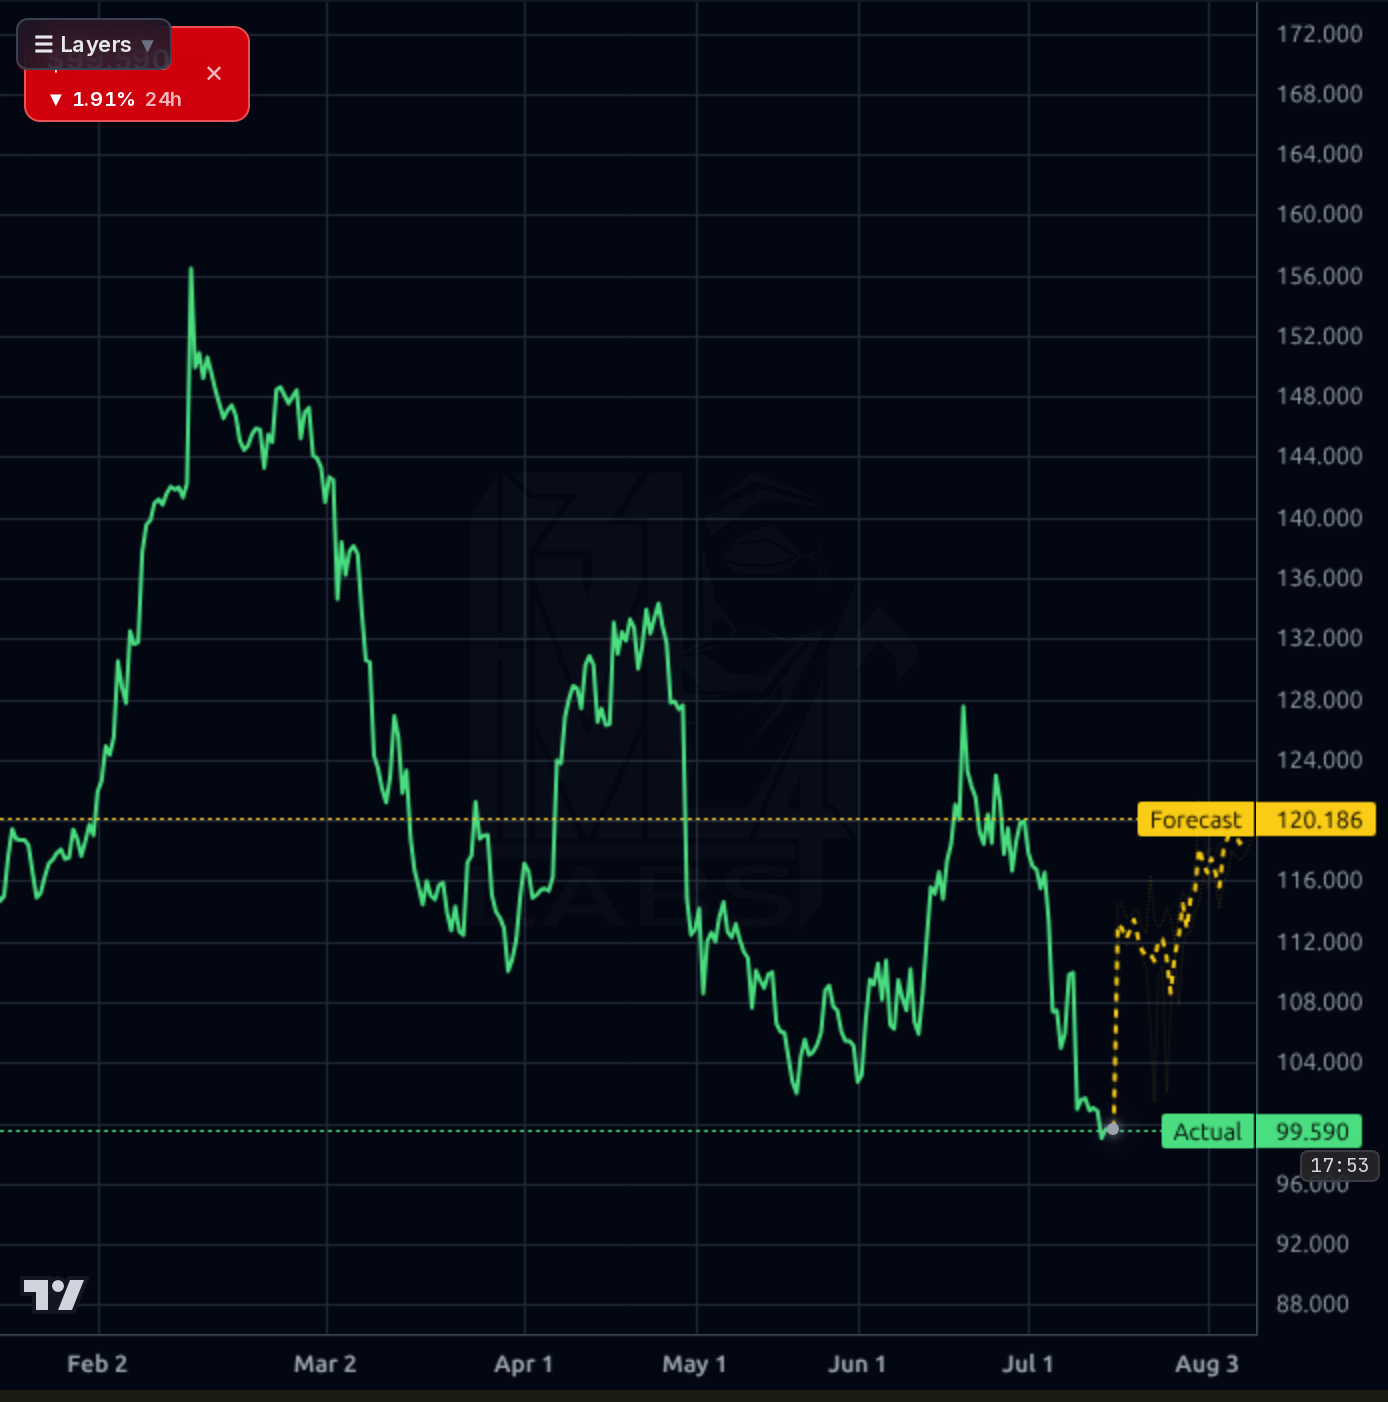
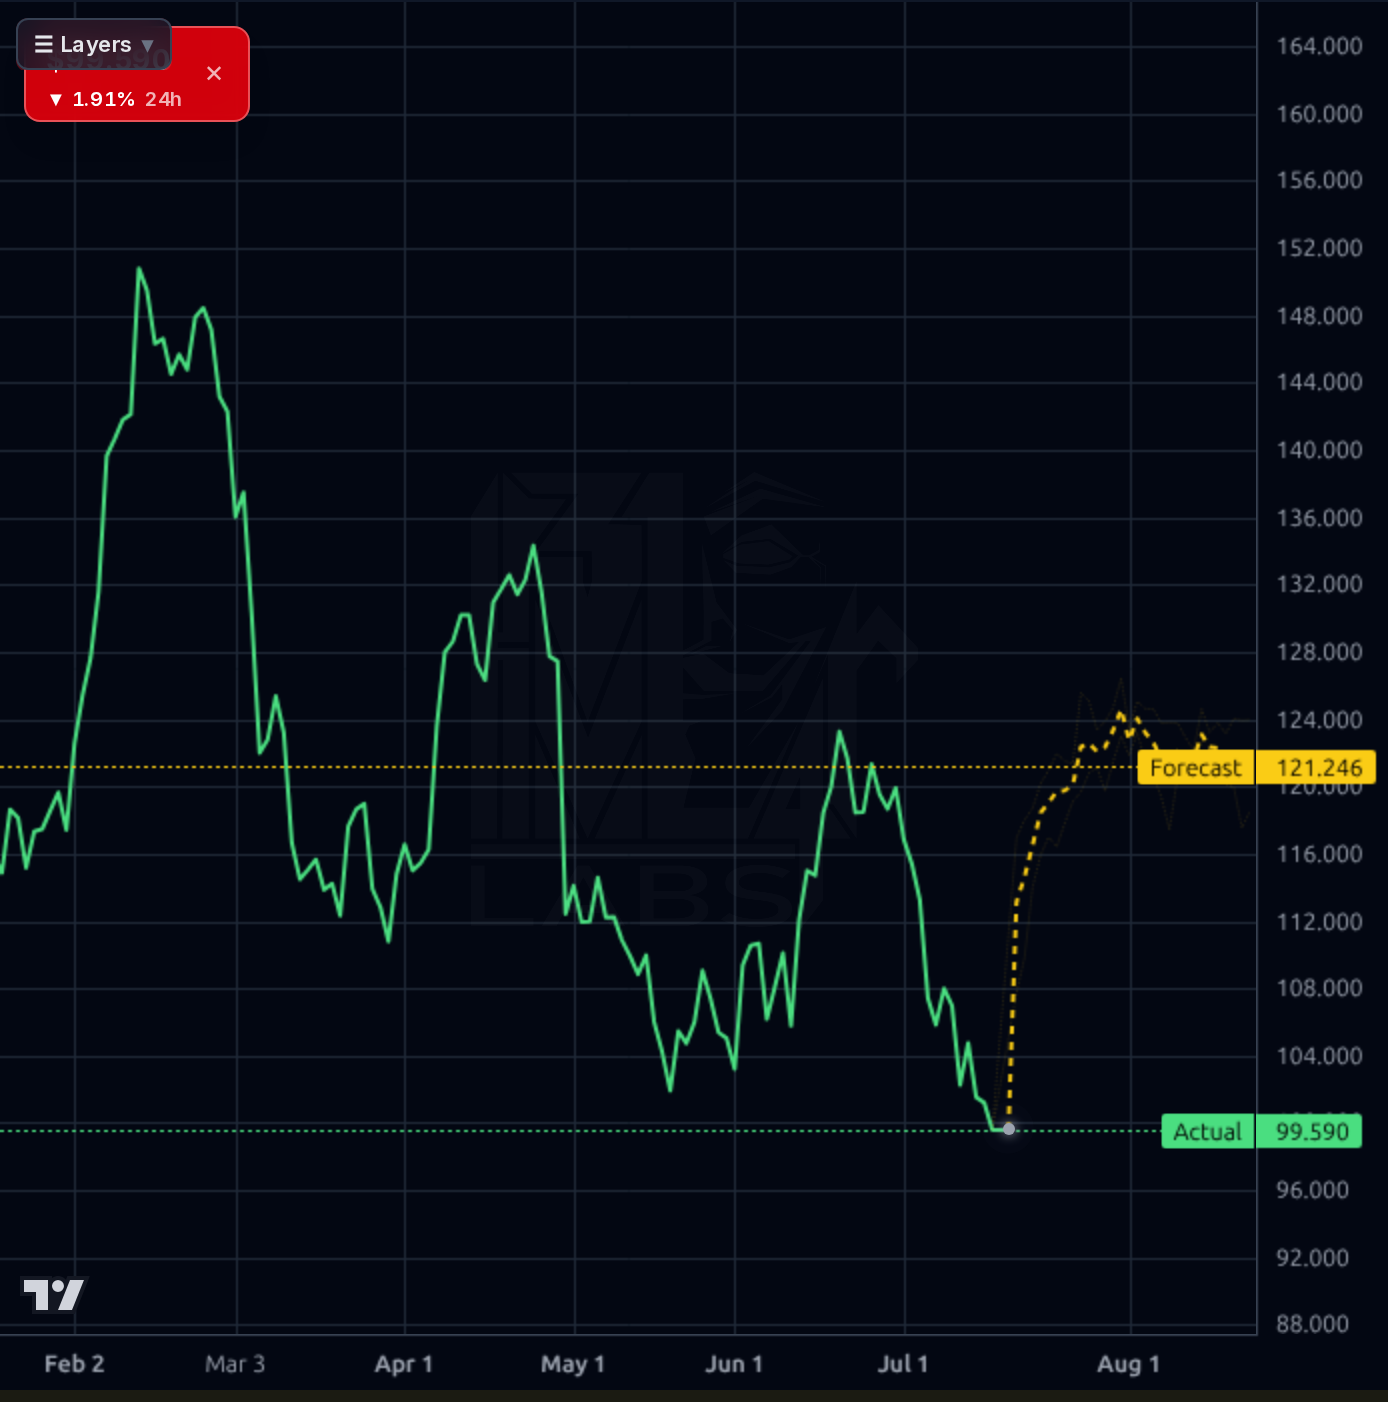
Structure is decisively bearish across timeframes. On the daily, BDC has broken down from $148 (May peak) through a series of lower highs and lower lows to $99.59, printing a fresh 52-week low. Price sits -10.6% below SMA20, -8.6% below SMA50, and -14.97% below SMA200 — every trend is down. The weekly chart shows the stock retracing the entire 2024-25 rally leg from $88 to $150 and now testing the $100 area, which coincides with prior 2024 resistance-turned-support. RSI 34.7 is oversold but not washed out. The 1h and 4h forecast bands project a snap-back toward $118-121, but the model's realized 1d directional accuracy is 10% vs 93% naive baseline — that projection is unreliable. The reliable 1wk signal is bearish (near-term prob 0.00). Key levels: $99.55 (52w low / must-hold) → $93.68 (measured target if it breaks) below; $108-110, $118, $124 as tiered resistance above. Bearish setup, but stretched and one bad tick from a capitulation-and-reversal candle.
Signal: (1) SEC 8-K on 7/1 confirms the RUCKUS Networks acquisition closed — this is the structural growth catalyst justifying the forward EPS ramp to $9.63 but also the source of near-term balance sheet strain and integration risk. (2) A 7/15 sell-side note reiterated Buy with a $172 target citing IT/OT stack completion and margin accretion. (3) Belden confirmed Q2 earnings for July 30 BMO — the binary near-term catalyst. (4) A CloudRail/Tulip partnership announcement supports the industrial digitization narrative but is not material. Noise: repeated WhatsApp-group solicitations on social, a generic 'BDC crash candidate' post, and a StockStory 'Reasons to Like' piece that is more content marketing than incremental insight. Overall the news flow is neutral-to-slightly-constructive but the market is clearly pricing in earnings apprehension over headline positives.
- RUCKUS Networks integration (closed 7/1/2026 per 8-K) — completes the IT/OT wireless stack and is the source of forward EPS acceleration from $5.94 TTM to $9.63 forward
- CloudRail/Tulip partnership targeting brownfield digitization in life sciences and CPG manufacturing — small on its own but signals the industrial automation platform strategy is expanding
- Data center connectivity exposure into secular hyperscale capex cycle — supports the 11.4% Q/Q sales growth already showing in results
- Deleveraging optionality: TTM operating cash flow was ~$329M before the Q1 dip; a return to normalized $300M+ OCF allows meaningful debt paydown from $1.35B base
- July 30 earnings is binary within 13 days — a repeat of negative FCF or soft guidance likely gaps the stock to the $88-93 area
- Debt-to-equity 1.07x with $1.35B total debt limits flexibility if interest rates stay elevated or if industrial capex softens
- RUCKUS integration costs may pressure margins for 2-4 quarters; synergy targets underlying the $9.63 forward EPS are analyst estimates, not guided
- Technical structure is broken — price below SMA20/50/200 with the 1wk model bearish, and the 52-week low at $99.55 is one bad session away
- Belden's 1d model directional accuracy (10% vs 93% naive) is unreliable; the bullish 1d forecast band ($118-121 target) should be discounted heavily
- Prior desk targets have systematically overshot — the sector is not rewarding communication-equipment names with growth-stock multiples right now
Get AI analysis on any stock
This is one of hundreds of Kronos AI reports — scored fundamentals & technicals, bull/base/bear price targets, a multi-horizon plan, and continuously-updated forecasts across the market. Create a free account to explore them all.
Create your free account →Already a member? Sign in · Join our Discord