BESS — AI Stock Forecast & Price Targets
Published 7/29/2026 · A free sample of K3vl4r’s AI-powered analysis.
Kronos price forecasts, scored fundamentals & technicals, and a multi-horizon plan.
View the live BESS price forecast →
Bimergen Energy is a micro-cap developer ($21M market cap, 3 employees, zero revenue) whose stock has collapsed 71% YTD and now trades at $2.91-$3.01 near 52-week lows. Recent 8-K on auditor change plus receipt of $6.4M cash for the Redbird project provide a fundamental floor, but with Q1 2026 net loss of $3.75M widening and no revenue recognition yet, this remains a speculative bet on project execution rather than an investable operating business.
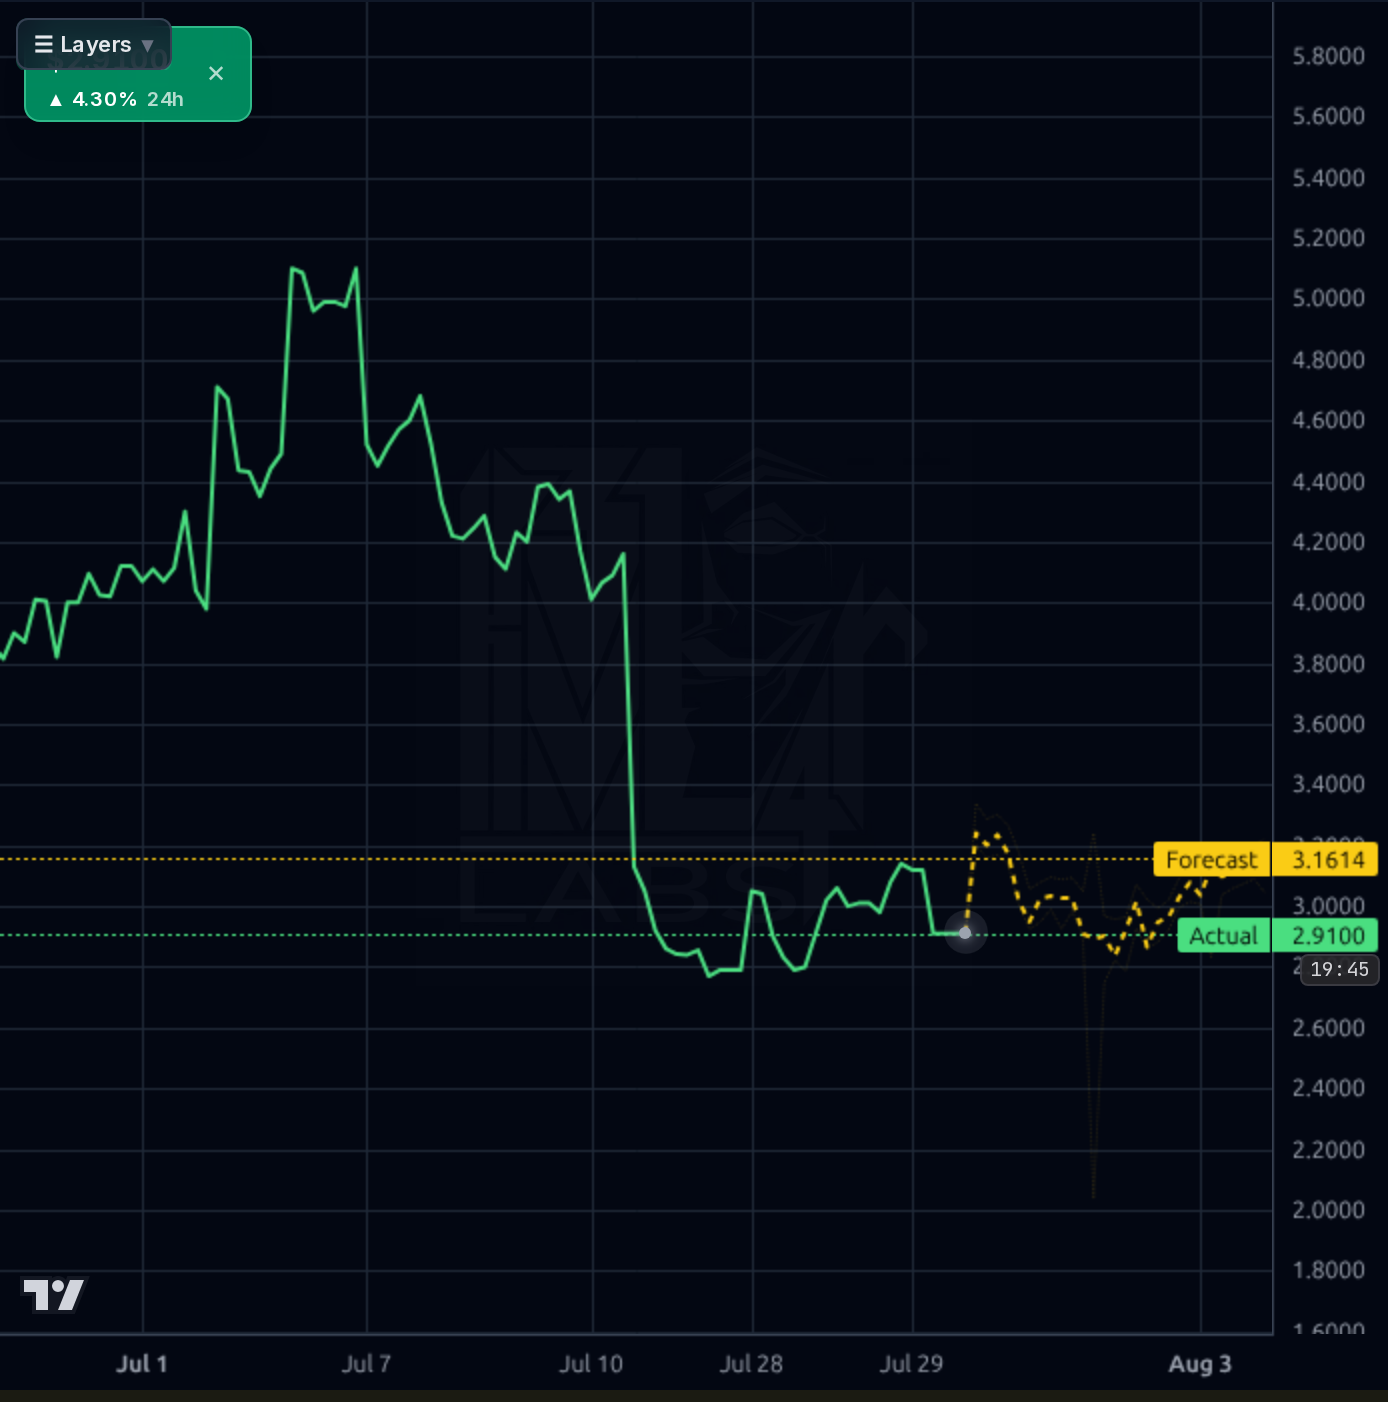
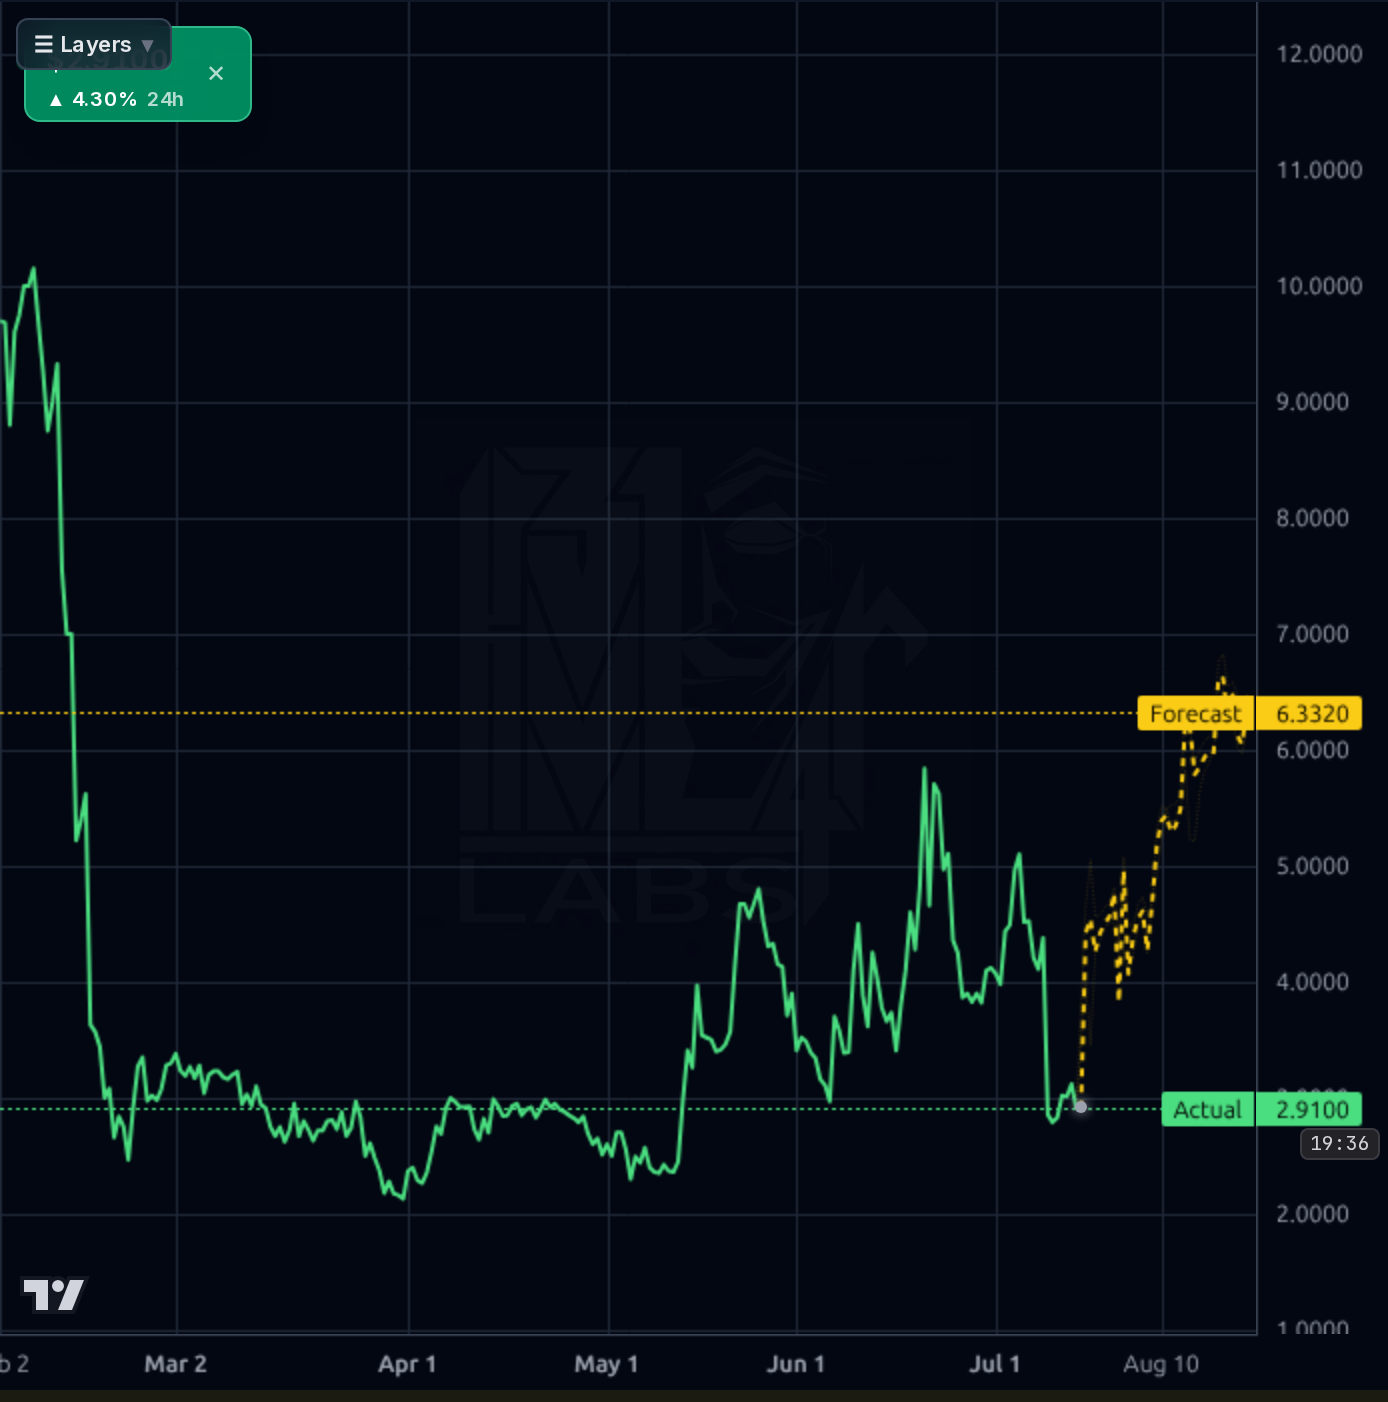
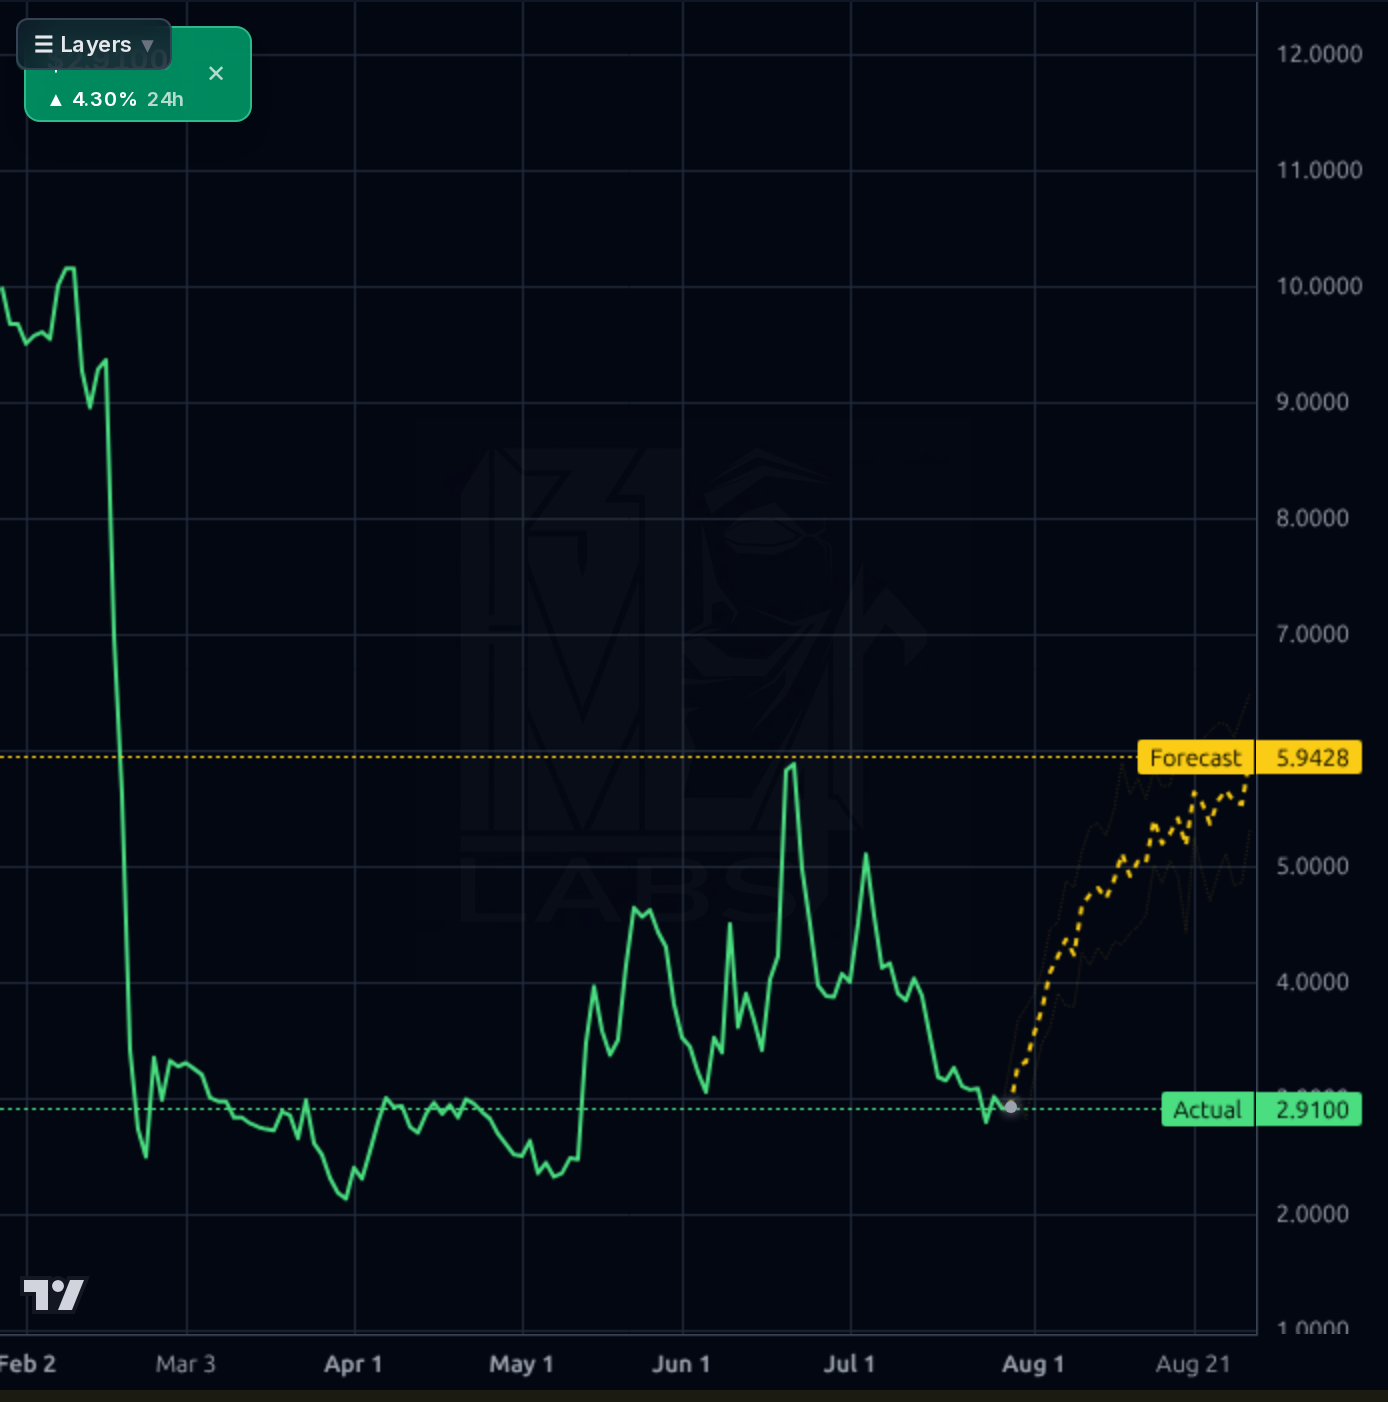
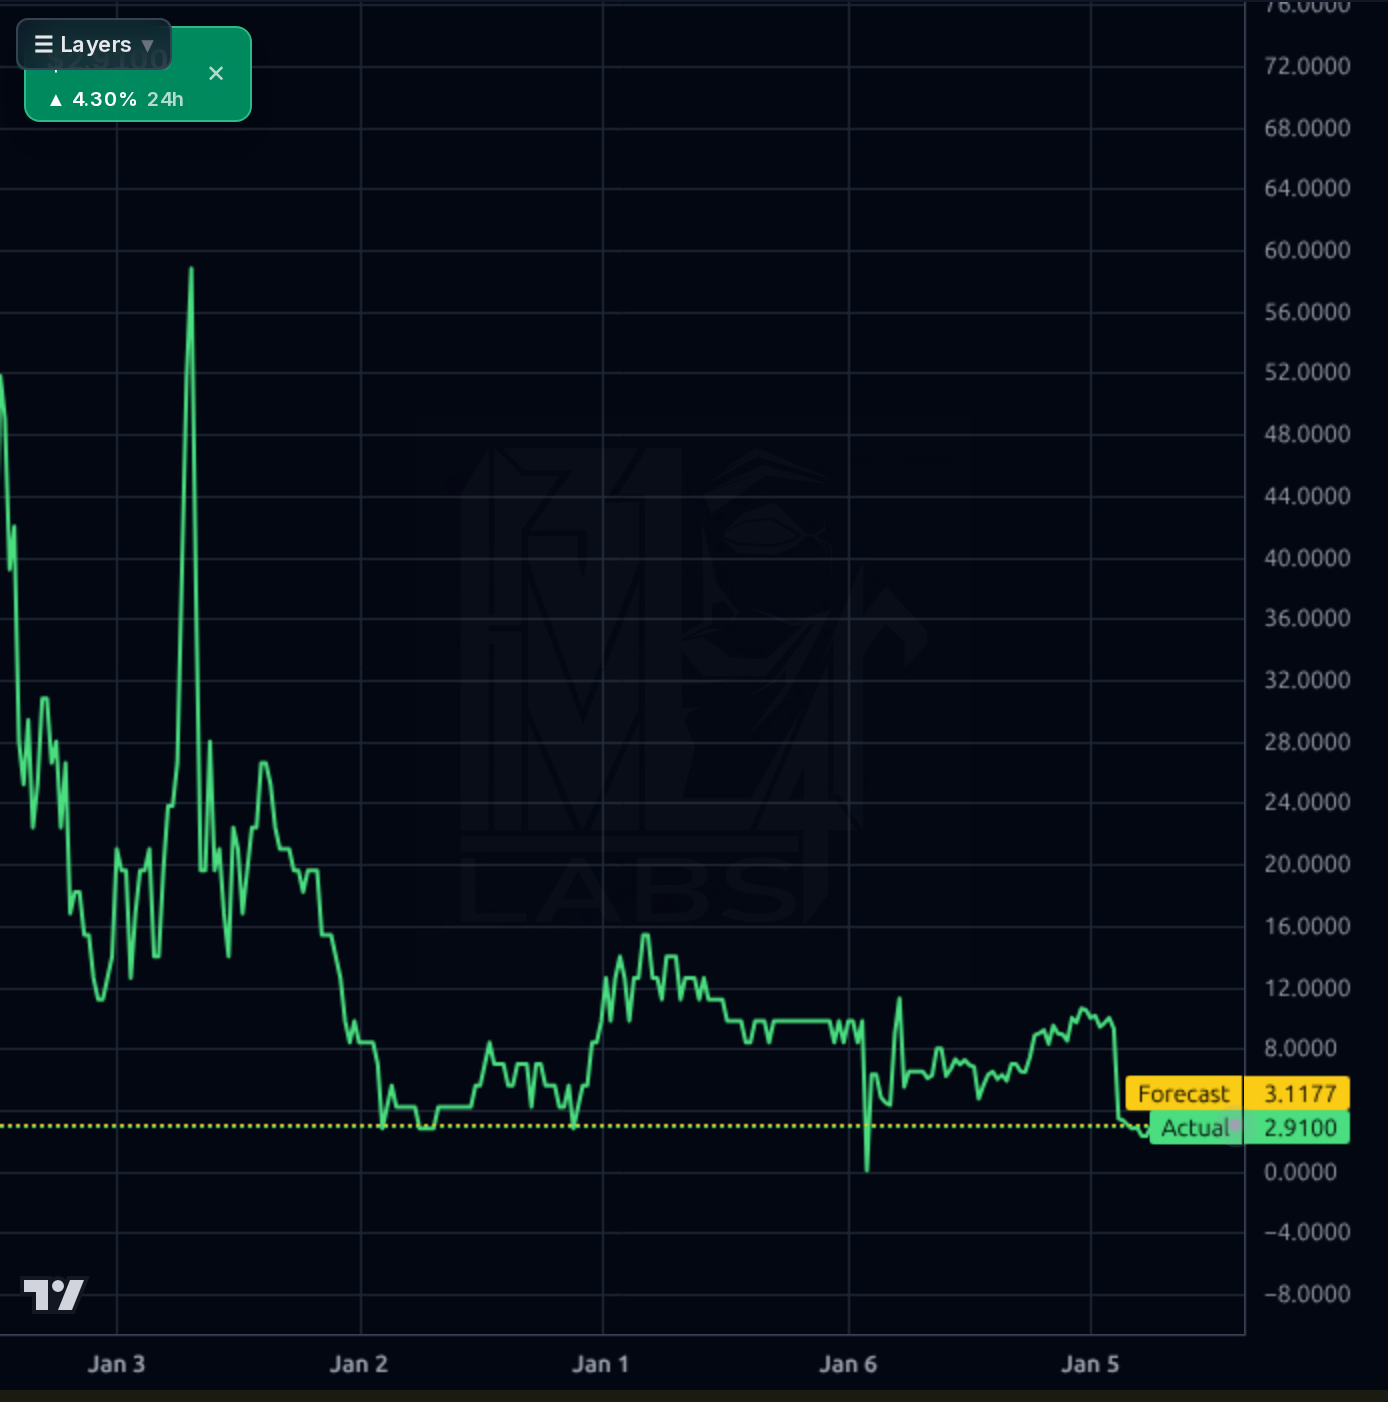
1-4 week view: Neutral-to-cautious. Price is basing near 52-week lows with a fresh cash catalyst, but the trend is broken and the forecast model has been unreliable. If holding, keep small; if entering, wait for a confirmed reclaim of the $3.30-$3.50 level on volume. Invalidation is a break below $2.60 (below recent base), which would open a retest of $2.00. Do not chase the AI forecast to $5.94 — that has been the pattern of failure in this name.
1-6 month view: Speculative accumulate only for risk-tolerant capital. The Aug 13 earnings print and any Q2 2026 revenue recognition from Redbird/Wildfire projects are the key catalysts. Trades below book (P/B 0.71) provides some downside cushion, and the $6.4M cash injection extends runway meaningfully. Expected return range: -30% to +80%. Thesis breaks if Q2 shows zero revenue recognition AND cash burn accelerates, or if a dilutive capital raise is announced.
1-3 year view: Binary outcome. Either the 3.6 GW development pipeline converts into a stream of milestone payments and recurring grid-services revenue (multi-bagger scenario), or the company remains a shell-like developer unable to scale beyond one-off project handoffs (equity destruction via dilution). With 3 full-time employees and no operating revenue history, execution risk dominates. Structural risk: intense competition from well-capitalized incumbents (Tesla, Fluence, Eos, utility-scale IPPs) and interconnection queue delays that push project economics past the point of subsidy support.
Fundamentals are extremely weak in absolute terms. Trailing revenue is $0 across all four reported quarters, while quarterly operating losses have accelerated from -$0.82M (Q2 2025) to -$3.76M (Q1 2026) — losses are widening, not narrowing. TTM net income is -$7.87M against a $21.4M market cap. ROE is -30.7%, ROA -16.8%/-26.9% depending on source, ROIC -26.1%. The one bright spot is the balance sheet: $8.9M cash, zero debt, current ratio 2.21, book value/share $4.26 (P/B 0.71 — trades below book). Equity was rebuilt to $30.2M in Q1 2026 versus $19.4M prior quarter, implying a recent capital raise/equity issuance (dilution risk realized). The July 28 announcement of $6.4M cash received plus $2.5M contingent from the Redbird project is material relative to the cash base and could fund another 2-3 quarters of burn. Forward EPS of $1.76 giving a 1.7x forward P/E is entirely speculative — there is no revenue history to underwrite it.
Price action is broadly bearish with a possible basing attempt. The 1-week chart shows a catastrophic decline from ~$60 to sub-$3 over the past two years (-94% 5Y, -71% YTD). The 1-day chart shows a bottoming pattern in the $2.00-$3.00 range since February 2026, with price sitting -49% below SMA200, -23% below SMA50, and -19% below SMA20 — deeply oversold on trend but RSI at 40.5 is neutral. The 1-hour chart shows a sharp drop from $5+ in early July to a consolidation around $2.90-$3.00. The forecast model shows bullish bias (bullish_prob 1.00) with 1d target $3.16, 4h $6.33, and 1d $5.94 — but the model's realized directional accuracy is 40% on 1d and 17% on 1wk vs naive baselines of 89% and 100%, meaning the model has been systematically wrong on this name and its bullish forecast should be heavily discounted. Key support: $2.00 (52-week low). Key resistance: $4.20 (Jul 10 breakdown level), then $5.00.
Signal: The July 28 Benzinga headline confirming receipt of $6.4M in cash from the Redbird 100MW/400MWh BESS project, with an additional $2.5M milestone-contingent, is the most important recent catalyst — it materially strengthens the cash position and validates at least one project monetization event. The July 15 news that FPUSA selected the Wildfire BESS project for its platform under an existing strategic agreement supports the pipeline thesis. The July 2 8-K disclosed an Item 4.01 (change in accountant), which is a yellow flag warranting scrutiny of the reasoning in the filing, though not by itself disqualifying. Noise: The Q2 Investor Summit presentation availability is promotional. Social sentiment shows 100% bullish tilt on very thin volume (17 messages), typical of low-float momentum names — worth treating as a mild contrarian caution rather than confirmation. Broader market news (Ionic Digital IPO, Belgium GDP, etc.) is irrelevant to the name.
- Redbird BESS Project (100 MW/400 MWh) — $6.4M cash received July 2026, additional $2.5M on milestone completion; largest confirmed monetization to date
- Wildfire BESS project selected for FPUSA platform (July 15, 2026) under existing strategic agreement — second project moving to conversion stage
- 3.6 GW AC development pipeline across BESS and solar disclosed in company description — represents theoretical inventory to convert
- Forward EPS estimate of $1.76 (vs -$1.81 trailing) implies analyst expectation of meaningful revenue in FY2026/27 — needs Q2 print to validate
- Insider ownership of 38% and Q4 institutional transaction change of +70.7% suggest aligned/increasing sophisticated ownership
- Zero revenue across last four reported quarters despite growing operating losses (-$3.76M in Q1 2026) — burn is accelerating
- Item 4.01 auditor change disclosed July 2 — always requires scrutiny for underlying disagreements
- Equity balance jumped from $19.4M to $30.2M between Q4 2025 and Q1 2026, indicating recent dilutive issuance; float of only 3.7-4.4M shares makes further raises highly dilutive
- Kronos forecast model beaten by naive baseline on both 1d (40% vs 89%) and 1wk (17% vs 100%) horizons — model is unreliable for this name; do not underwrite targets from it
- Prior report base target of $5.25 sits +74% from current price and has not printed; upside has been systematically overestimated
- Company has 3-7 employees per data source — capacity to execute on 3.6 GW of projects is not credible without heavy outsourcing/partnering, creating margin risk
- Micro-cap ($21M), low institutional ownership (11%), and 4.0% short float make the stock highly volatile with poor price discovery
- Recommendation score of 1.00 (strong buy) with only cursory analyst coverage on a $21M name should be viewed with skepticism
Get AI analysis on any stock
This is one of hundreds of Kronos AI reports — scored fundamentals & technicals, bull/base/bear price targets, a multi-horizon plan, and continuously-updated forecasts across the market. Create a free account to explore them all.
Create your free account →Already a member? Sign in · Join our Discord