BFAM — AI Stock Forecast & Price Targets
Published 8/4/2026 · A free sample of K3vl4r’s AI-powered analysis.
Kronos price forecasts, scored fundamentals & technicals, and a multi-horizon plan.
View the live BFAM price forecast →
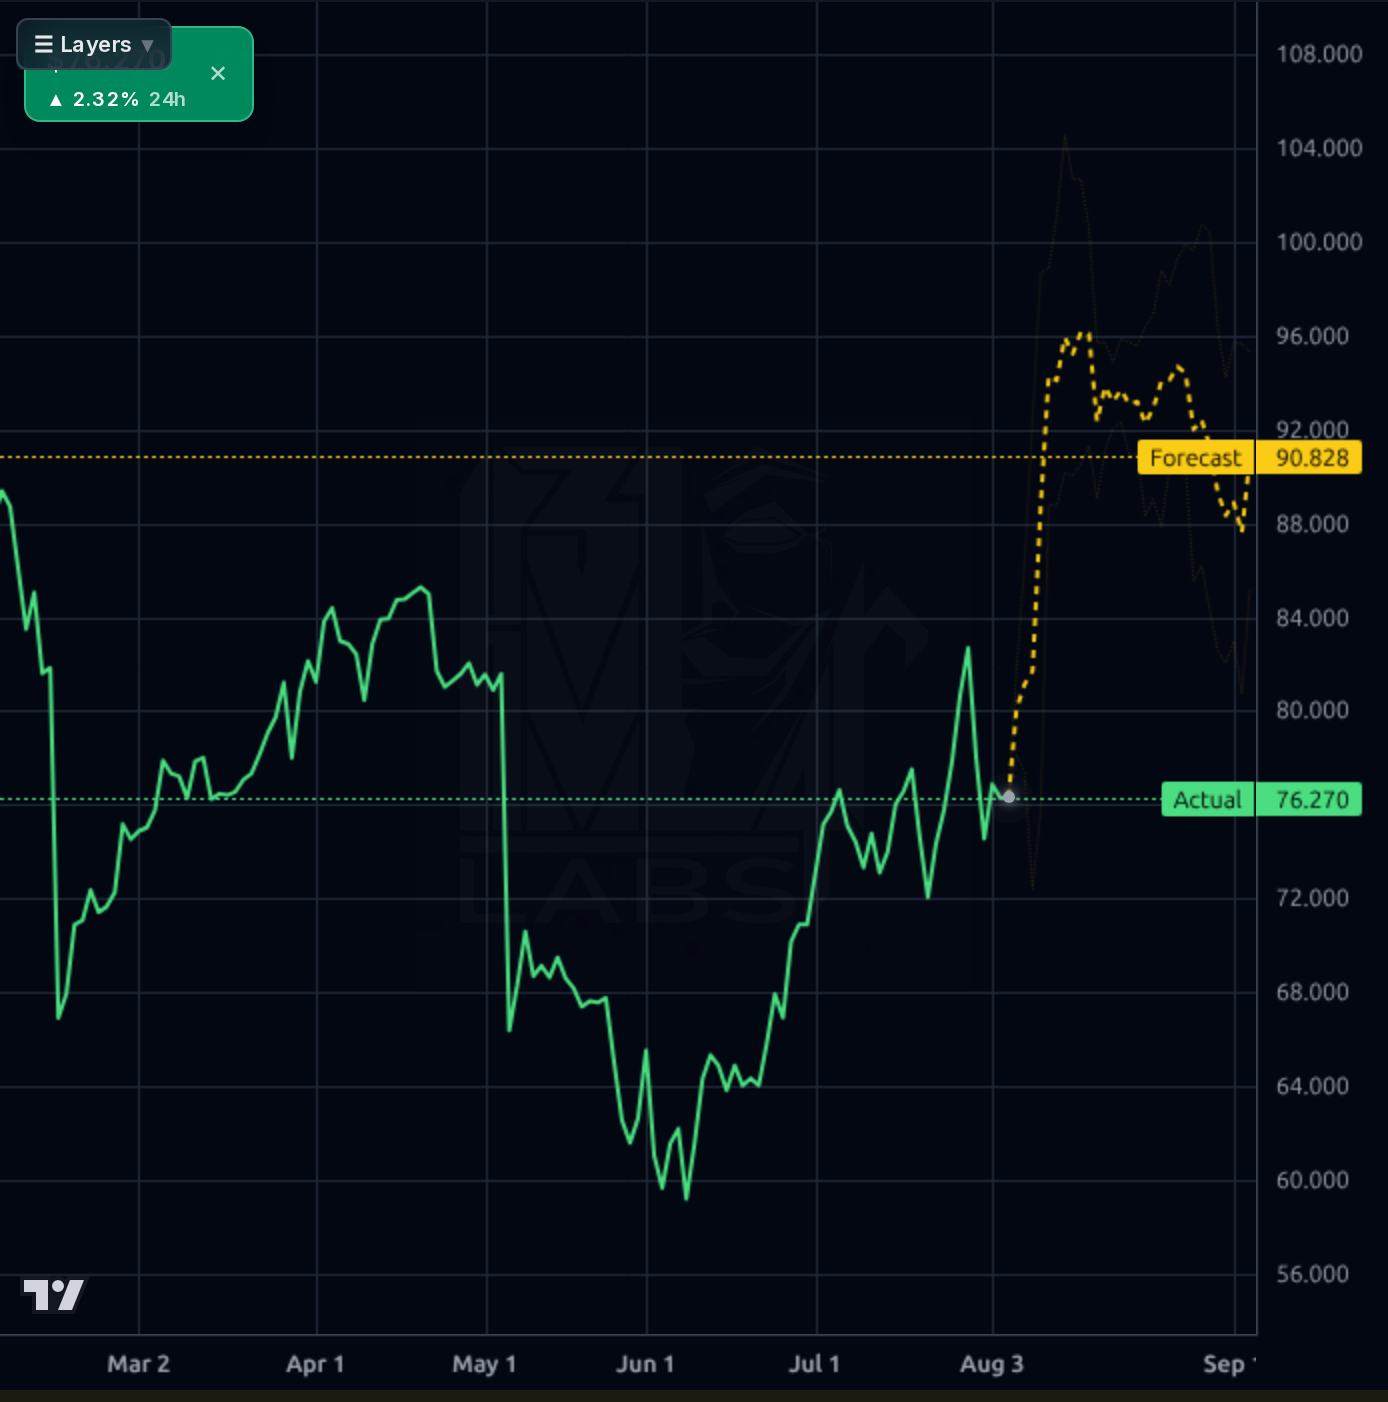
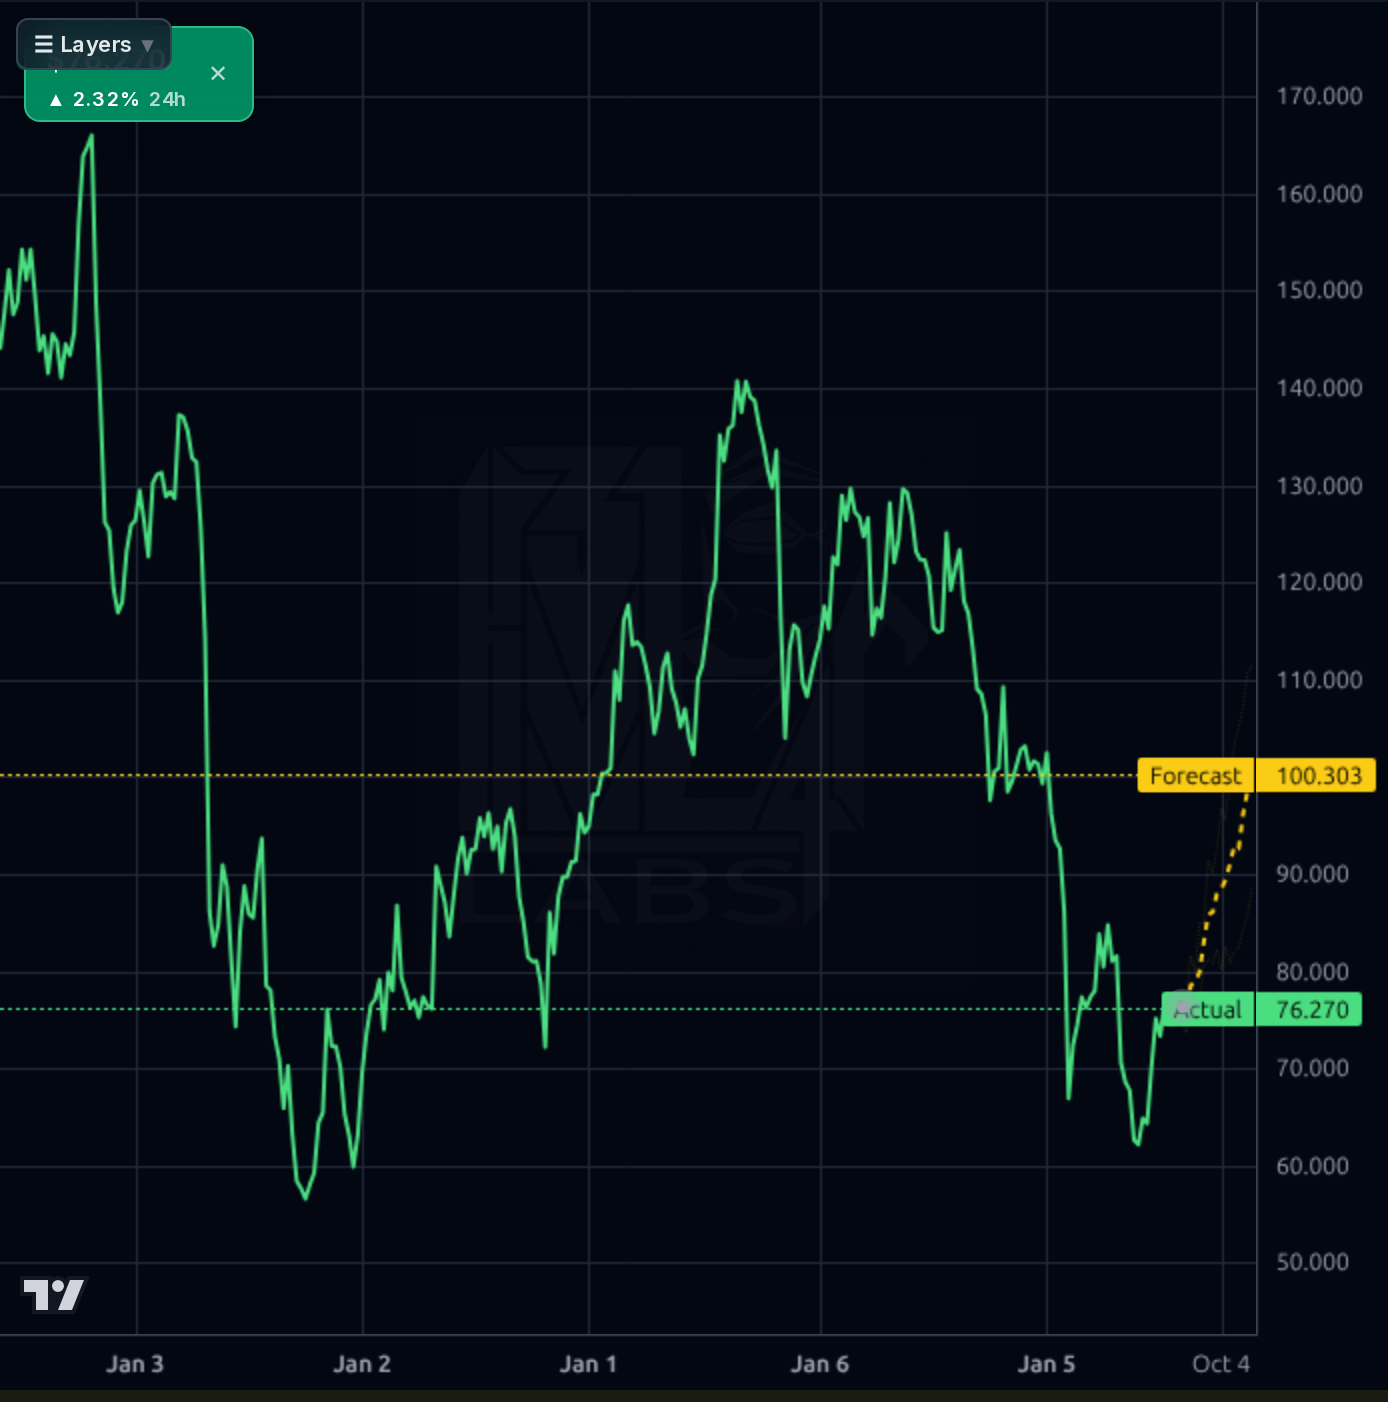
BFAM shows strong operational momentum driven by Back-Up Care growth and margin expansion, but elevated debt and sector volatility temper near-term upside. The chart indicates bullish technicals with forecast bands suggesting continued upside, though valuation metrics remain mixed.
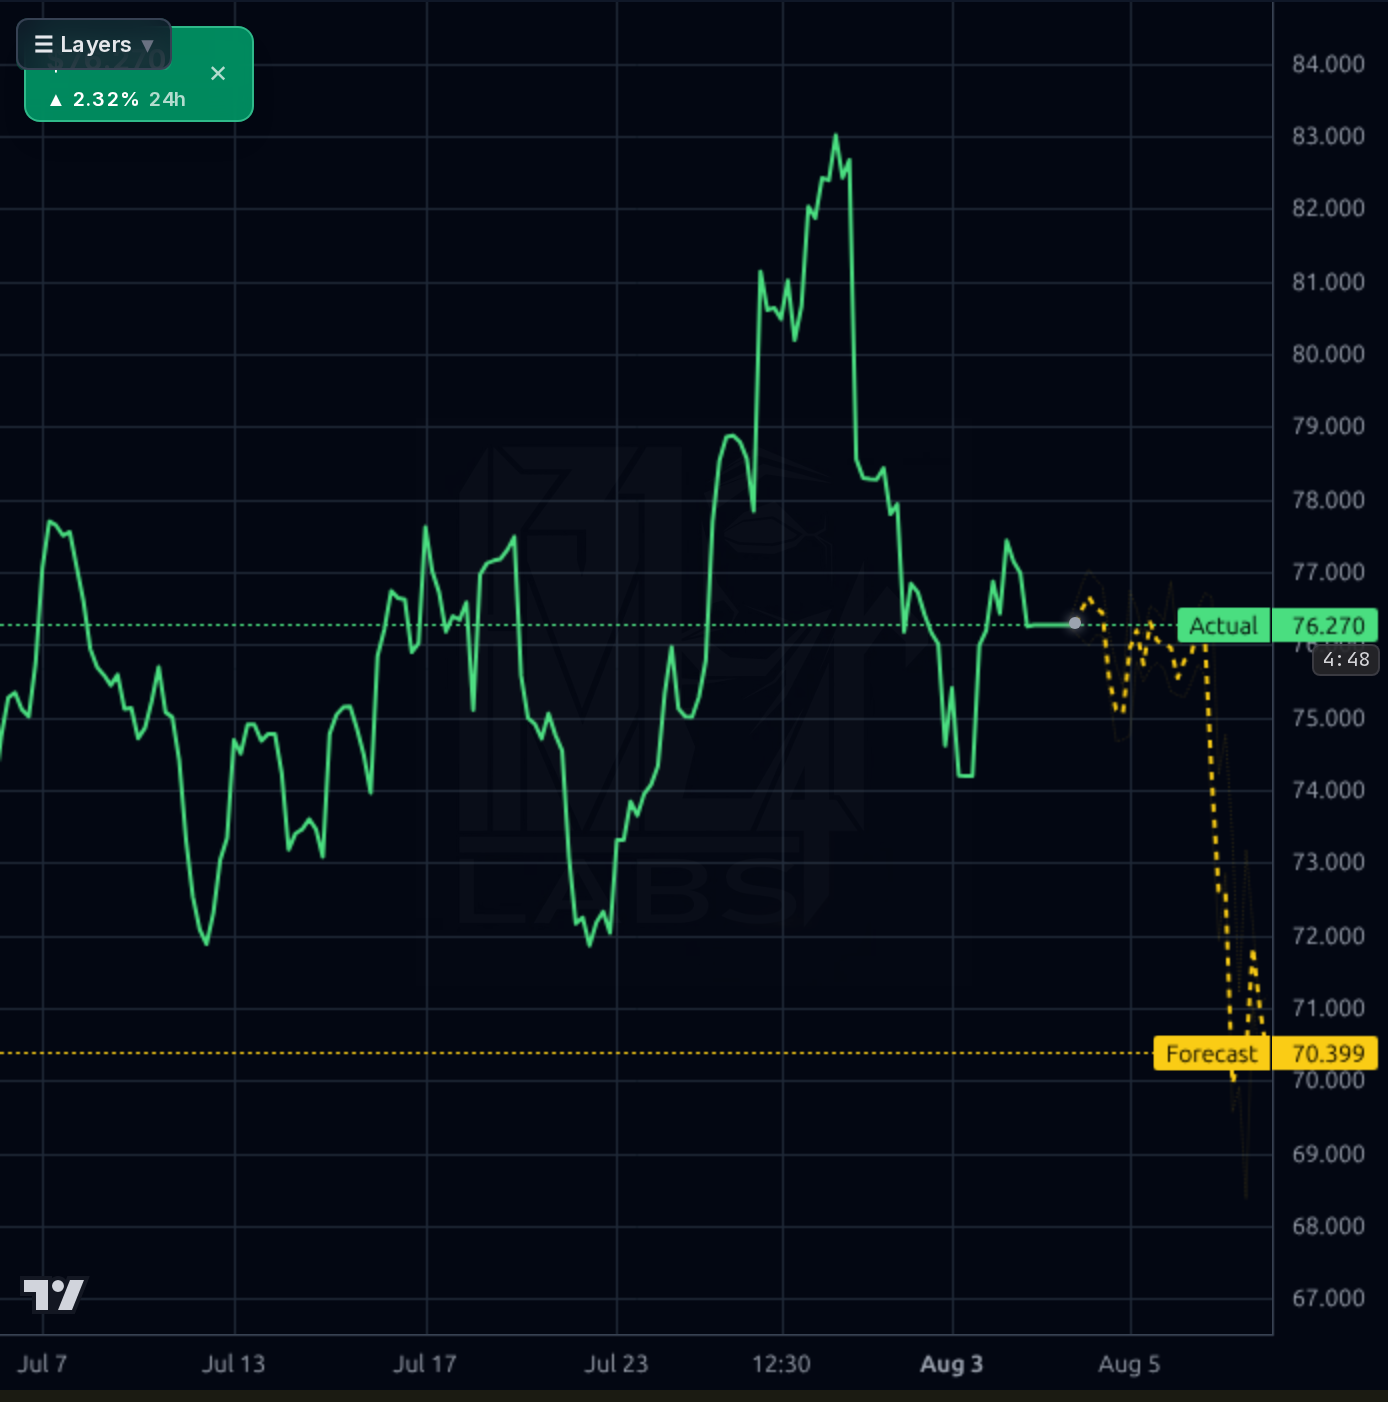
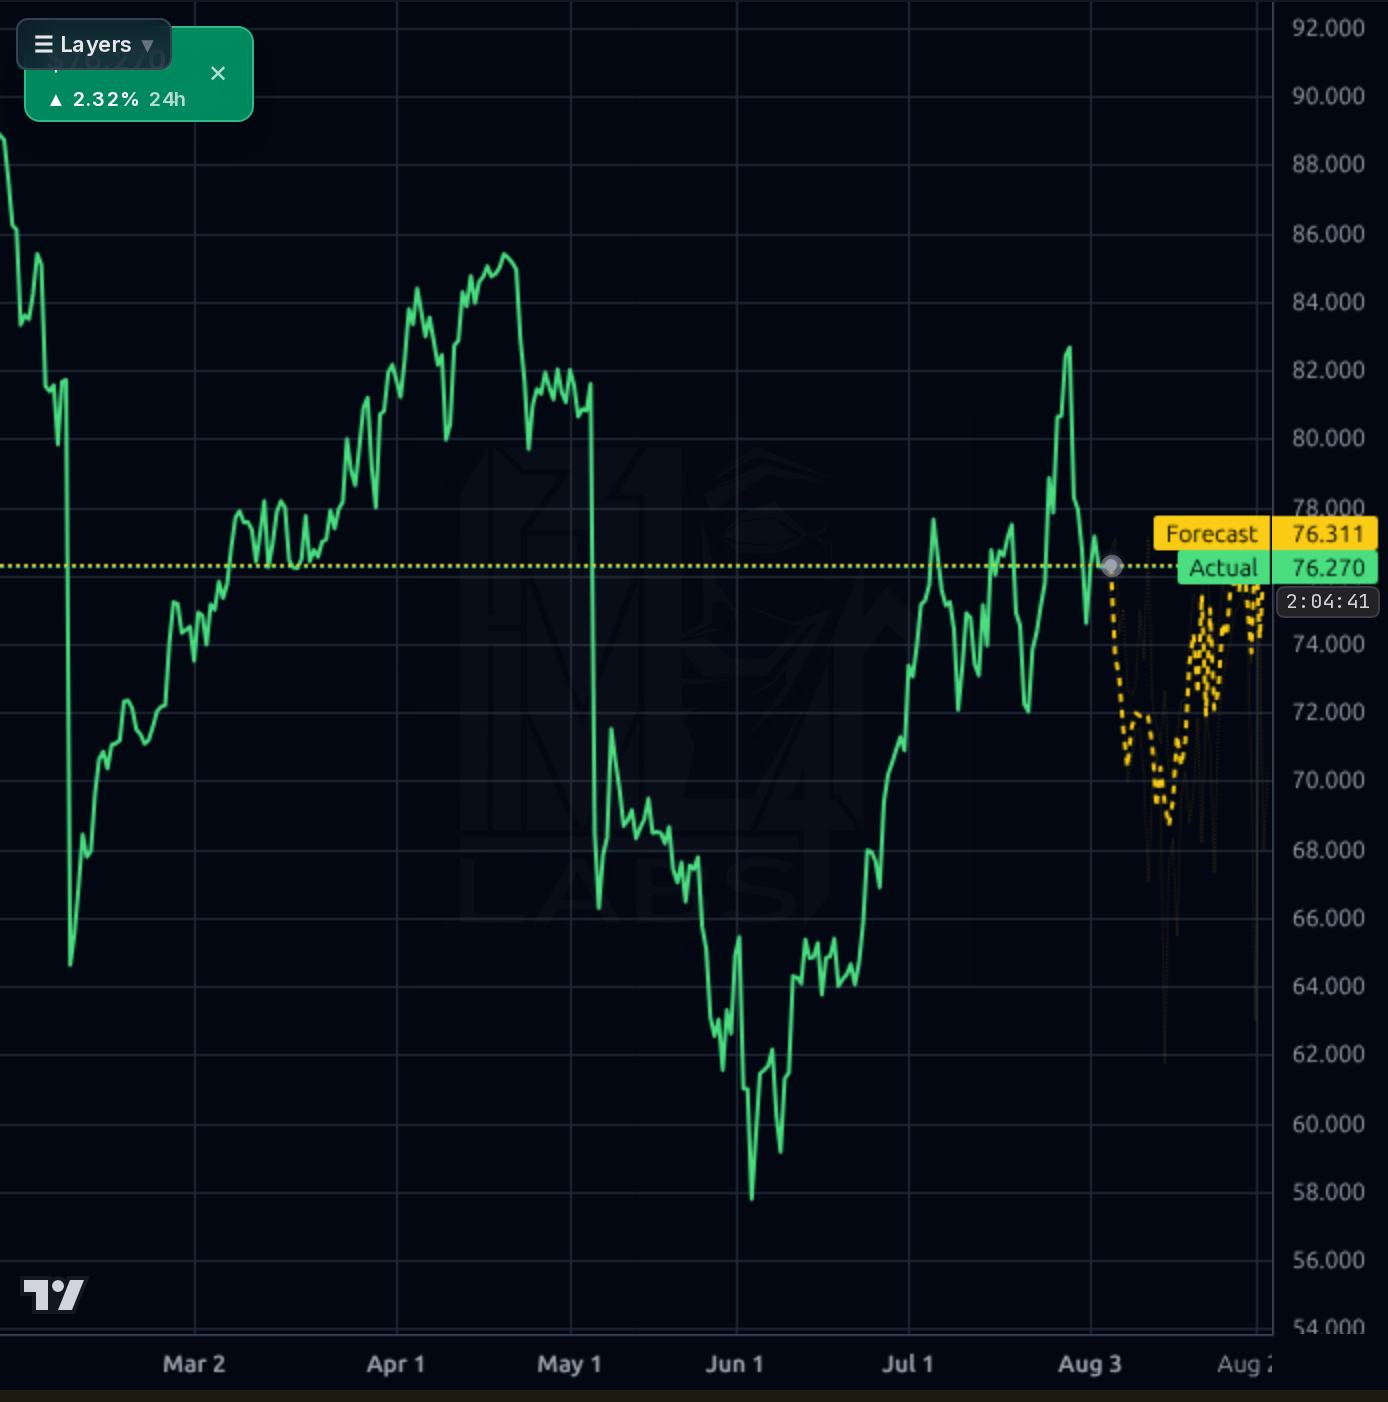
Hold until earnings (Oct 29) as price is near forecast band support; invalidation below $70.27 (52-week low).
Target $89.44 (avg PT) by Q1 2027 if Back-Up Care continues to outperform and debt reduction progresses; catalyst: earnings guidance exceeding expectations.
Terminal value hinges on margin expansion and deleveraging; structural risk is sector-wide consumer spending weakness, but long-term growth potential remains strong with $3.1B revenue target.
Revenue growth accelerated to 6.5% YoY in Q2 (Q1: -0.9%), driven by Back-Up Care's 19% surge, while gross margins expanded to 23.32%. Operating margins improved to 10.27% due to operational efficiency. However, the debt-to-equity ratio remains high at 163.52 (vs. industry avg of ~40), and negative working capital (-$498M) indicates liquidity strain. Free cash flow ($238.7M) supports debt servicing but is insufficient for meaningful deleveraging given $2B+ debt.
The chart shows a bullish trend with the price above the 50-day SMA (+9.34% vs. 20-day SMA +0.48%) and forecast bands indicating upside potential (forecast: $90.828). The current price ($76.27) is near the lower band of the forecast, with support at $70.27 (52-week low) and resistance at $83.10 (SMA 50). Momentum indicators like RSI (53.25) suggest neutral momentum, but the model's directional accuracy for 1d is strong (73% vs. naive baseline), supporting near-term upside.
Q2 results exceeded expectations with Back-Up Care driving growth (+19% revenue), while Full Service lagged due to Australia headwinds. Analysts are split: UBS raised PT to $88 (Neutral) but Morgan Stanley lowered it to $68 (Underweight). The stock is trading near the lower end of its 52-week range ($57.63-$130.76), with retail sentiment overwhelmingly bullish, though institutional ownership remains high at 107.43%.
- Back-Up Care segment revenue surged 19% YoY in Q2 (Q2 2025: +8.7%) due to occupancy gains and margin expansion
- High debt-to-equity ratio (163.52) limits flexibility; Australia headwinds could disrupt Full Service growth
- Sector volatility from consumer discretionary spending cycles may amplify downside risk
Get AI analysis on any stock
This is one of hundreds of Kronos AI reports — scored fundamentals & technicals, bull/base/bear price targets, a multi-horizon plan, and continuously-updated forecasts across the market. Create a free account to explore them all.
Create your free account →Already a member? Sign in · Join our Discord