BILI — AI Stock Forecast & Price Targets
Published 9/1/2026 · A free sample of K3vl4r’s AI-powered analysis.
Kronos price forecasts, scored fundamentals & technicals, and a multi-horizon plan.
View the live BILI price forecast →
Bilibili remains a fundamentally improving Chinese ADR story — 16 straight quarters of gross-margin expansion (~37%), advertising +28% YoY, GAAP profits, net cash, and an active buyback — yet the tape is structurally broken with price at $16.16, ~30% below the 200d SMA, RSI 38, and institutional ownership bleeding from 13.5% to 8.4%. With the next earnings 72 days out and $15.79 as the line-in-the-sand floor, the higher-probability strategy is disciplined accumulation on weakness with tight invalidation, not aggressive positioning for a re-rate that has repeatedly failed to arrive.
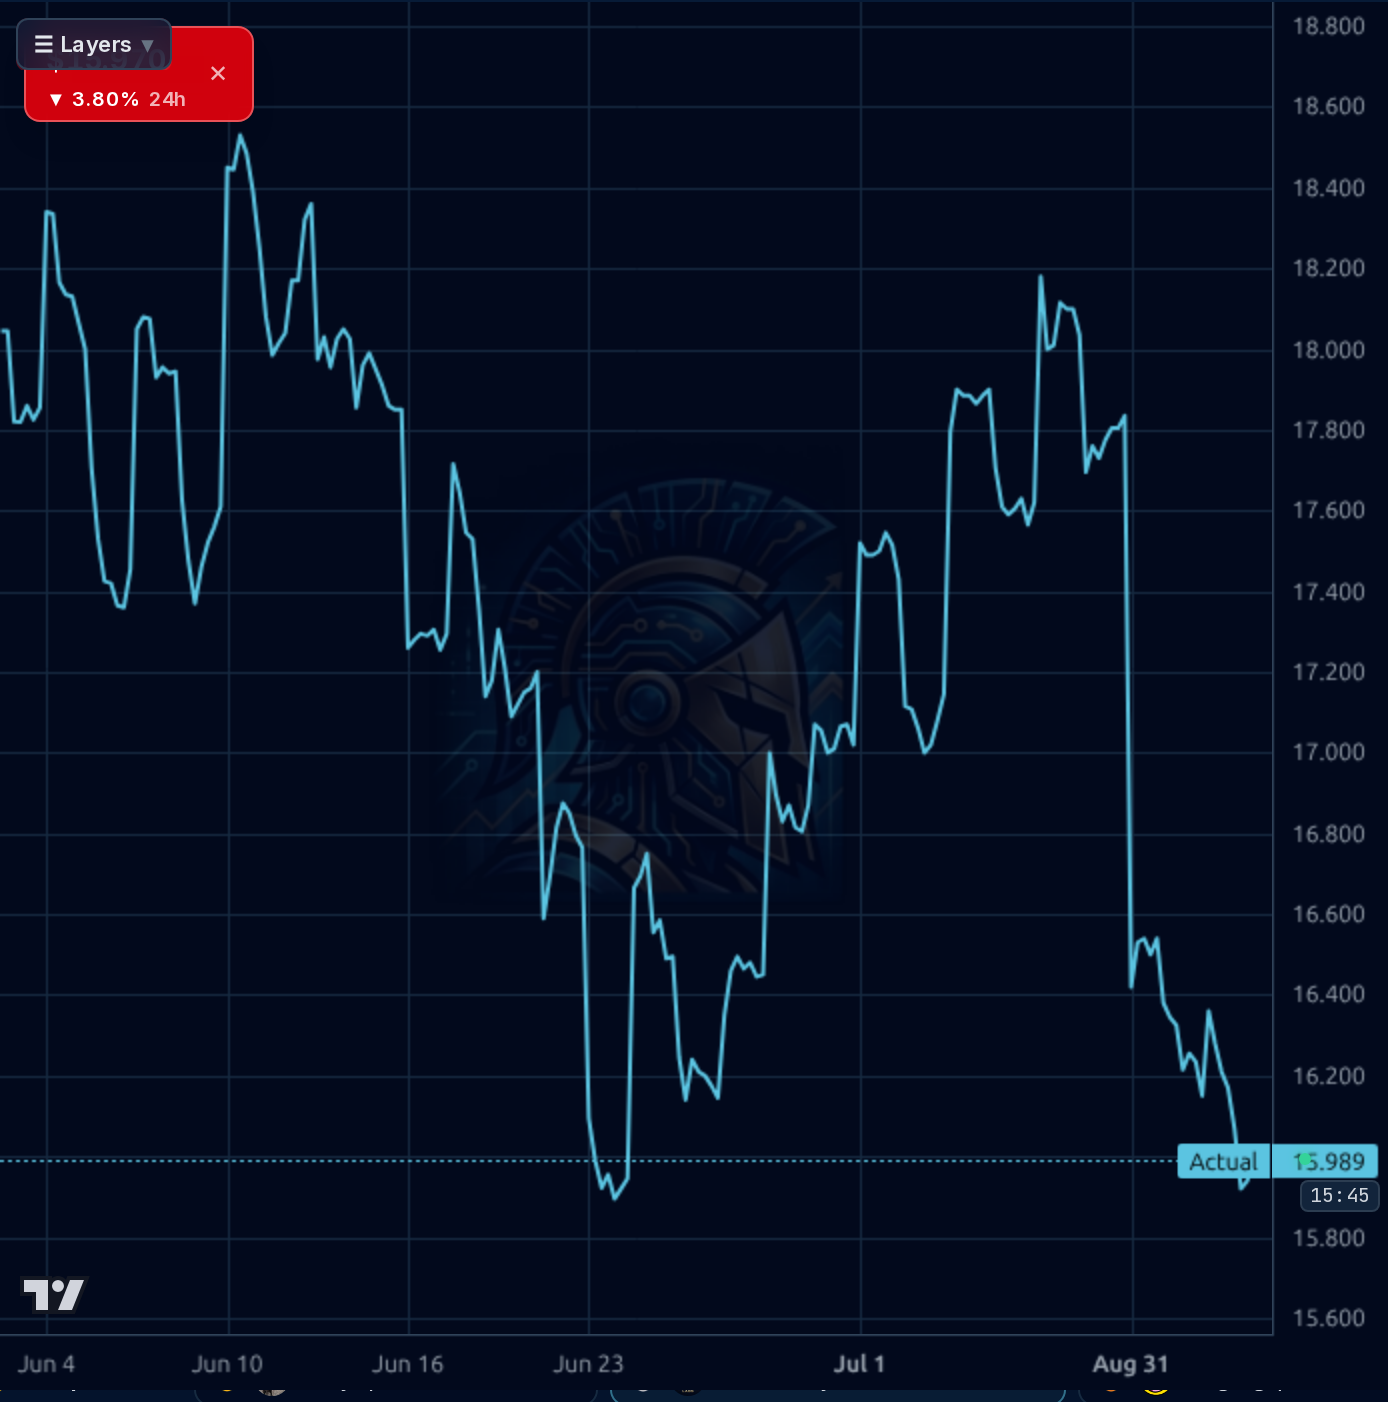
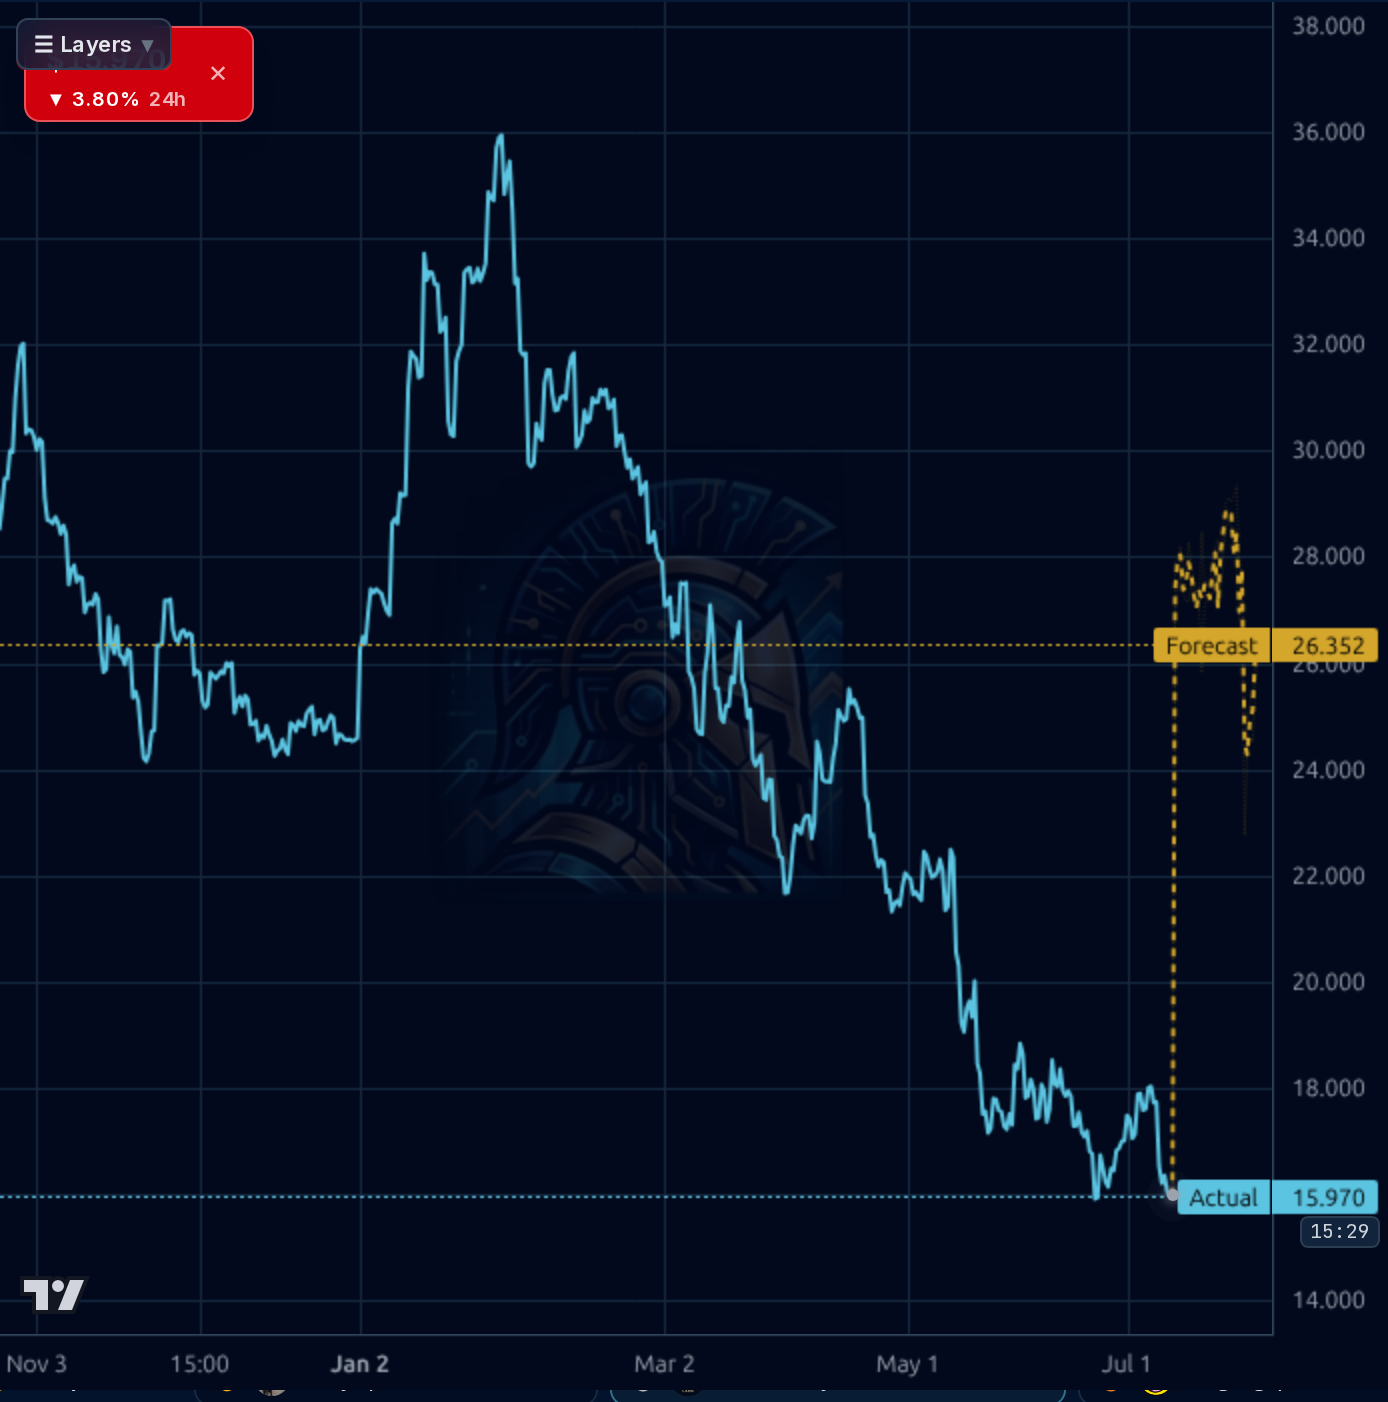
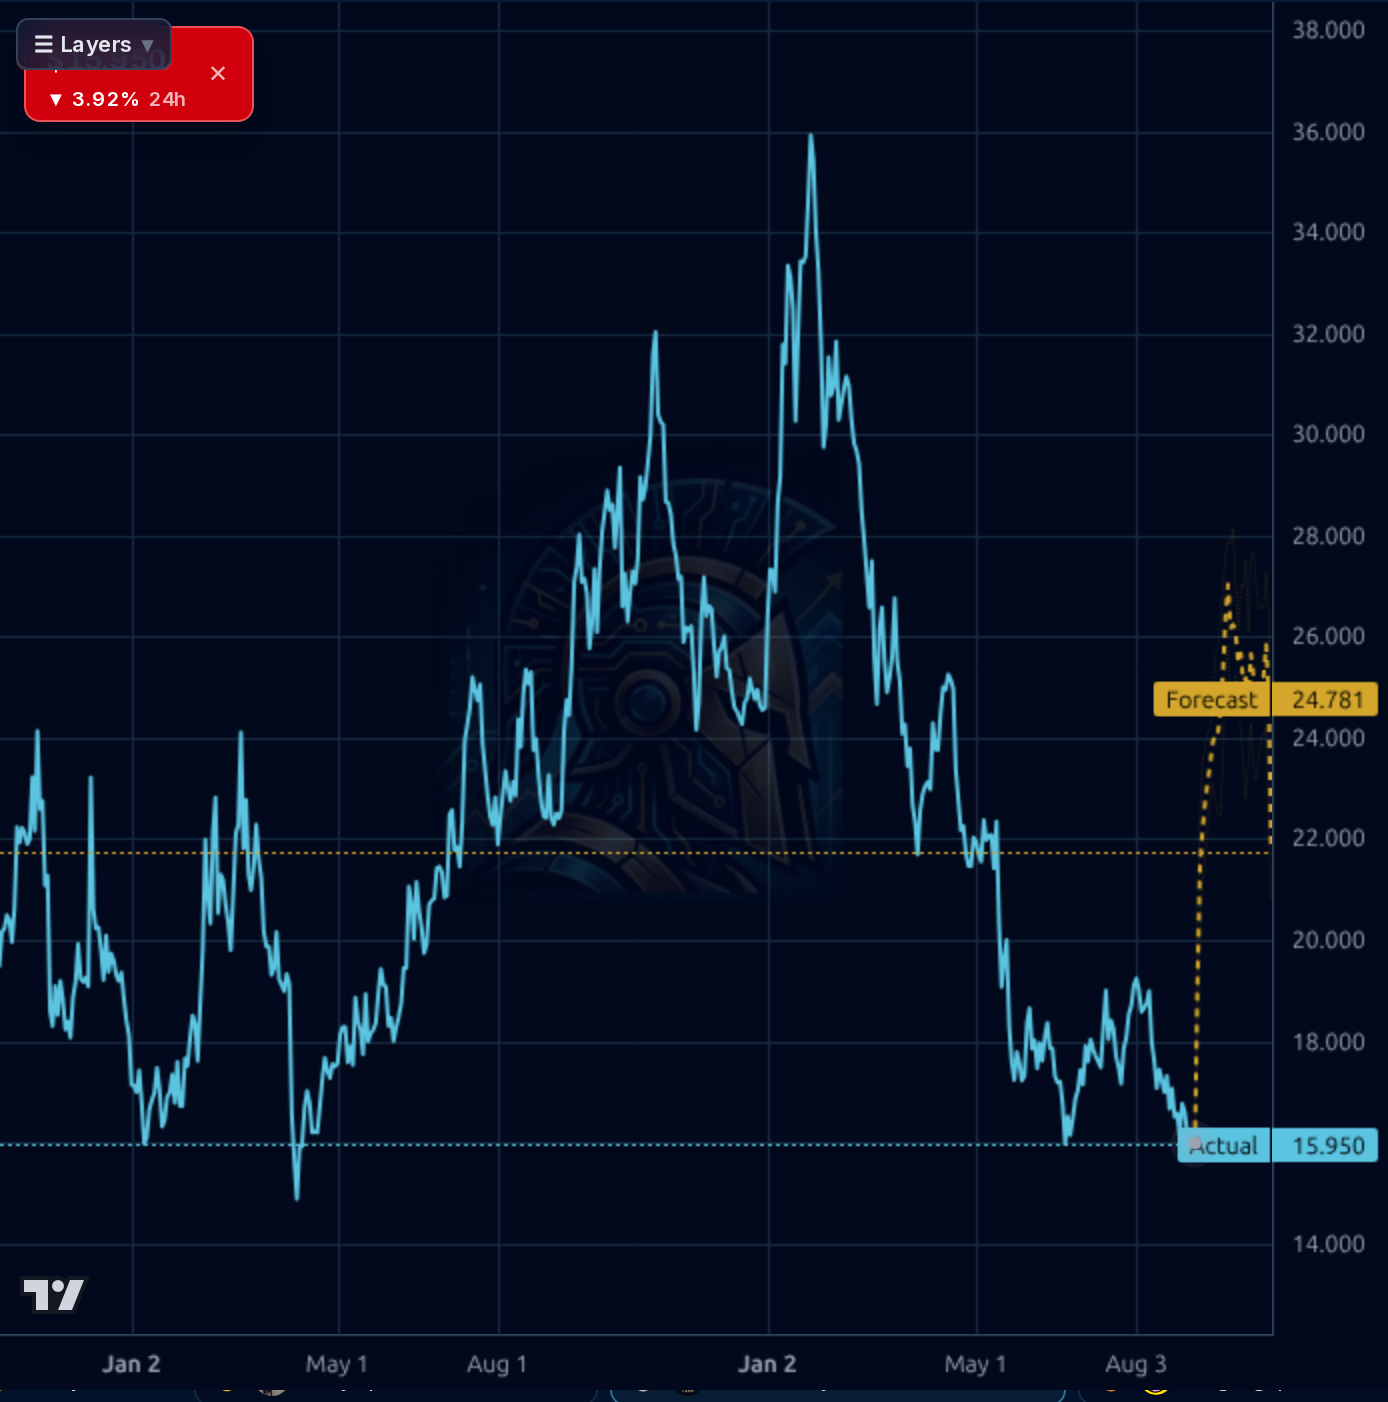
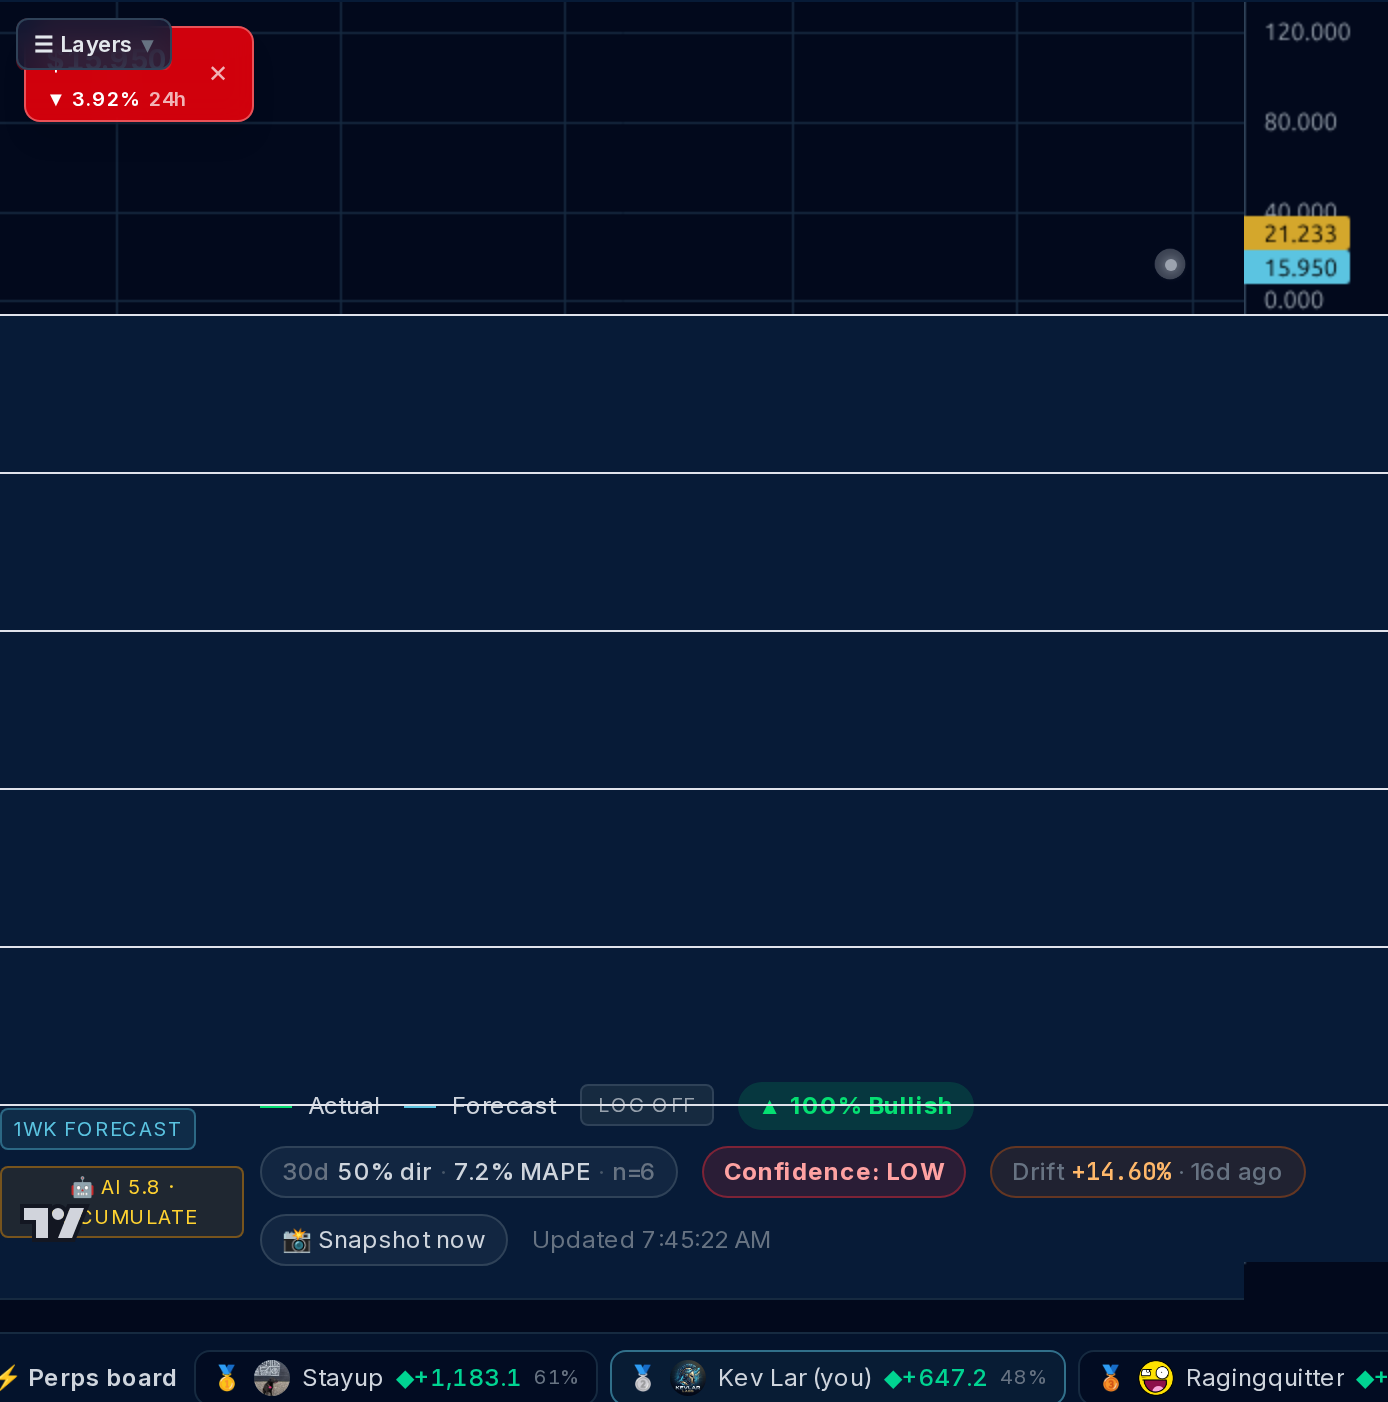
1-4 weeks: The tape is at the 52-week low with RSI 38 and no clear reversal signal. Do not chase; accumulate in tranches only on weakness toward $15.79-16.00, with a hard stop-out discipline if $15.79 breaks on volume (that opens $13-14). First upside gate is a reclaim of $17.30-17.60 SMA cluster on above-average volume — until then, this is a range-bound to down-drifting name. Sizing: 1/3 starter position, not full allocation. The model's bullish 1wk forecast to $24 is unreliable (50% directional accuracy vs 100% naive) — discount it heavily.
1-6 months: The Nov 12 Q3'26 print is the primary catalyst — the question is whether operating margin recovers from the Q1'26 2.2% trough back toward 5%+ and whether ad growth sustains at 20%+. If it does and price is still in the $15-17 zone, the setup for a re-rate toward $19-20 becomes cleaner. Expected return range: -15% (break of $15.79 → $13) to +20% (reclaim of $19-20 base). What would change my mind bullish: reclaim of the 200d SMA (~$23) on volume plus institutional ownership stabilizing above 9%. What would change my mind bearish: another operating margin miss in Q3, or $15.79 breaking with sell-side downgrades.
1-3 years: Terminal thesis is that if Bilibili sustains gross-margin expansion to 40%+ and operating margin normalizes to 7-10%, on ~RMB 32-35B revenue this is a $2-2.5B annual EBITDA business with a fortress balance sheet — worth materially more than the current $5.5B market cap. Multi-year drivers: AI-powered ad monetization, ad-density runway across 115M+ DAUs, incremental global expansion optionality, and continued buyback float compression. Biggest structural risk: China ADR regulatory overhang and geopolitical multiple compression that has kept the Chinese internet complex trading at a persistent discount regardless of fundamentals — this may permanently cap achievable multiples even if execution is flawless.
The underlying business is genuinely improving: Q1'26 revenue RMB 7.47B with gross margin 37.1% (extending the 16-quarter streak), net income RMB 210M, and the prior four quarters all GAAP-profitable. Q2'26 commentary (per the earnings call recap) flagged advertising +28% YoY to RMB 3.1B — the clearest operational lever, powered by AI ad-targeting tools. Balance sheet is a real anchor: RMB 24.3B cash vs RMB 9.5B debt (net cash ~RMB 14.8B on a market cap of only ~$5.5B/RMB ~39B), Cash/sh $10.57 — ~65% of the share price is cash. Operating cash flow RMB 1.99B and FCF RMB 1.6B in Q2'25 support the $300M buyback. Two concerns temper the story: (1) Q1'26 operating margin dropped to 2.2% from Q4'25's 6.1%, showing the recovery is non-linear, and (2) mobile gaming softness plus R&D reinvestment cap near-term operating leverage. Forward P/E 12.5x and PEG 0.52 look cheap if the margin trajectory holds — but that's the exact conditionality the market keeps refusing to underwrite.
Every timeframe shows a broken trend. Weekly and daily charts show a lower-high sequence from the January $36 peak with price now at $16.16, sitting on the 52-week low of $15.79 (52W range position ~2%). Price is -7.1% below the 20d SMA, -8.0% below the 50d SMA, and a devastating -30.4% below the 200d SMA — the classic bearish stack. RSI 38 is weak but not yet oversold enough to force a mean-reversion bounce. The 1h chart shows a persistent lower-high, lower-low structure since the June rally to $18.50 failed, with a sharp gap-down in late August confirming supply. The 4h forecast band projects $24-28 within a week — an extraordinary +50%+ move that has zero technical foundation and is unreliable given the model's own realized 1d directional accuracy of 11% vs a 90% naive baseline. $15.79 is the must-hold floor; a decisive break opens the $13-14 tail zone. First resistance is the SMA20/50 cluster near $17.30-17.60, then $18.50 (recent lower high), then the $22 declining trendline.
The signal is that Q2'26 earnings (Aug 27) delivered a clean beat — 16 consecutive quarters of gross-margin expansion, ad revenue +28% YoY (14 straight quarters at 20%+), AI advertising revenue doubling, and GAAP net profit +55% YoY. Multiple outlets (Insider Monkey, Motley Fool, Seeking Alpha) framed the print as evidence the flywheel is intact, and volume spiked on the report per MarketBeat. The noise: retail social sentiment is 100% bullish (contrarian yellow flag on a broken tape), and unverified 'global expansion via Netflix AI-ad partnership' claims from lower-tier sources should be treated skeptically until confirmed. The bearish signal that matters more than the print: a sell-side price target cut ($28.75 → $27.06) and institutional ownership dropping 5.1 percentage points to 8.4% — smart money is exiting despite the numbers, which is exactly why the stock has failed to rally on beats.
- Advertising revenue growth of +28% YoY in Q2'26 (14th consecutive quarter of ≥20% growth), with AI-driven ad revenue reportedly doubling YoY — the clearest and most durable operational lever
- 16 consecutive quarters of gross-margin expansion now at 37.0%; path to 40%+ unlocks material operating leverage on a mostly-fixed cost base
- $300M buyback active against 338.8M shares outstanding provides mechanical float compression at depressed valuation
- Q3'26 earnings on Nov 12 — sequential operating margin recovery from Q1'26's 2.2% trough back toward 5%+ would be the structural catalyst the tape has been waiting for
- Global expansion push into international markets (relaunched initiative per August 2026 reporting) creates optionality for revenue diversification beyond China
- Net-cash balance sheet with Cash/sh $10.57 (~65% of market cap) provides substantial optionality for further buybacks, M&A, or capital return
- Persistent institutional distribution: ownership dropped from 13.5% to 8.4% in ~45 days despite clean Q2 beat — smart money is voting with its feet
- Technical breakdown risk: price -30.4% below 200d SMA, sitting on 52W low of $15.79; a decisive break opens the $12-14 tail zone
- Operating margin volatility: Q1'26 collapsed to 2.2% from Q4'25's 6.1%; another disappointment in Q3 breaks the recovery narrative
- Chinese ADR regulatory/geopolitical overhang structurally caps achievable multiples regardless of execution
- Sell-side price targets drifting lower ($28.75 → $27.06) — analysts progressively less confident
- Mobile game revenue softness plus R&D reinvestment pressures near-term operating leverage
- Directional forecast model is unreliable in this regime (11% accuracy vs 90% baseline); do not underwrite the bullish forecast band
- Market has repeatedly failed to reward earnings beats — a structural technical catalyst (volume + SMA reclaim) is required, not just a fundamental one
Get AI analysis on any stock
This is one of hundreds of Kronos AI reports — scored fundamentals & technicals, bull/base/bear price targets, a multi-horizon plan, and continuously-updated forecasts across the market. Create a free account to explore them all.
Create your free account →Already a member? Sign in · Join our Discord