BIRK — AI Stock Forecast & Price Targets
Published 8/6/2026 · A free sample of K3vl4r’s AI-powered analysis.
Kronos price forecasts, scored fundamentals & technicals, and a multi-horizon plan.
View the live BIRK price forecast →
BIRK is a fundamentally strong premium footwear brand (54% gross margin, 25% operating margin, 20% TTM sales growth) trading at a compressed ~13.4x forward P/E after a brutal ~18% monthly drawdown to $37.48 near the 52w low. With a binary earnings print in 7 days, RSI at 32, and price sitting at a critical support shelf, this is a HOLD into the print — the risk/reward is asymmetric but the setup is too binary to accumulate aggressively.
HOLD into the August 13 print — do NOT size a new swing here. The setup is oversold (RSI 32, -18% MoM) with a coiled reversal potential, but earnings is a binary event with demonstrated downside asymmetry (Q2 gapped -13%). If already long, tolerate the position with a stop below $36.50 (prints a fresh multi-month low and invalidates the support shelf). For fresh entries, wait for either (a) a post-print reset near $32-34 with reaffirmed guidance, or (b) a reclaim of $39.50 on strong volume post-earnings. Key catalyst/invalidation: the Aug 13 print itself.
Base case: BIRK re-anchors between $40-46 over 3-6 months as the earnings uncertainty resolves and the compressed multiple (13.3x fwd P/E, PEG 0.84) attracts value/quality buyers. A clean beat + reaffirmation of FY guidance likely drives a re-rating to $46-50; a soft print or FY guide-down likely retests $32-34. Watch: (1) DTC/owned-retail productivity commentary, (2) Asia growth cadence, (3) pricing power in a softer consumer environment, (4) sponsor overhang / any secondary filings. Change my mind: sustained margin compression below 22% operating, or evidence of brand-fatigue in DTC unit economics.
1-3 year thesis is intact: Birkenstock is a scarce, ~250-year-old heritage brand with genuine pricing power, 54% gross margins, and a multi-decade retail/geographic buildout runway. If the company can compound revenue at low-to-mid teens with margin stability, EPS can reach $3.50-4.00 by FY28, supporting a $55-70 fair value at reasonable multiples. Biggest structural risks: (1) sponsor-driven secondary offerings creating persistent overhang, (2) elevated debt limiting flexibility in a downturn, (3) fashion-cycle risk to the core sandal franchise, (4) consumer discretionary cyclicality in a late-cycle US economy.
Fundamentals remain solid but showing incremental softening. TTM revenue of €2.18B with Sales Y/Y TTM of +20.4% and Q/Q sales +19.7% confirm durable double-digit growth, driven by DTC/owned-retail buildout. Margins are healthy — gross margin 53.9-57.8% and operating margin 24.5-26.9% — though Q1 FY26 (Dec-25) showed a seasonal dip in operating margin to 20.3% before recovering to 26.3% in Q2. Profitability is intact: ROE 12.5-12.9%, ROIC 8.5%, net margin ~16%. Balance sheet carries meaningful leverage (total debt €1.37B vs €201M cash, D/E 0.47, EV/EBITDA 10.8x) but current ratio 2.95 and €190M TTM FCF cover the burden. The concern: Q2 FY26 EPS missed ($0.58 vs $0.70 consensus) with EPS Q/Q of -11.6%, and OCF in the seasonal weak Q1 was negative (-€28M). Valuation at 13.3x fwd P/E, PEG 0.84, and P/S 2.73 is reasonable for a brand with these growth/margin characteristics — the market has already de-rated meaningfully.
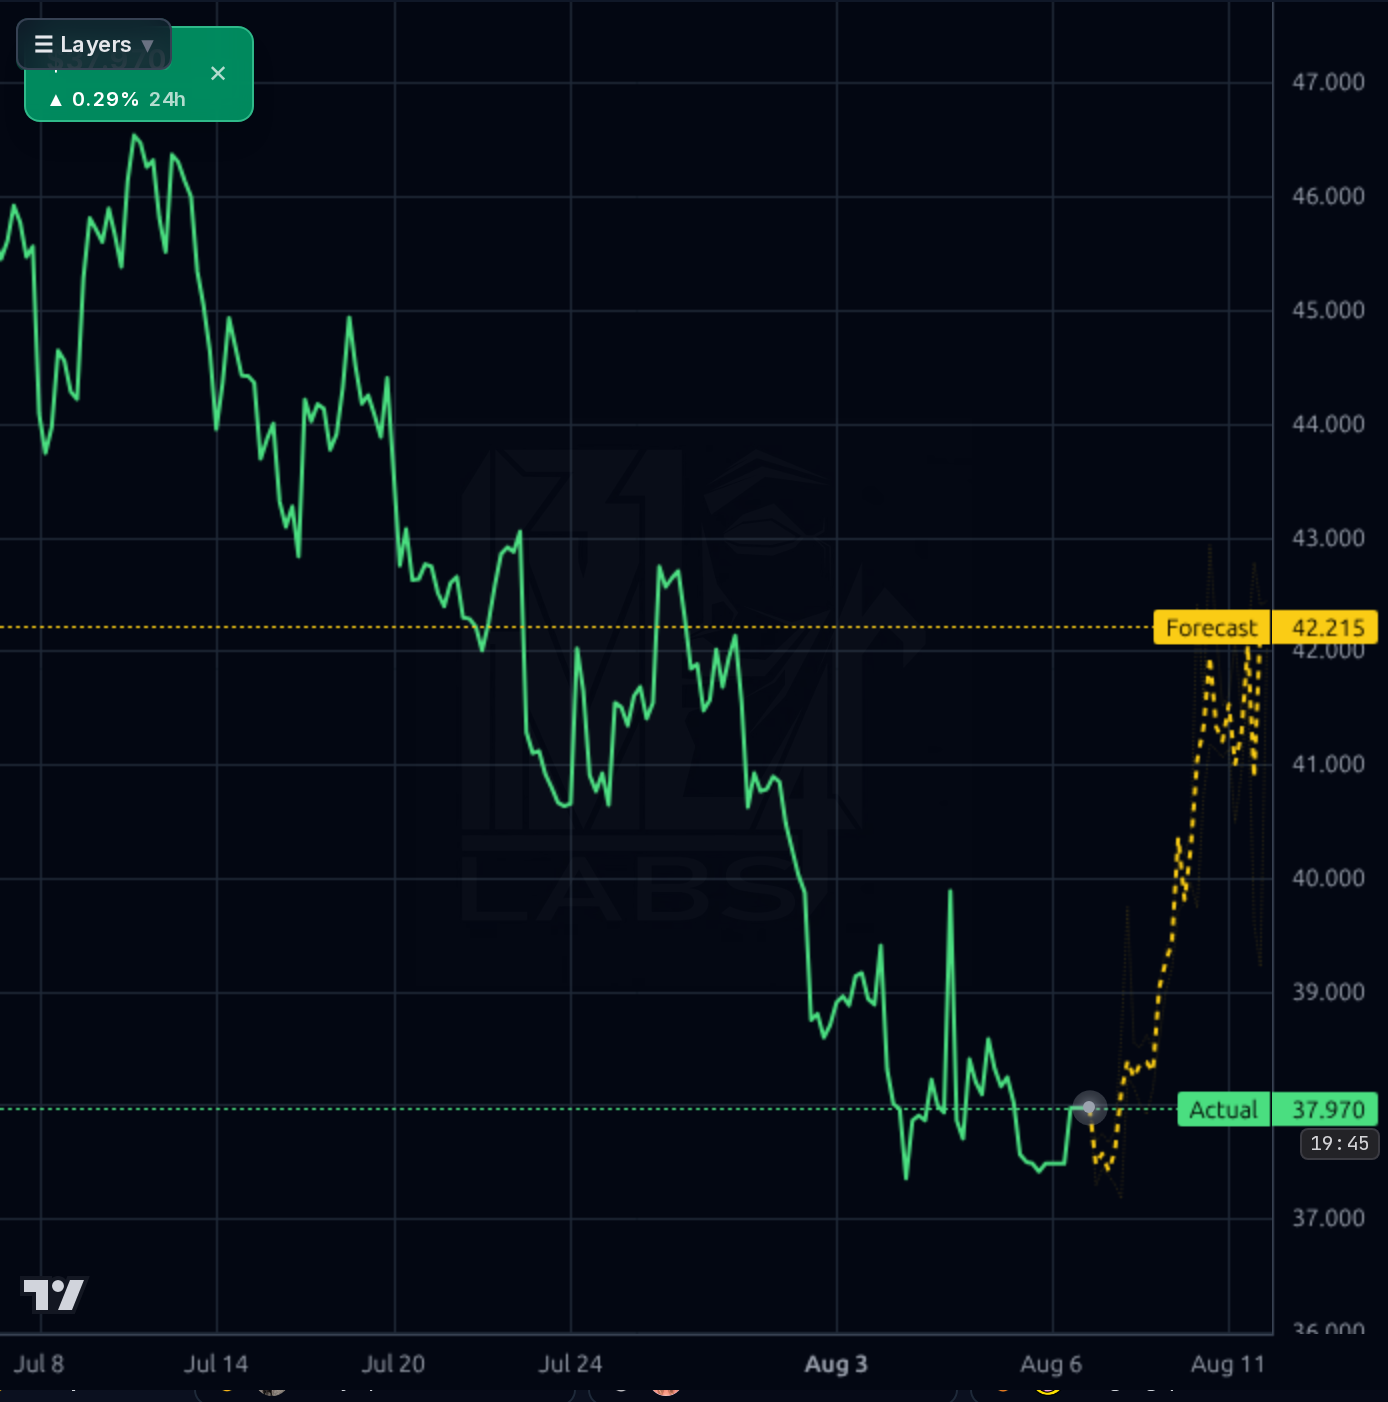
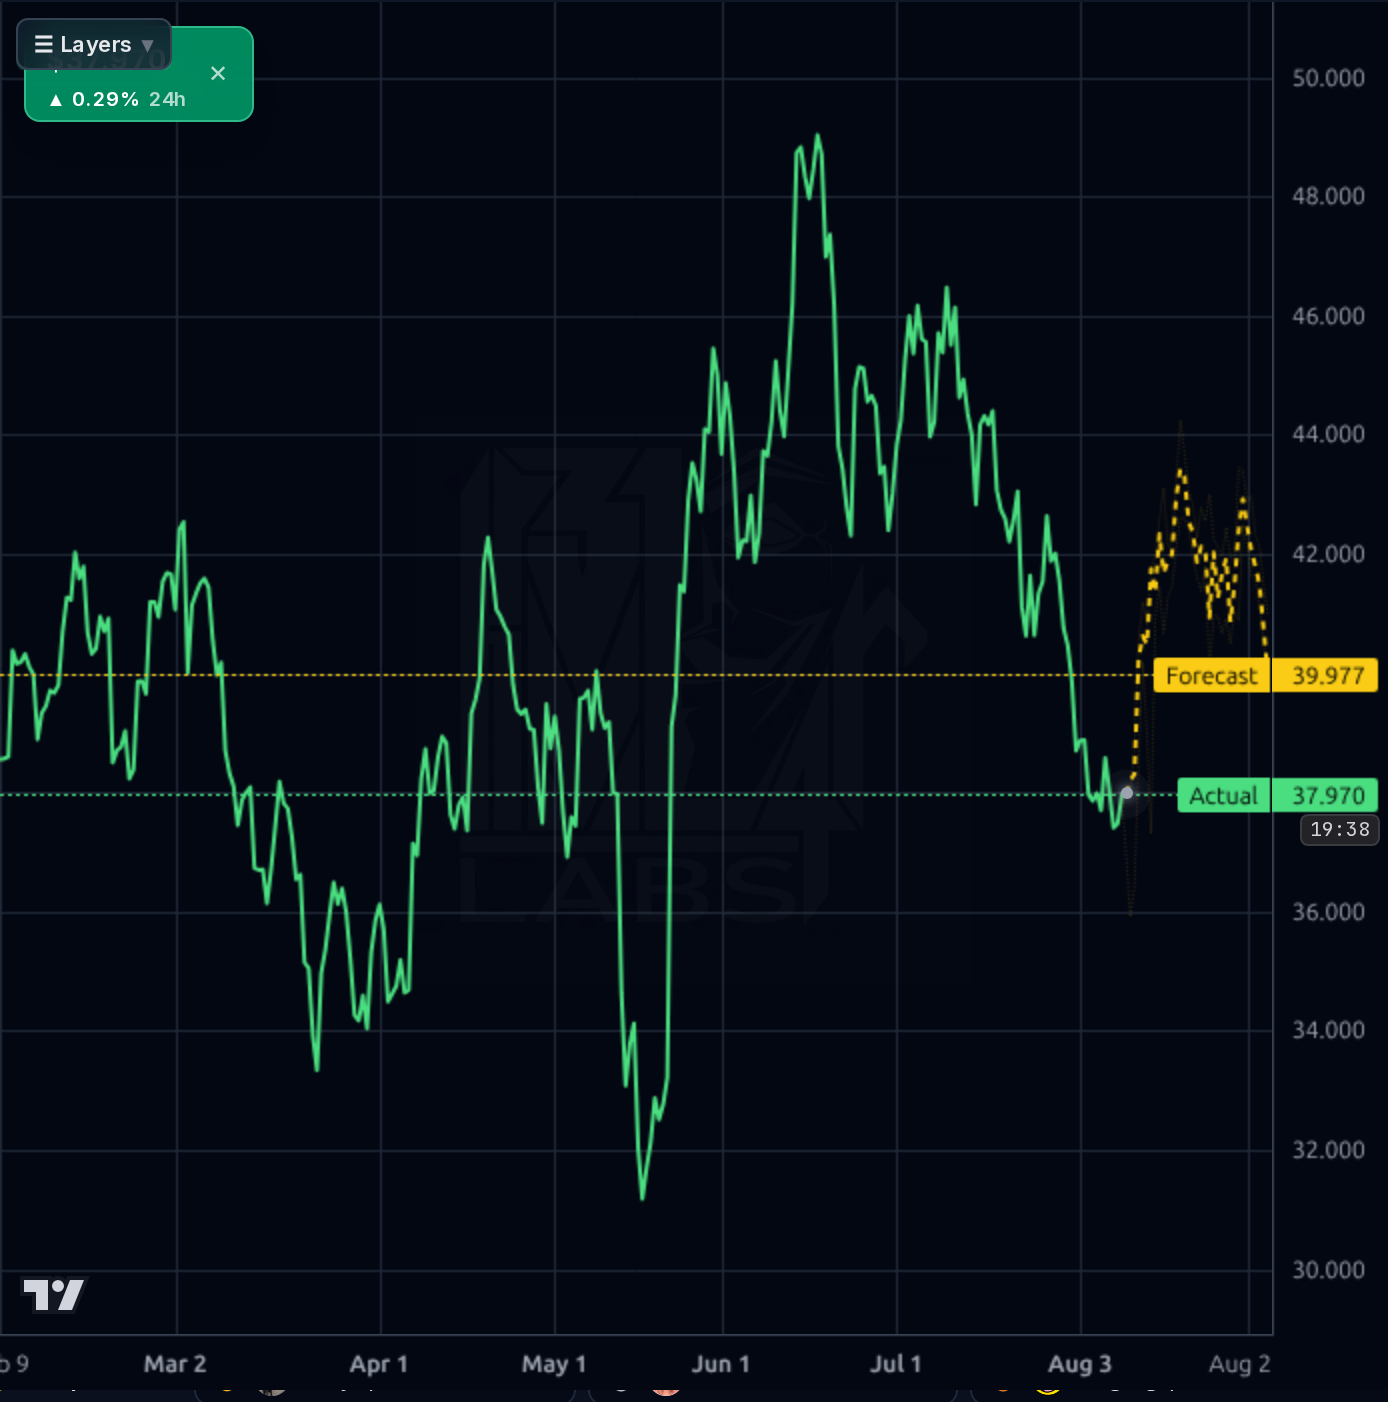
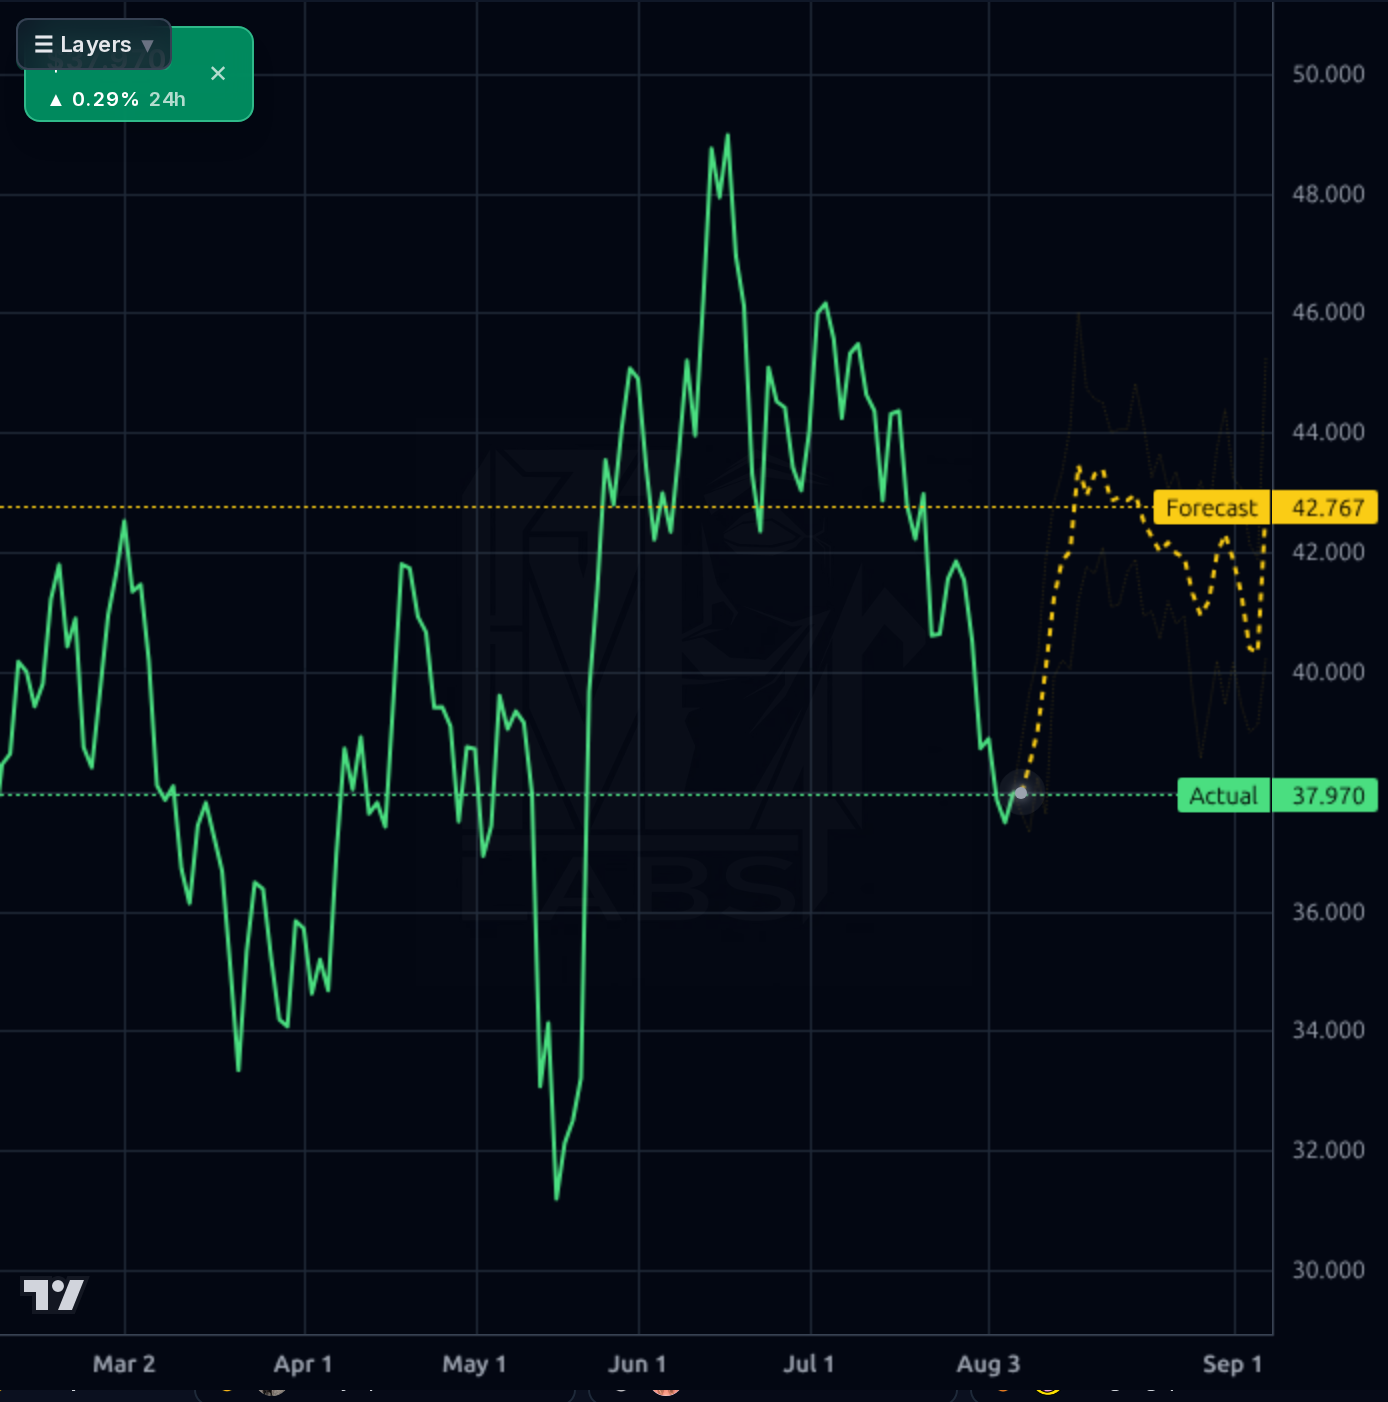
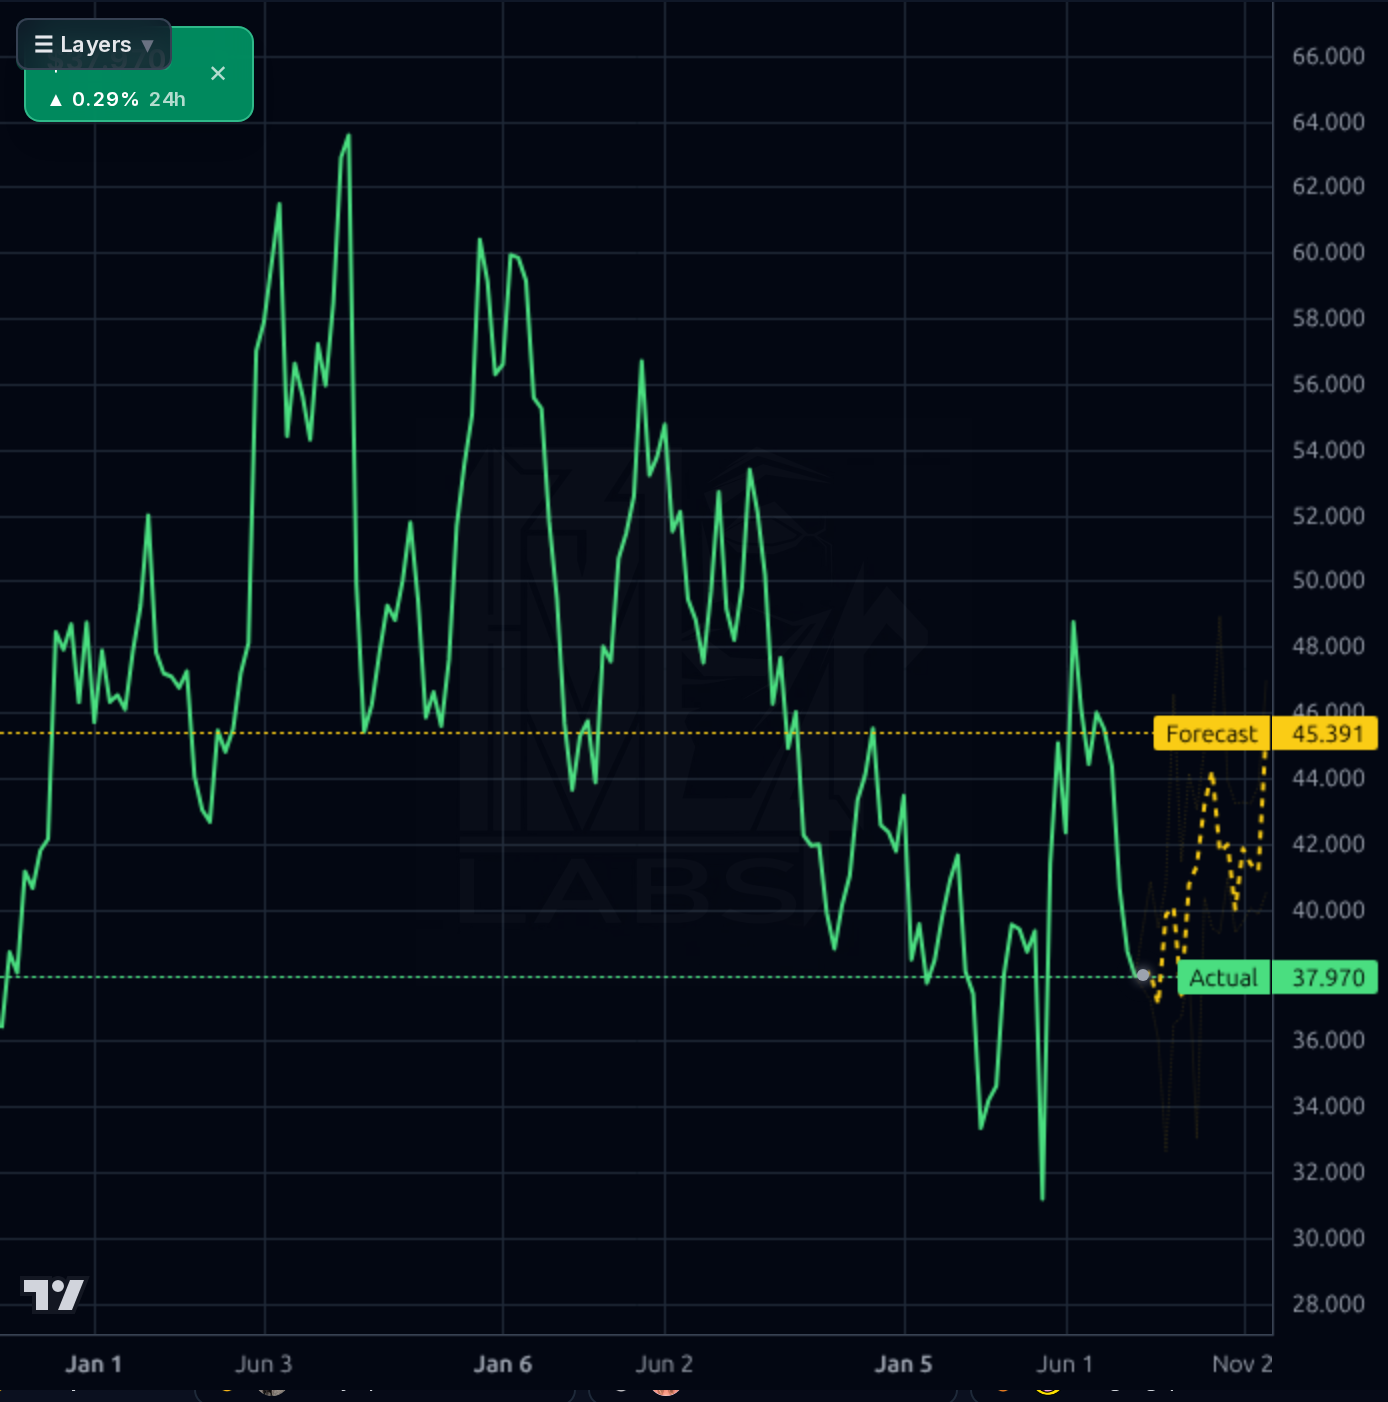
Technicals are decidedly bearish short-term but stretched to potential exhaustion. On the 1h/4h charts, price collapsed from $46 in early July to $37.97 with a clean lower-high/lower-low structure, breaking below the $39 support shelf that had held prior lows. The 1d chart shows a full round-trip of the June-July rally — price is now testing the May-Aug consolidation base near $37-38. On the weekly, the stock is sitting near a multi-quarter support zone (~$37) that previously held in Feb 2026. RSI at 32 signals oversold, Perf Month -17.7%, Perf Week -9.8%, price -10.6% below SMA20 and -14% below SMA50 — the setup is deeply extended to the downside. The model's forecast band projects a rebound toward $42.2 (1h/4h) and $42.7 (1d), but the model has been beaten by the naive baseline on both timeframes, so discount heavily. Key levels: $37 (immediate support/52w low $31 secondary), $39 (reclaimed = short-term bull signal), $42-43 (major resistance shelf), $46-48 (major supply).
The dominant near-term item is the Q3 FY26 earnings print on August 13 (7 days). Consensus expects EPS $0.86-$0.87, +22-23% YoY, and management previously guided 13-15% revenue growth. This follows a Q2 miss that triggered a -12.9% single-day drop, so the market is understandably tentative. Sell-side remains constructive with average target ~$53.34 (UBS $76 Buy, JPM raised to $58 Overweight), though Seaport downgraded to Neutral on July 20 citing weaker sell-through — that call has aged well given the subsequent drawdown. Retail expansion continues (21st/22nd US stores in Boulder and West Palm Beach), reinforcing the owned-retail thesis. Signal: fundamentals and analyst posture intact, but Seaport's caution and the price action itself suggest the market is bracing for potentially soft Q3 commentary. Noise: options-activity headlines and generic quality-screen mentions.
- US owned-retail buildout accelerating — 21st/22nd stores opened in Boulder and West Palm Beach in July, expanding brand-controlled distribution
- DTC channel expansion cited as a key Q3 focus by sell-side previews — higher-margin channel with pricing durability
- Asia DTC penetration as a multi-year growth vector supporting the 20% TTM sales trajectory
- Consensus Q3 EPS of $0.86 implies +23% YoY growth, with EPS next Y estimated at +22%
- Compressed 13.3x fwd P/E and PEG 0.84 leave room for multiple expansion if execution proves consistent
- Binary earnings risk Aug 13 — Q2 miss produced a -12.9% single-day gap; a repeat retests $32-34
- Technical breakdown — price -18% in a month, sitting at $37 support with $31 (52w low) as next level if the shelf fails
- Elevated leverage (total debt €1.37B, D/E 0.47) requires sustained FCF; Q1 FY26 saw negative OCF of -€28M
- Short float still elevated at 20.2%, indicating meaningful bearish positioning despite recent covering
- Sponsor overhang risk — secondary offerings historically cap rallies regardless of operational strength
- Sell-side signals mixed — Seaport's July 20 downgrade to Neutral preceded the sharp drawdown; execution scrutiny rising
- Consumer cyclicality — late-cycle US consumer exposure with concentrated footwear/sandal product mix
Get AI analysis on any stock
This is one of hundreds of Kronos AI reports — scored fundamentals & technicals, bull/base/bear price targets, a multi-horizon plan, and continuously-updated forecasts across the market. Create a free account to explore them all.
Create your free account →Already a member? Sign in · Join our Discord