BIRK — AI Stock Forecast & Price Targets
Published 8/5/2026 · A free sample of K3vl4r’s AI-powered analysis.
Kronos price forecasts, scored fundamentals & technicals, and a multi-horizon plan.
View the live BIRK price forecast →
BIRK combines durable double-digit revenue growth (Q2 FY26 +14% cc, Sales Y/Y TTM +20.4%) and healthy margins with a compressed forward multiple (~13.5x) that has been de-rated hard — the stock is down 18% in the last month and sits near 52w lows with RSI 33. However, earnings on Aug 13 is a binary event 8 days out, prior base targets on this name have overshot realized price by ~29%, and 20% short float plus sponsor overhang cap the near-term risk/reward. Best posture is a small pre-earnings accumulation with the real work reserved for post-print.
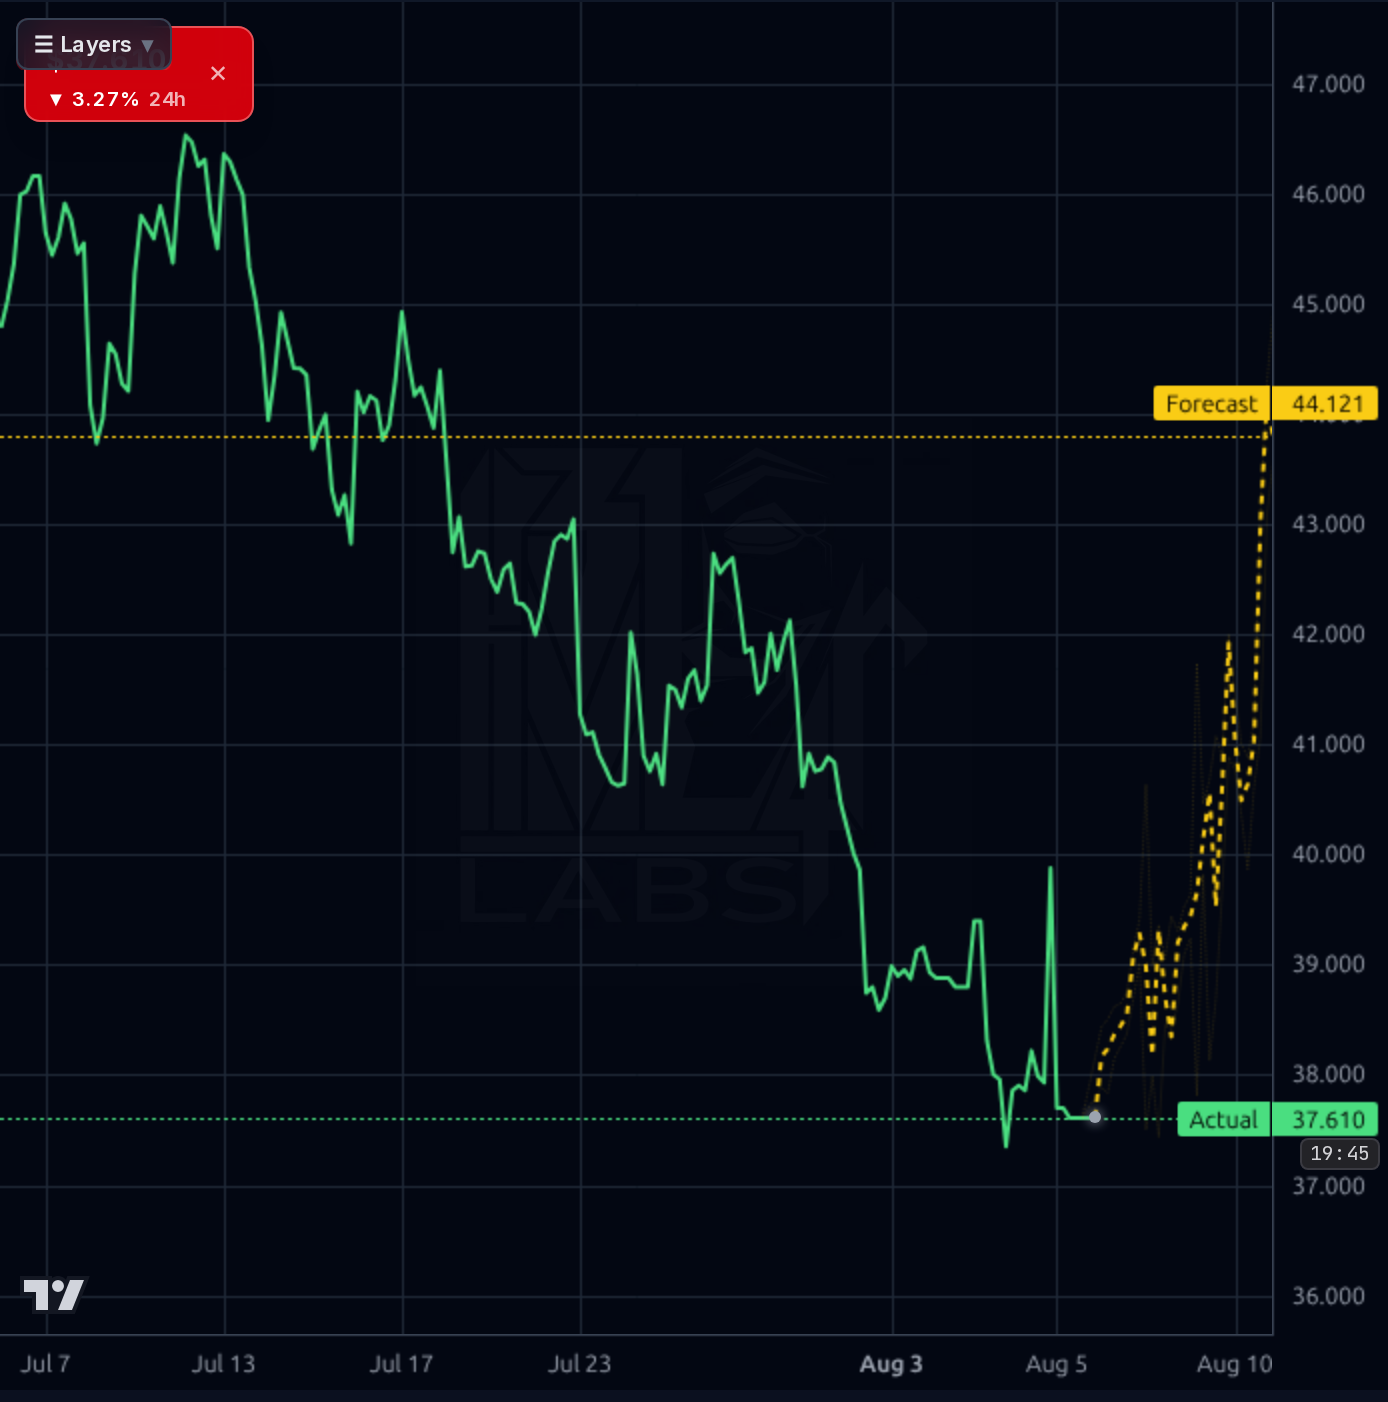
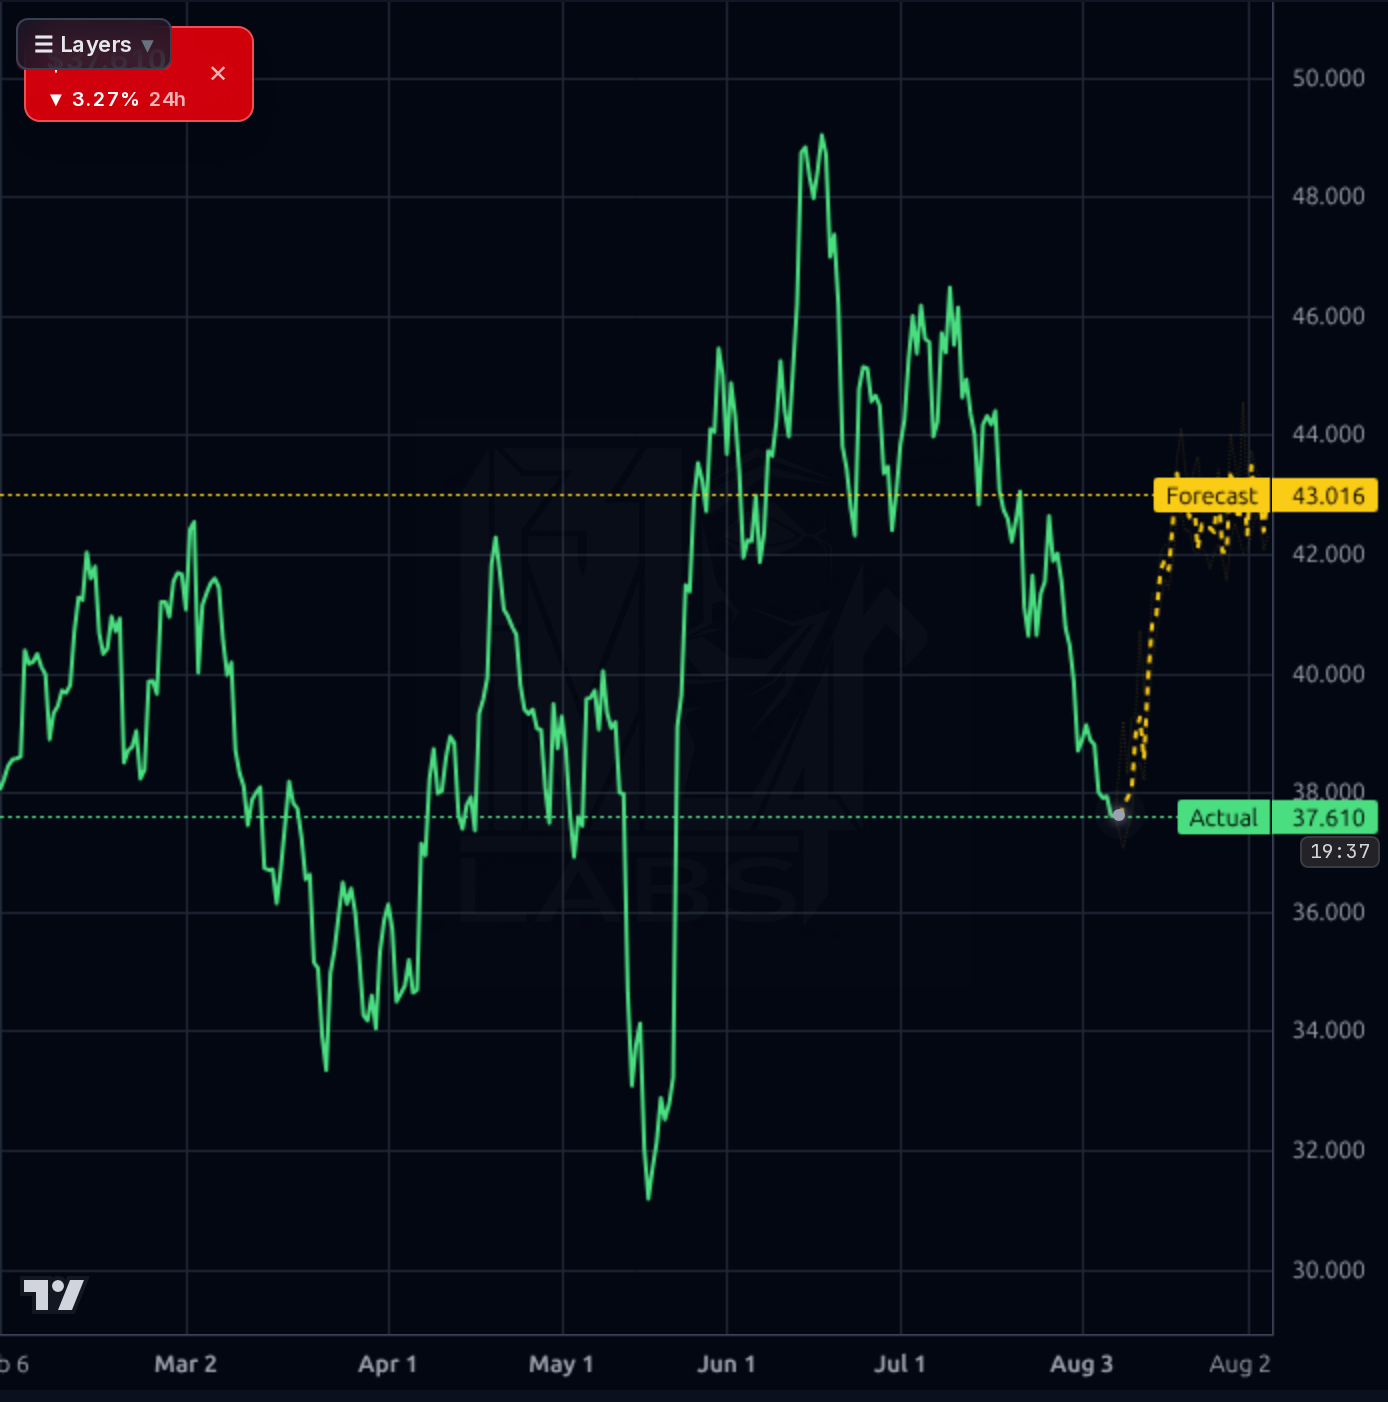
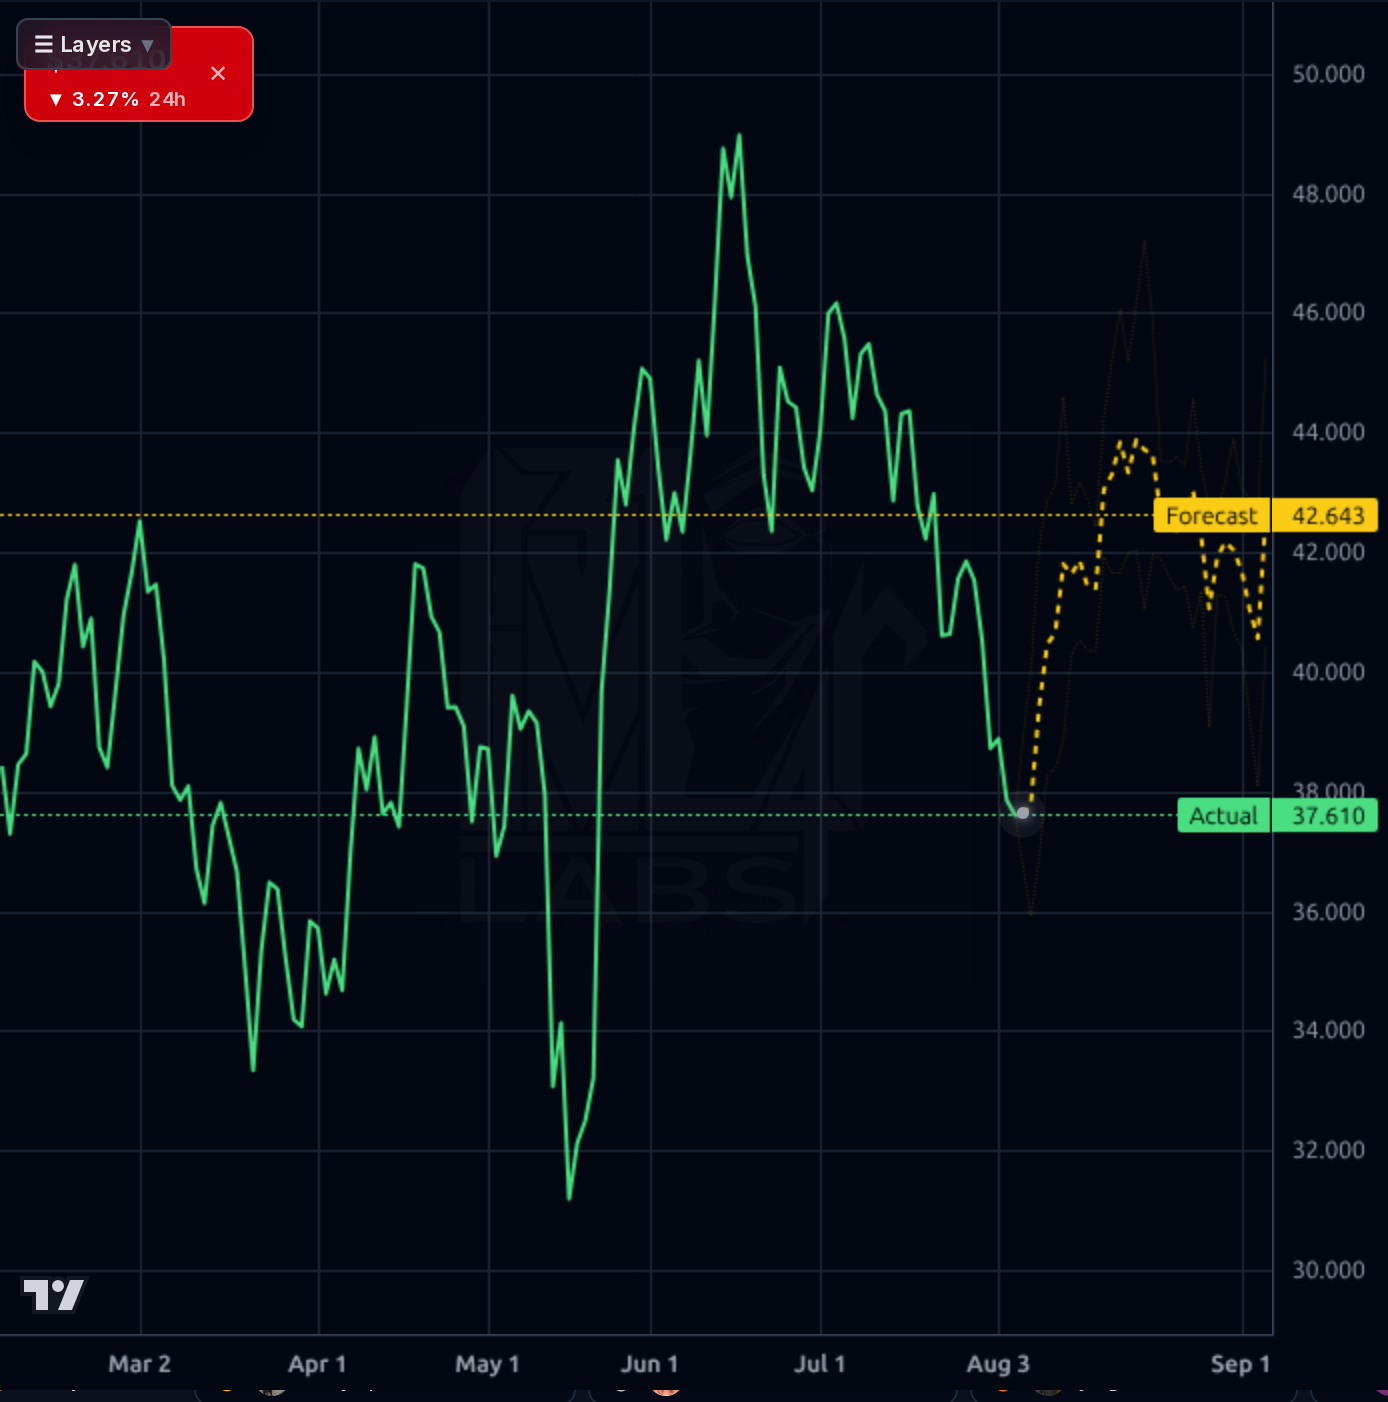
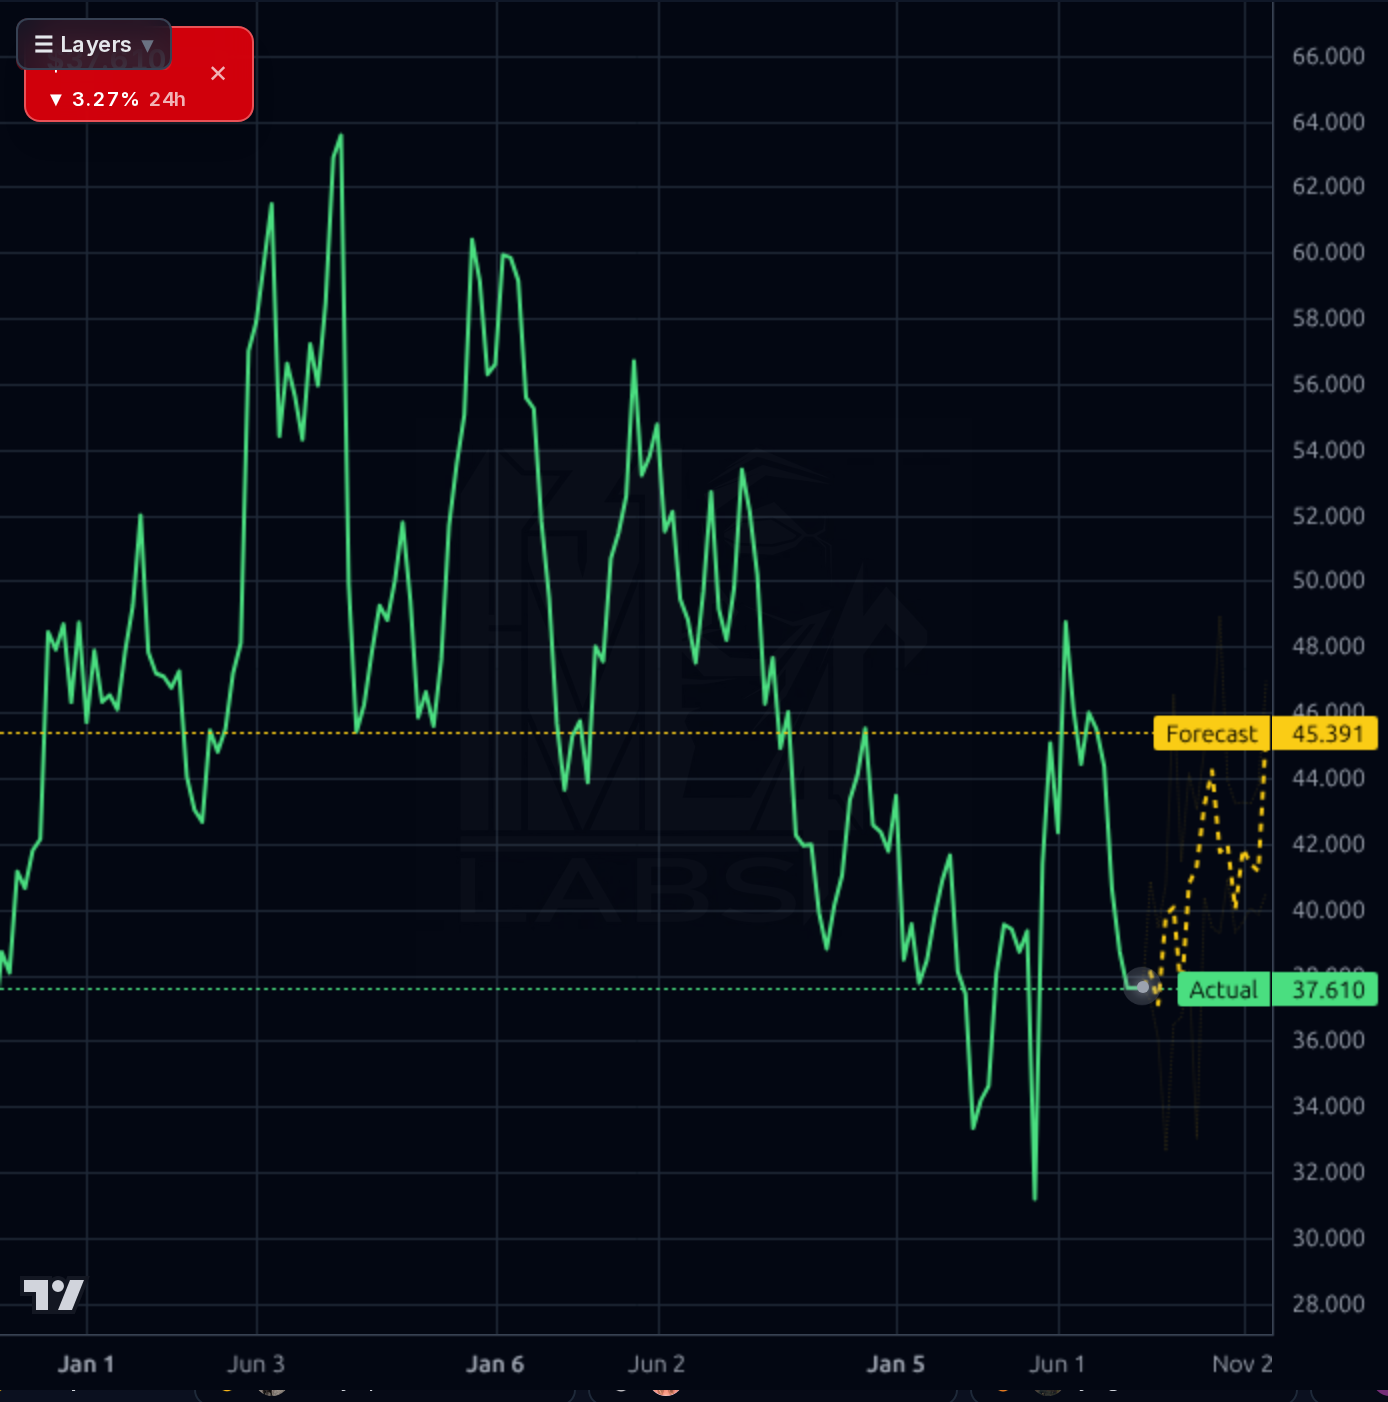
Pre-earnings only. Aug 13 is a binary gap event and should not be sized aggressively. A starter position (25-33% of intended size) in the $37-$38 zone is defensible given RSI 33, capitulation wick, and the model's projected bounce toward $42-$44 — but any 1-4 week target is conditional on the print. Invalidation: a close below $36.50 pre-earnings (breaks the recent low and the weekly structure). If the print gaps up and holds above $42, add. If it gaps down and loses $35, exit; do not average into a fundamentals miss with 20% short float.
1-6 months the setup is more attractive if Aug 13 confirms the 13-15% FY guide and margin stability. Base case reclaim of $43-$45 (prior consolidation) implies +15-19% from spot; bull case toward $50 requires an in-line-to-beat print plus a re-rating tailwind. What would change my mind: a guide-down on FY26 revenue, gross margin compression below 55%, or explicit sponsor secondary announcement. Also monitor whether short covering continues (was 31.4% → 20.4%) — further decline would remove a supply overhang.
1-3 year thesis rests on Asia/DTC penetration, pricing power from a 250-year brand, and continued mid-teens revenue growth compounding into low-20s EPS growth. At ~13.5x forward EPS with mid-teens growth and 25%+ op margins, the PEG (~0.84) is reasonable if execution holds. Terminal risk is that Birkenstock is a fashion-adjacent consumer discretionary name — a genuine trend rollover or a recession-driven consumer downshift would compress both estimates and multiple simultaneously. Sponsor overhang (L Catterton/LVMH-linked pre-IPO holders) is the structural technical risk that could cap upside for years.
The business is fundamentally healthy: TTM revenue of €2.18B with Sales Y/Y TTM +20.35% and Q/Q +19.68%, gross margin ~54% (57.8% trailing on the fundamentals feed), operating margin ~24-27%, and ROE 12.5-12.9%. Q2 FY26 (Mar-26 quarter) delivered €618M revenue, 26.3% op margin and €81.9M net income — a clear step-up from the seasonally weak Dec-25 quarter. Cash generation is real but seasonal: TTM FCF €190M and OCF €415M, though the Dec-25 quarter posted negative FCF of -€66M (working capital build). Balance sheet is levered but manageable — €1.37B total debt vs €201M cash, D/E 0.47, current ratio 2.95, EV/EBITDA ~10.9. What's working: pricing power, top-line durability against tariff/FX headwinds, and margin resilience. What's less clean: leverage still elevated post-IPO, EPS Q/Q -11.56% shows sequential softness, and the last EPS surprise ran -16% — a warning flag heading into Aug 13.
Across timeframes the picture is clearly damaged. The 1h and 4h charts show a persistent lower-high, lower-low structure from mid-July's ~$46 down to a $37.6 print — a ~18% drawdown in roughly three weeks with a capitulation-style spike wick near $37 that has held so far. Daily context: price is -10.5% vs SMA20, -13.3% vs SMA50 and -6.9% vs SMA200 — all trends broken. RSI 32.99 is near oversold and the weekly chart shows the stock has round-tripped to the lower end of its multi-year range. The forecast bands project a bounce to $42.6-$44.1 (roughly the prior support-turned-resistance shelf), which is plausible as a mean-reversion target but the model's own realized directional accuracy (55% vs 87% naive at 1d) argues to discount the magnitude. Key levels: support $37.0/$36.0 then the $31 weekly low; resistance $39.0 (recent shelf), $40.5 (SMA20 area), then $42.5-$43.0 which is the pivotal zone that must be reclaimed to change trend.
Signal: JP Morgan raised its target to $58 (Overweight) on Aug 4, and consensus target is $53.51 with an average recommendation of 1.62 (buy-tilted) — institutional posture remains constructive despite the drawdown. The Aug 13 earnings print is the dominant near-term catalyst; consensus expects EPS $0.86-$0.87 (+22.9% Y/Y). Two US retail openings (Boulder, West Palm Beach) confirm the DTC expansion story is on schedule. Options traders are positioning for a big move (Zacks flag). Noise/counter-signal: Seaport downgraded to Neutral on July 20 citing softer Q2 sales, fewer store orders, and consumer pressure — this is the credible bear catalyst and matches the price action. Short interest at 20.24% (down from 31.4% in late June, so covering has been happening) still leaves meaningful crowding risk both ways.
- Q3 FY26 print Aug 13 — consensus $0.86 EPS (+22.9% Y/Y); management reaffirmed 13-15% FY revenue growth at Q2
- US owned-retail buildout continuing — 21st and 22nd US stores opened in Boulder and West Palm Beach (Jul 29)
- Asia expansion and DTC penetration cited as multi-year growth vectors in analyst work; supports mid-teens top-line runway
- Margin story: Q2 FY26 op margin 26.3% with gross margin ~54% held despite tariff/FX headwinds
- Short covering already underway (short float 31.4% → 20.4% over 45d) could add mechanical upside on a good print
- Aug 13 earnings is binary; last EPS surprise was -16%, elevating the miss-risk into a print where options are already pricing a big move
- Sponsor overhang from pre-IPO holders — a secondary offering could cap or reverse any rally regardless of fundamentals
- Short float still 20.24% — crowded both ways; a disappointing print could see accelerated downside via momentum
- Consumer cyclical exposure into a market in late markup/distribution phase; fashion trend cycle risk flagged by bear research
- Valuation not deeply discounted — DCF fair value ~$44-$45 leaves only ~15-20% upside to fair; not a margin-of-safety setup
- Prior base targets on this name overshot realized price by ~29% on average — models running optimistic; discount upside
- Debt/Eq 0.47 and negative FCF quarter (Dec-25 -€66M) mean seasonal cash burn amplifies any operational stumble
Get AI analysis on any stock
This is one of hundreds of Kronos AI reports — scored fundamentals & technicals, bull/base/bear price targets, a multi-horizon plan, and continuously-updated forecasts across the market. Create a free account to explore them all.
Create your free account →Already a member? Sign in · Join our Discord