BIRK — AI Stock Forecast & Price Targets
Published 9/9/2026 · A free sample of K3vl4r’s AI-powered analysis.
Kronos price forecasts, scored fundamentals & technicals, and a multi-horizon plan.
View the live BIRK price forecast →
BIRK is a high-quality premium franchise (~57% GM, ~29% OM, ~15% cc growth) trading at a compressed ~12x forward P/E and ~0.73 PEG versus a $49 DCF base case, but the tape is broken with price at $32.62 sitting only ~$1.50 above the 52-week low of $31.12. The Burry 5.2% stake and consistent analyst target support ($50-58) provide sentiment tailwinds, but L Catterton overhang, recent $1B offering dilution, and repeated failure of bull targets to print argue for patient accumulation into weakness rather than chasing.
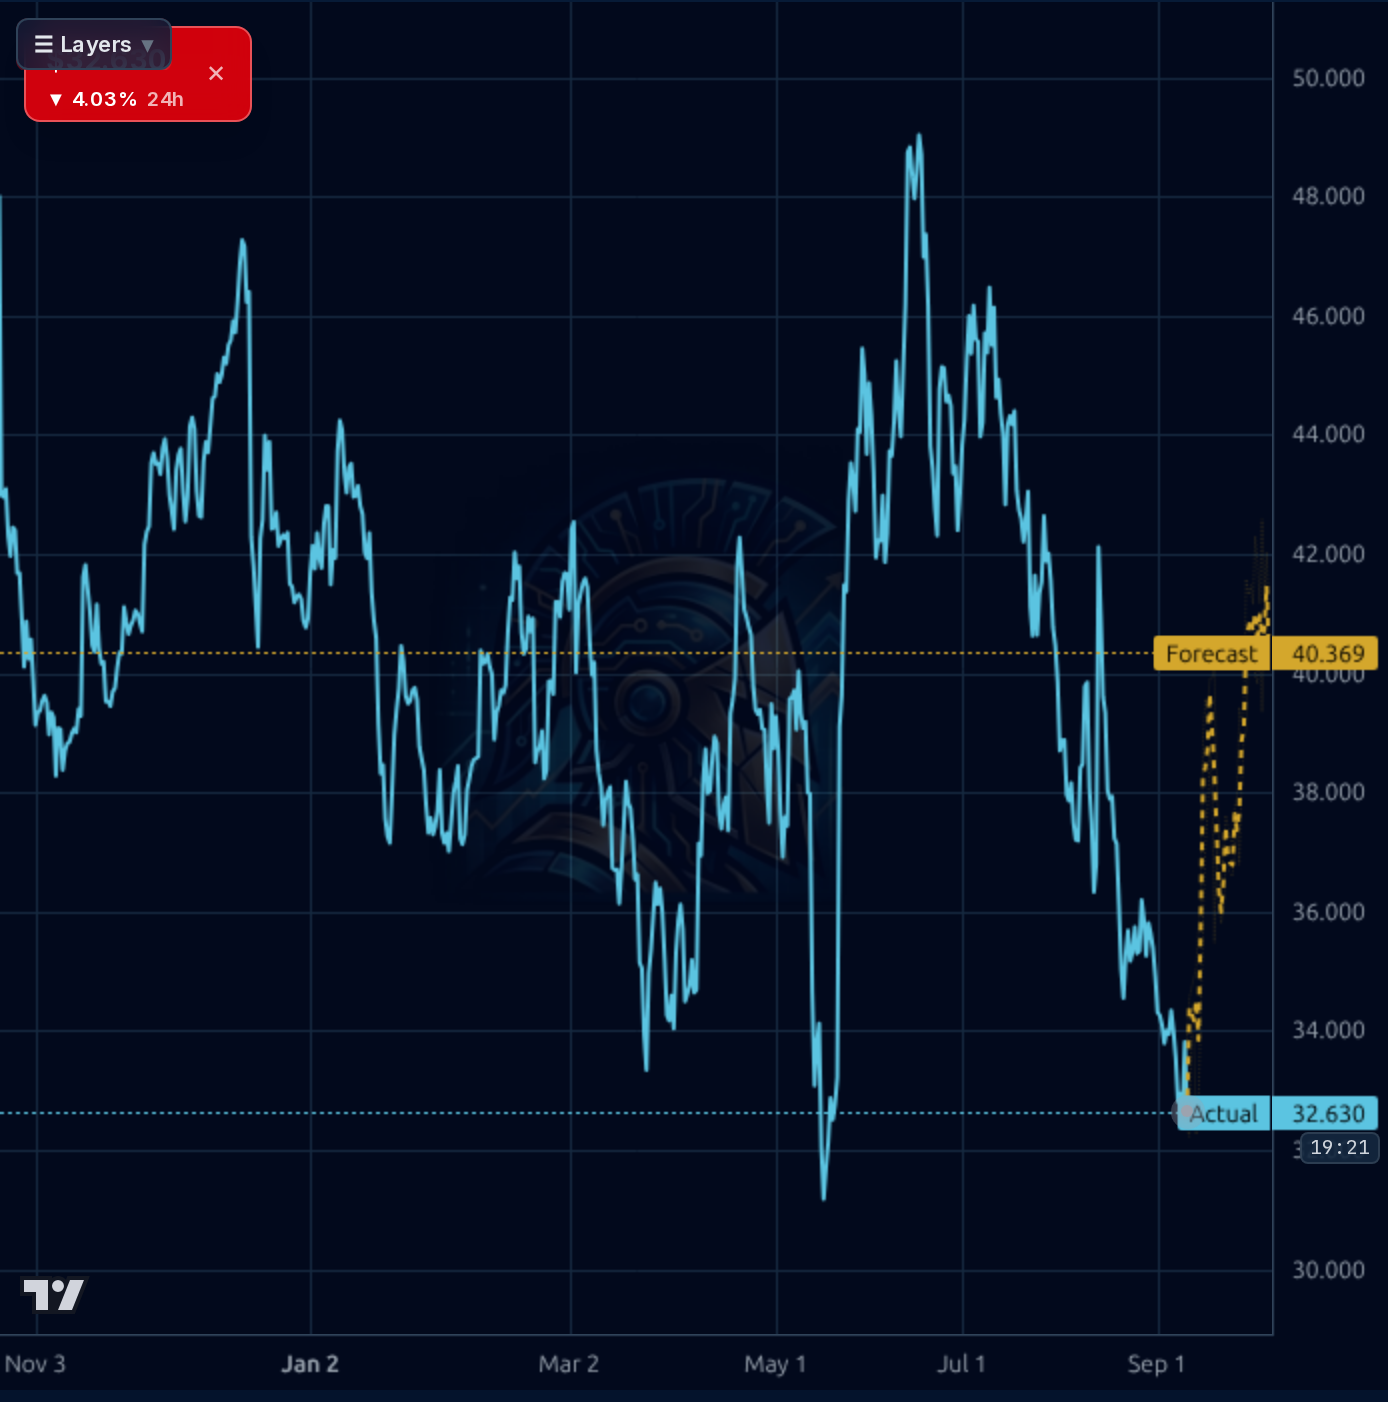
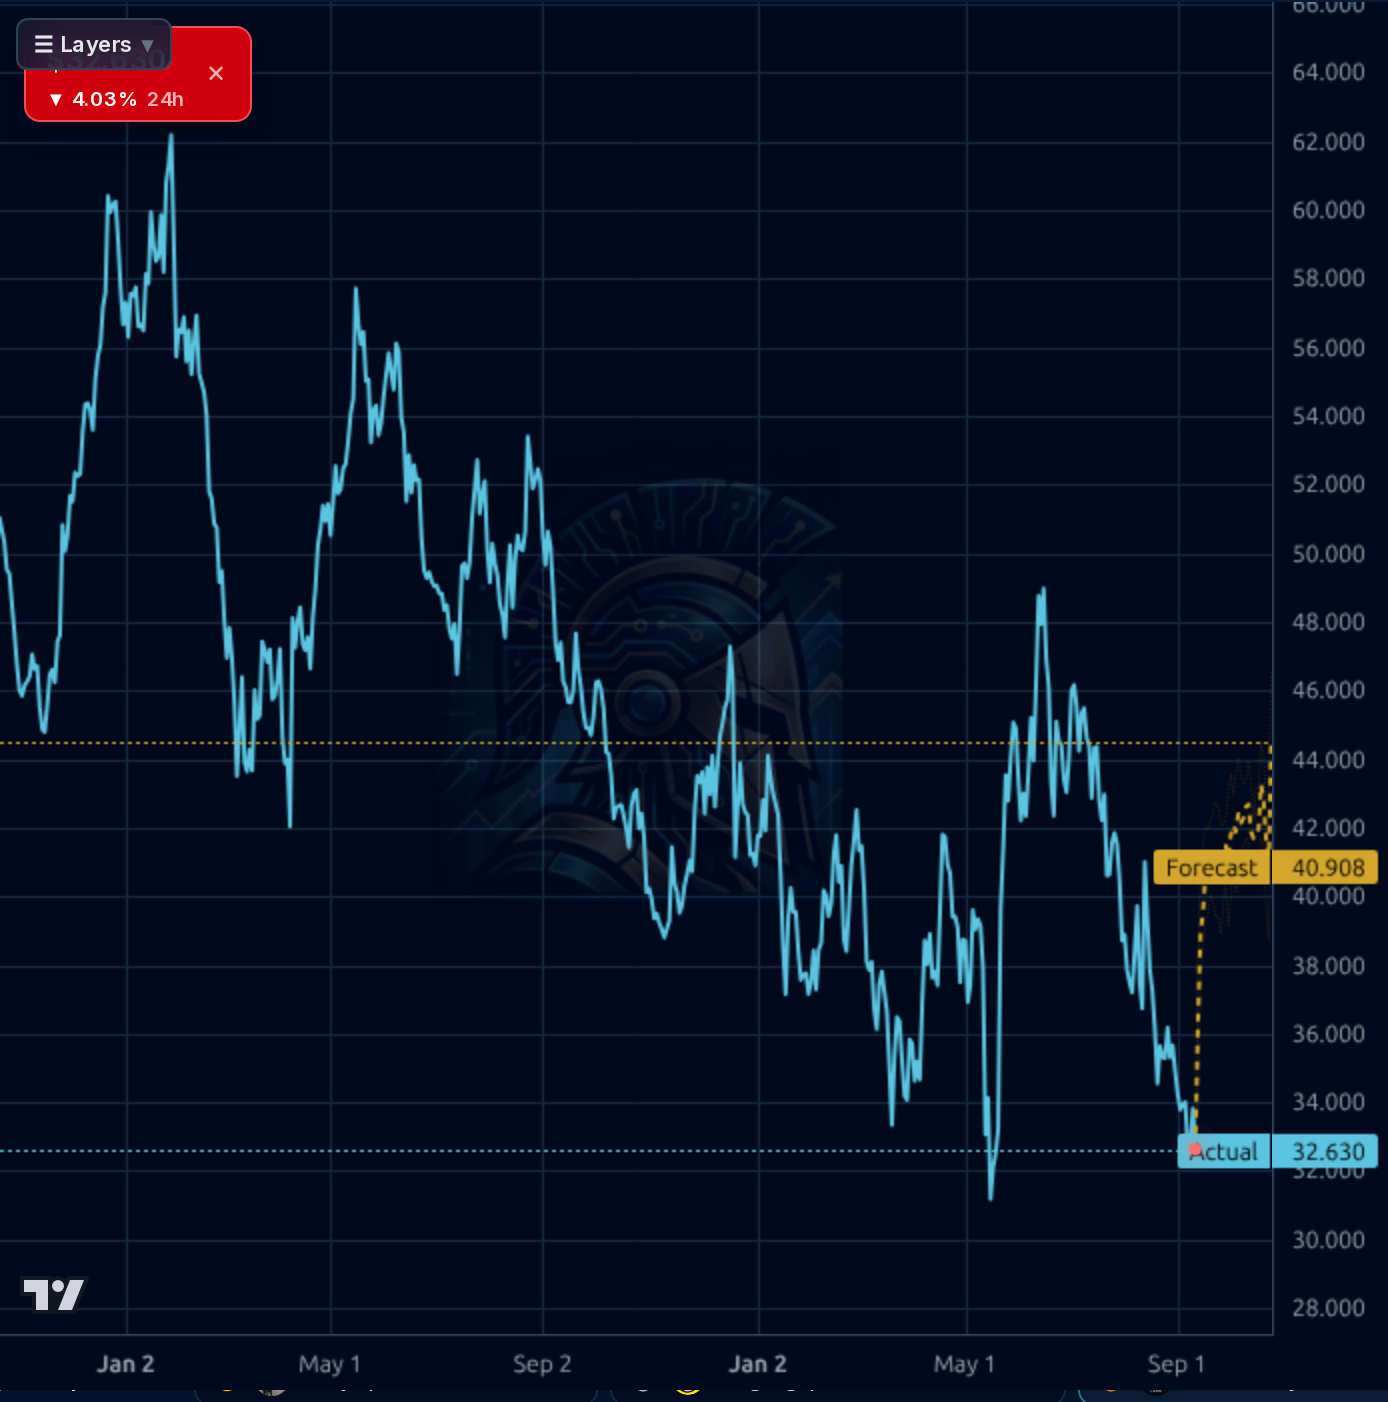
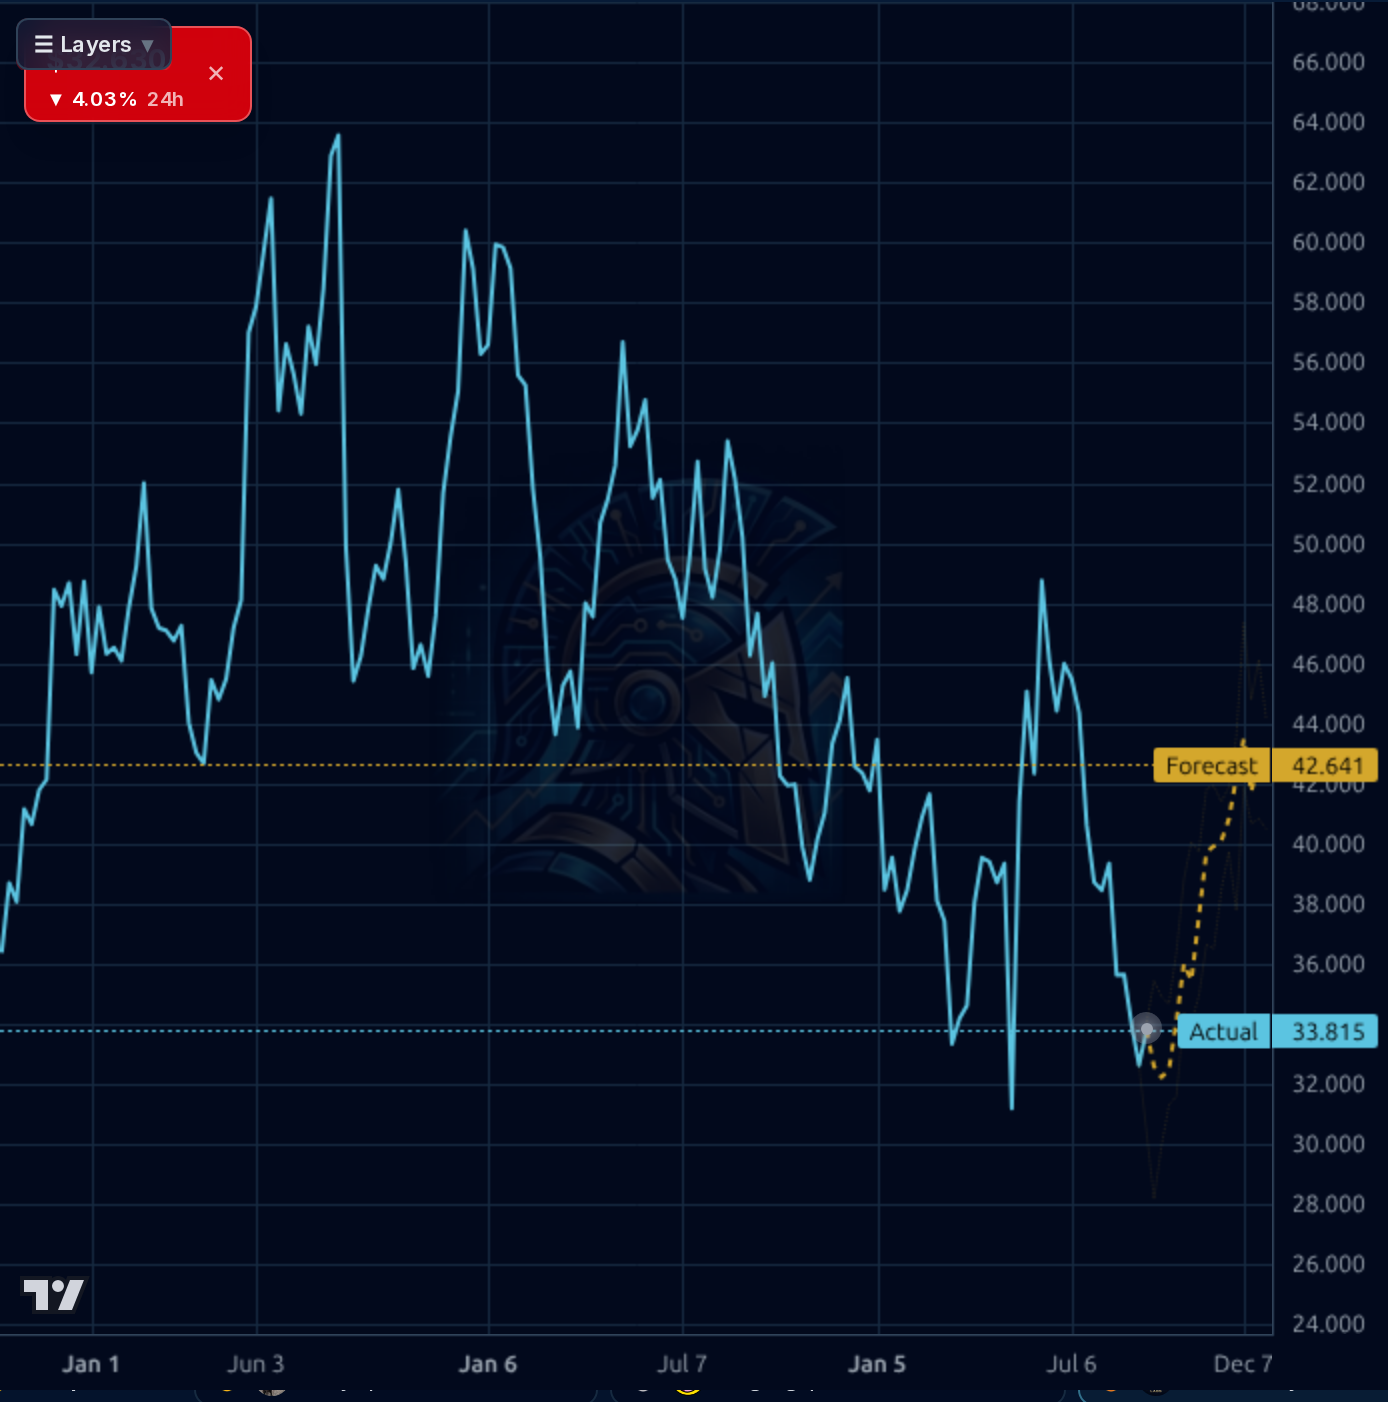
Over the next 1-4 weeks the risk/reward favors patient accumulation in the $31-$33 zone rather than chasing. The 52-week low at $31.12 is the critical line — a decisive close below invalidates the mean-reversion setup and opens $28-29. Starter position sizing (25-33% of intended weight) at current $32.62, add on a successful test of $31.12 with intraday reversal. First resistance $34, then $36 (50d area). Invalidation: two consecutive daily closes below $31.00 on above-average volume. The AI 1-day forecast (bullish) is unreliable (21% accuracy vs 86% baseline) — do not trade on it; the 1-week horizon is more actionable.
Over 1-6 months, base case is a grind back to $38-40 as Burry-driven sentiment stabilization, buyback absorption of secondary supply, and Q4 FY26 margin confirmation (targeting 59%+ GM) provide a floor. Expected return range: -10% (bear, breaks $31 on macro or sponsor sale) to +25% (base, $40) to +45% (bull, $47 on catalyst-driven re-rating). Catalysts: Q4 FY26 print, any L Catterton lockup/tranche news, additional 13F filings showing institutional follow-through post-Burry. Change of mind triggers: (1) Q4 margin miss confirming tariff/FX pressure is structural, (2) fresh L Catterton secondary announcement, (3) breakdown below $30 on volume.
Over 1-3 years the terminal thesis rests on Birkenstock scaling DTC mix (margin accretive), Asia/China expansion beyond current ~2% contribution, and continued category leadership in premium footbed footwear supporting mid-teens revenue CAGR and 27-30% operating margins. If executed, DCF fair value in the $50-63 range is defensible, implying 60-90% upside from current levels. The biggest structural risk is premium erosion / fashion cycle rollover — Birkenstock benefits from a specific ugly-luxe cultural moment, and category shifts could compress the multiple back toward mainstream footwear peers (8-10x EBITDA vs current ~9x). Sponsor overhang should fully clear within this window, removing the multiple cap.
The business remains high-quality: FQ3 (Jun-26) revenue of €719.5M grew ~37% YoY sequentially, with gross margin recovering to 59.1% and operating margin to 28.7%, confirming operating leverage is intact. TTM revenue of €2.27B with 14.8% net margin, 29% OM, and 57.5% GM are best-in-class for footwear. FQ3 FCF of €220M swung meaningfully positive after weak seasonal Q1/Q2, and TTM FCF of €155M supports capital returns. Balance sheet shows €694M cash against €1.93B debt (Net debt/EBITDA ~1.9x), manageable but not trivial given the ~100bps FY26 margin hit flagged from tariffs/FX per the €900M notes disclosure. ROE 12.4%, ROIC 7.3% are respectable but not stellar given the goodwill/intangible-heavy balance sheet (€3.1B combined vs €2.8B equity). EPS Q/Q of -10.6% and a historical pattern of soft EPS surprises (-2.2% last print) keep the market skeptical despite the top-line strength. At 15.3x TTM / 11.6x fwd P/E with PEG 0.73, the valuation is clearly compressed relative to the underlying franchise quality.
The tape is decisively broken across all timeframes. Daily chart shows a clean 12-month downtrend from the $48-49 July peak to $32.63, with price sitting -18.7% below the 200-day SMA, -17.8% below the 50-day, and -9.0% below the 20-day. RSI at 32.4 is nearing oversold but not yet washed out. Price is only $1.50 above the 52-week low of $31.12, and the -4.06% daily / -6.56% weekly / -15.16% monthly performance shows accelerating distribution rather than stabilization. On the 1H chart the intraday attempt to hold $33 failed. The AI forecast band projects a rebound toward $40-42 (base $40.4 1H, $40.9 4H, $42.6 1W), but the model's own realized 1-day directional accuracy is 21% versus an 86% naive baseline — the near-term forecast is unreliable and should be heavily discounted. The 1-week horizon (83% accuracy, 5% MAPE) is more trustworthy and consistent with a mean-reversion setup if $31 holds. Key levels: $31.12 (52w low, must hold), $34 (broken support turned resistance), $36 (50-day area), $40 (declining trend / forecast target).
The dominant signal is the Michael Burry 5.2% stake disclosure (Sep 8), which triggered coverage across multiple outlets and lends institutional validation at the lows. Analyst posture remains constructive: JPMorgan $58 PT (Overweight), Telsey $50, Goldman/Stifel/William Blair Buy-equivalent, with average target $53.76 implying ~65% upside — though Williams Trading's cut to Hold ($44) shows the debate is real. The mid-August $1B equity offering added supply and helps explain the ongoing pressure despite fundamentals. On the corporate front, L Catterton (54.4% insider stake) sold a stake to fund a Hyrox deal — a mixed read, as it signals further sponsor rotation but at least deploys capital elsewhere. ChartMill and value screens flag BIRK as an affordable growth name (PEG 0.73, strong margins). Short float has been compressing meaningfully (20.2% → 8.5% over 45d), removing one source of forced buying but also easing pressure on the downside.
- FQ3 FY26 revenue +37% sequential to €719M with GM recovering to 59.1% — confirms operating leverage intact after weak seasonal Q1/Q2
- Full-year FY26 guidance reaffirmed at 13-15% constant-FX growth despite tariffs, FX, and macro headwinds
- DTC mix shift continues to drive gross margin expansion, per late-August print commentary
- Asia/China contribution remains ~2% of revenue — meaningful multi-year runway if brand can scale in the region
- $500M buyback program helps absorb L Catterton secondary supply and provides EPS accretion
- Michael Burry 5.2% disclosure (Sep 8) provides institutional validation and potential base of follow-on accumulation
- L Catterton sponsor overhang (54.4% insider ownership) — additional secondary tranches remain the primary cap on upside
- Mid-August ~$1B equity offering added supply and is still being digested — partially explains ongoing weakness
- €1.93B total debt (Net debt/EBITDA ~1.9x) with recent €900M note issuance flagging ~100bps FY26 margin compression from tariffs/FX
- Historical pattern of EPS misses even when revenue beats (last surprise -2.2%) makes near-term catalysts unreliable
- Tape is broken: -33% YoY, -25% quarter, price only $1.50 above 52-week low — technical breakdown to $28-29 possible if $31 fails
- Premium discretionary exposure vulnerable in late-cycle macro with breadth deteriorating (51.7% >200dMA)
- AI 1-day forecast is unreliable in current regime (21% directional accuracy vs 86% naive baseline)
- Prior bull targets ($45-60) have consistently failed to print — anchoring on them has produced losing calls
Get AI analysis on any stock
This is one of hundreds of Kronos AI reports — scored fundamentals & technicals, bull/base/bear price targets, a multi-horizon plan, and continuously-updated forecasts across the market. Create a free account to explore them all.
Create your free account →Already a member? Sign in · Join our Discord