BKV — AI Stock Forecast & Price Targets
Published 8/5/2026 · A free sample of K3vl4r’s AI-powered analysis.
Kronos price forecasts, scored fundamentals & technicals, and a multi-horizon plan.
View the live BKV price forecast →
BKV trades at $23.35, ~29% off 52-week highs and just above the $22.90 support line, one day ahead of a binary Aug 6 Q2 print that will define the funding path against a $522M TTM FCF hole and a $780M single-quarter debt build to $1.27B. Operational scaling is real (Q1 revenue +64% Y/Y, two CCS facilities live, EPS Q/Q +146%), but the 20% short float and trimmed sell-side targets ($37→$34/$35) show the market is pricing dilution risk that only management commentary can resolve. Stay HOLD into the print — no pre-earnings size, wait for funding clarity.
HOLD / no new size into the Aug 6 print. This is a binary event with IV crush risk and the stock has a documented pattern of selling into prints. If already long, consider trimming 25-33% into today's close to reduce gap risk. Invalidation for any tactical long: close below $22.90 post-print (opens $20 bear case). Only bullish trigger worth acting on: explicit funding plan (project finance or JV monetization, NOT equity raise) plus reiterated FY guide — that would open a snap-back to $25.50 and possibly $26.50. If they announce a secondary or cut guidance, expect a $20-21 handle within days.
1-6 month view is HOLD, waiting for two proof points: (1) capital structure resolution without material dilution, and (2) first disclosed 45Q credit revenue from Eagle Ford and Cotton Cove in 2H26 reporting. Base case is chop in the $23-27 range with $25.50 as the fair-value magnet consistent with prior realized moves. Expected return range: -15% to +15% over 6 months, skewed by which funding path is chosen. What changes my mind bullishly: project-financed CCS build-out that keeps debt/equity below 0.6 and preserves the CCS optionality. Bearishly: a >10% equity raise, gross margin dropping below 55%, or Barnett production missing the 925-975 MMcfe/d guide.
1-3 year terminal thesis rests on BKV becoming the first at-scale integrated gas-to-CCS platform: 1.5M tCO2/yr injection capacity by 2028, 75%-owned power JV closing the loop, and 45Q credits providing a differentiated cash margin over pure-play E&Ps. If executed, forward P/E should compress toward mid-teens on a normalized ~$2.00 EPS base plus 45Q revenue optionality, supporting a $32-38 range. Biggest structural risk is 45Q regulatory continuity — the credit is politically vulnerable and any rollback (or voluntary carbon market collapse) would collapse the CCS NPV and leave BKV as an over-levered small-cap Barnett/Marcellus operator worth mid-teens. Secondary structural risk is that the parent Banpu (70.75% owner) uses BKV as a capital source rather than steward, creating persistent overhang.
The quarterly progression shows a business scaling top-line aggressively but at deteriorating quality: revenue climbed from $204M (Q2'25) to $377M (Q1'26), a +84% ramp, yet gross margin collapsed from 81% to 58% and operating margin thinned to 8.7%. Net income of $44M in Q1'26 is well below the $105M peak in Q2'25, meaning EPS growth is being manufactured by scale, not unit economics. The balance sheet is the real story: total assets jumped from $2.30B to $4.17B in three quarters, funded by a debt build from $200M to $1.27B — a 6x increase — while cash of $289M is dwarfed by the $522M TTM FCF deficit and $140M Q1 capex burn. Debt/equity at 0.57 and current ratio 1.31 look manageable in isolation, but the trajectory (operating cash flow of $72M vs capex of $140M in Q1) means external funding within 12 months is not optional. Trailing P/E of 7.1x flatters the picture — forward P/E of 11.9x and PEG 0.71 are the honest read. Insider ownership at 70.75% (Banpu parent) both anchors the equity and creates overhang risk if a secondary is used to plug the funding gap.
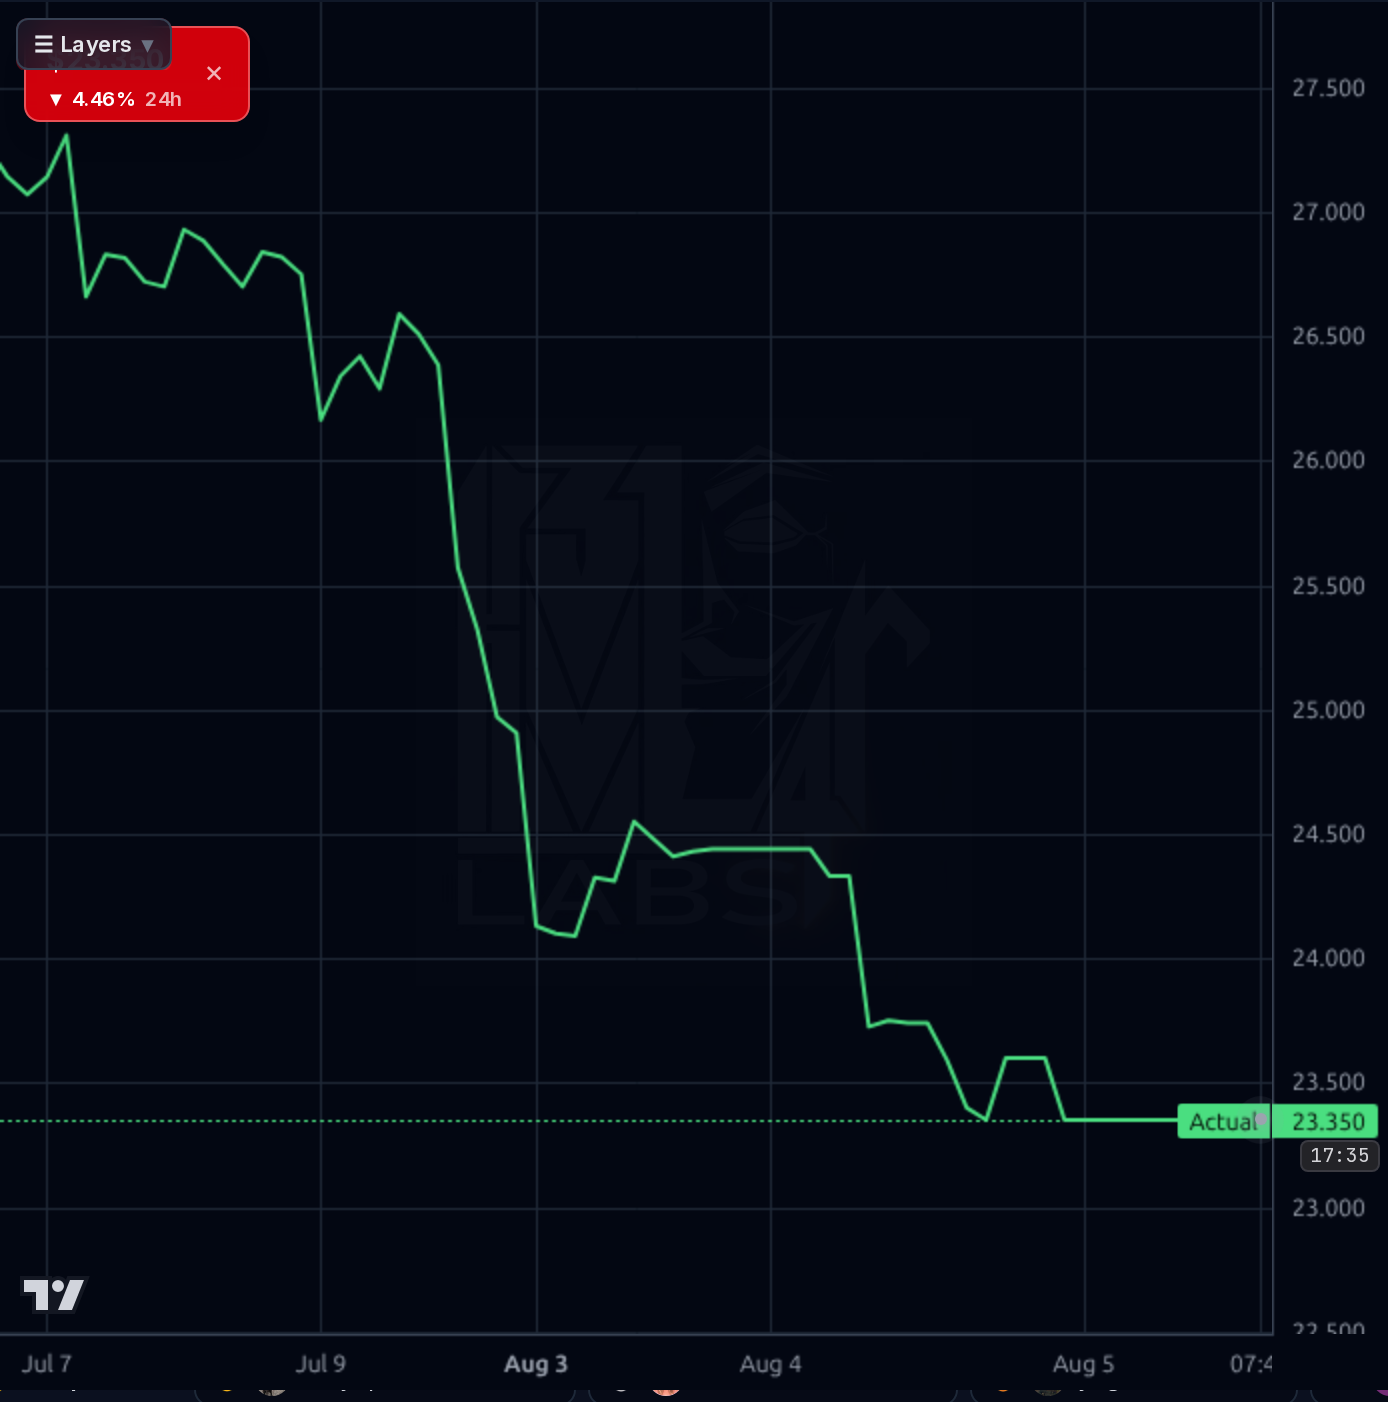
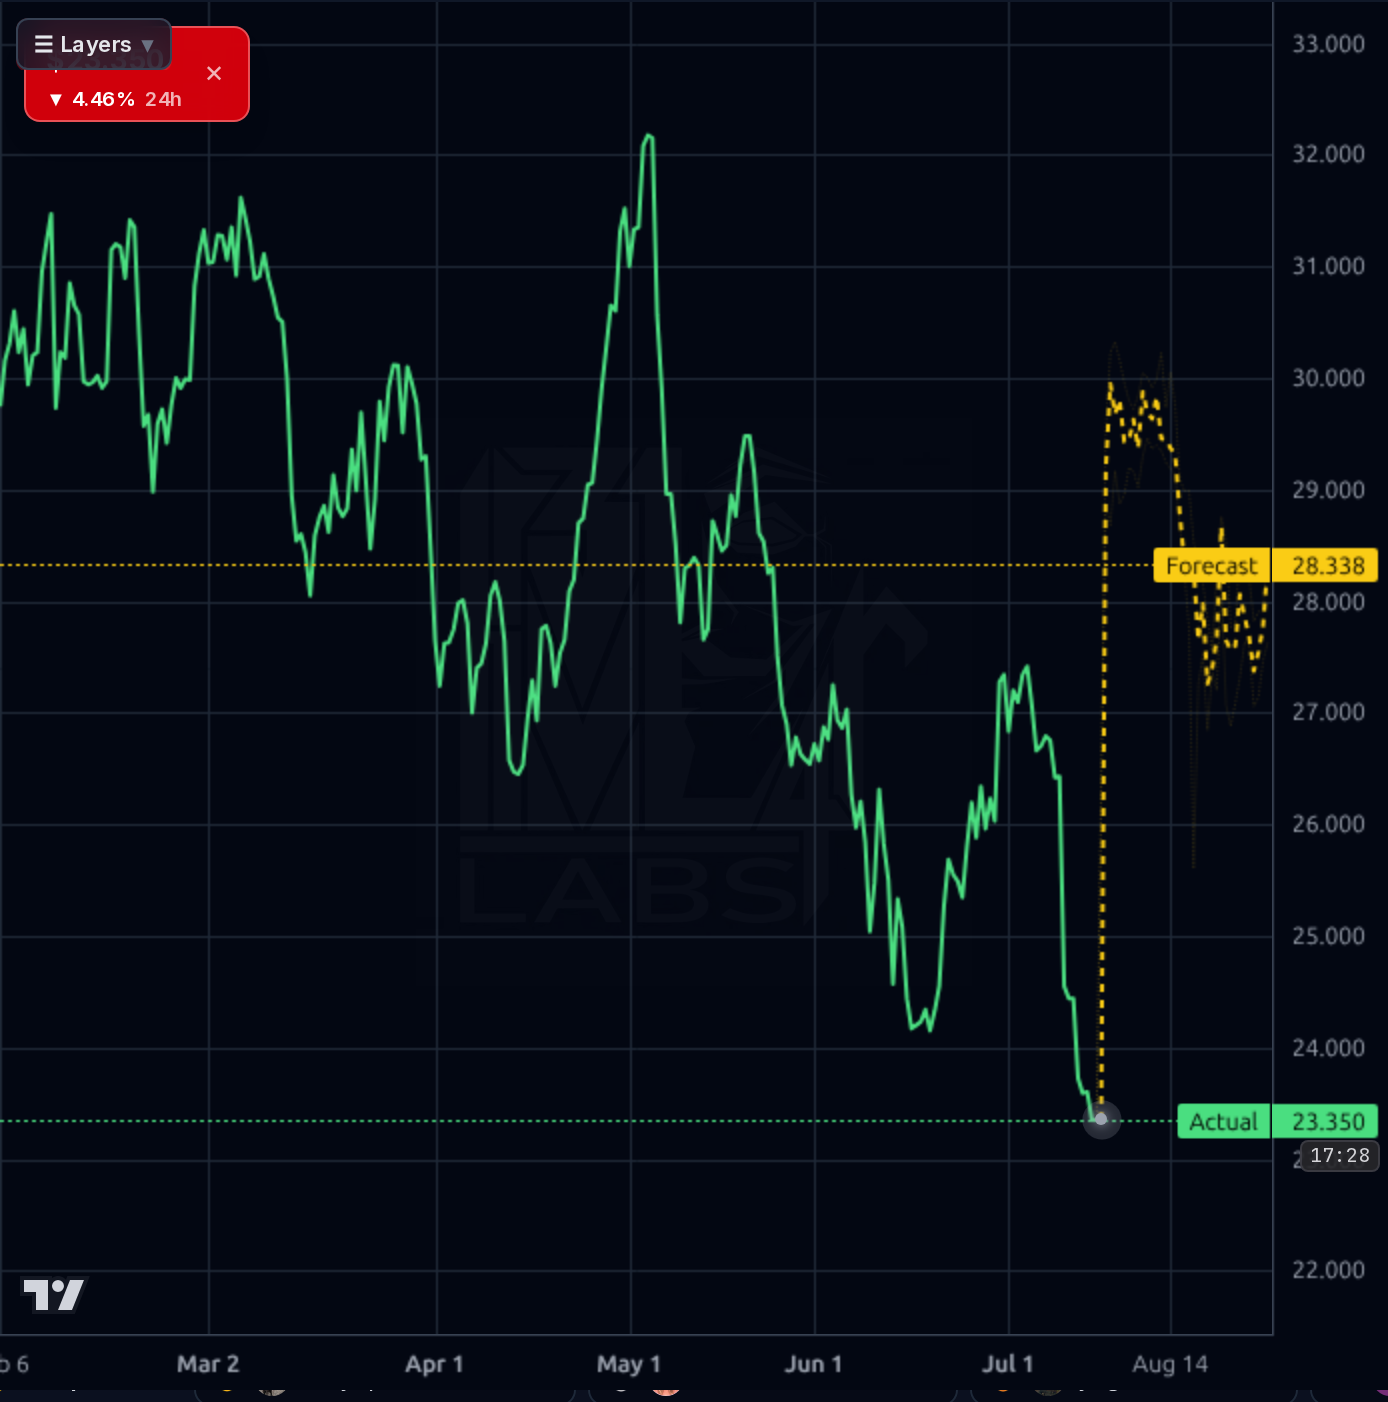
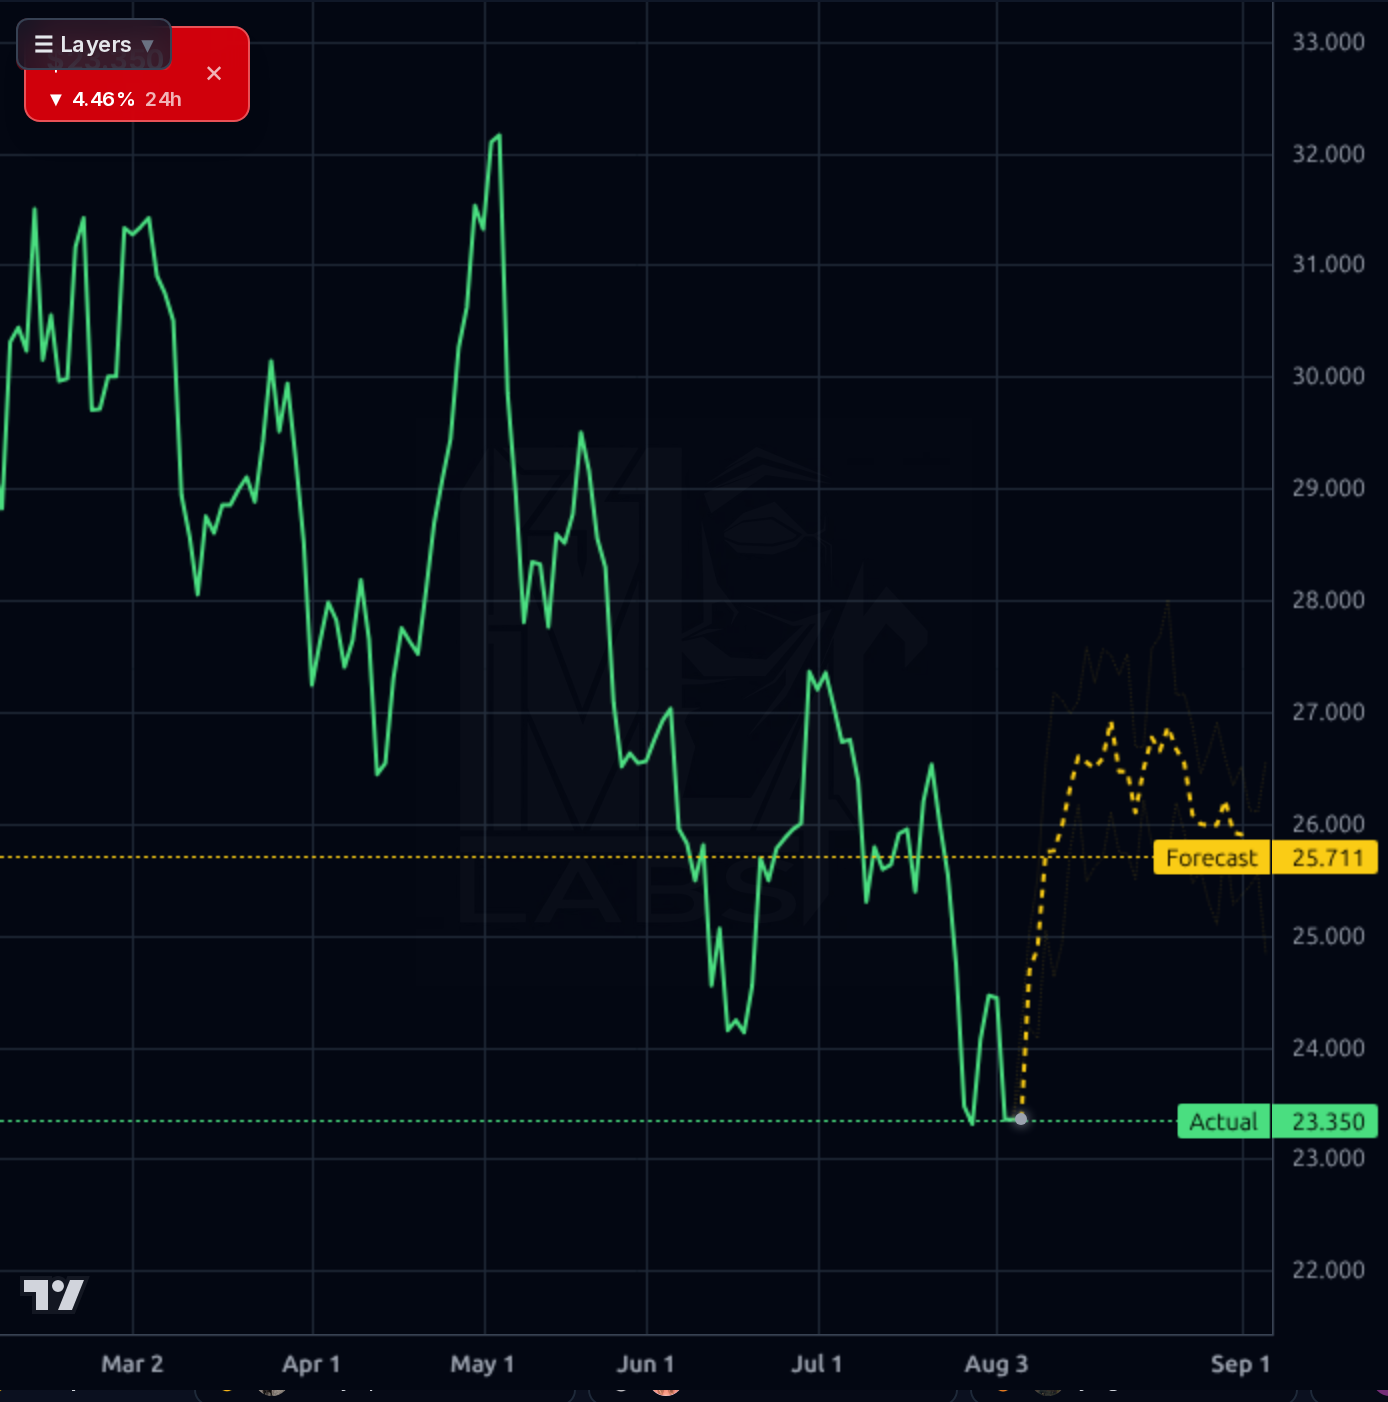
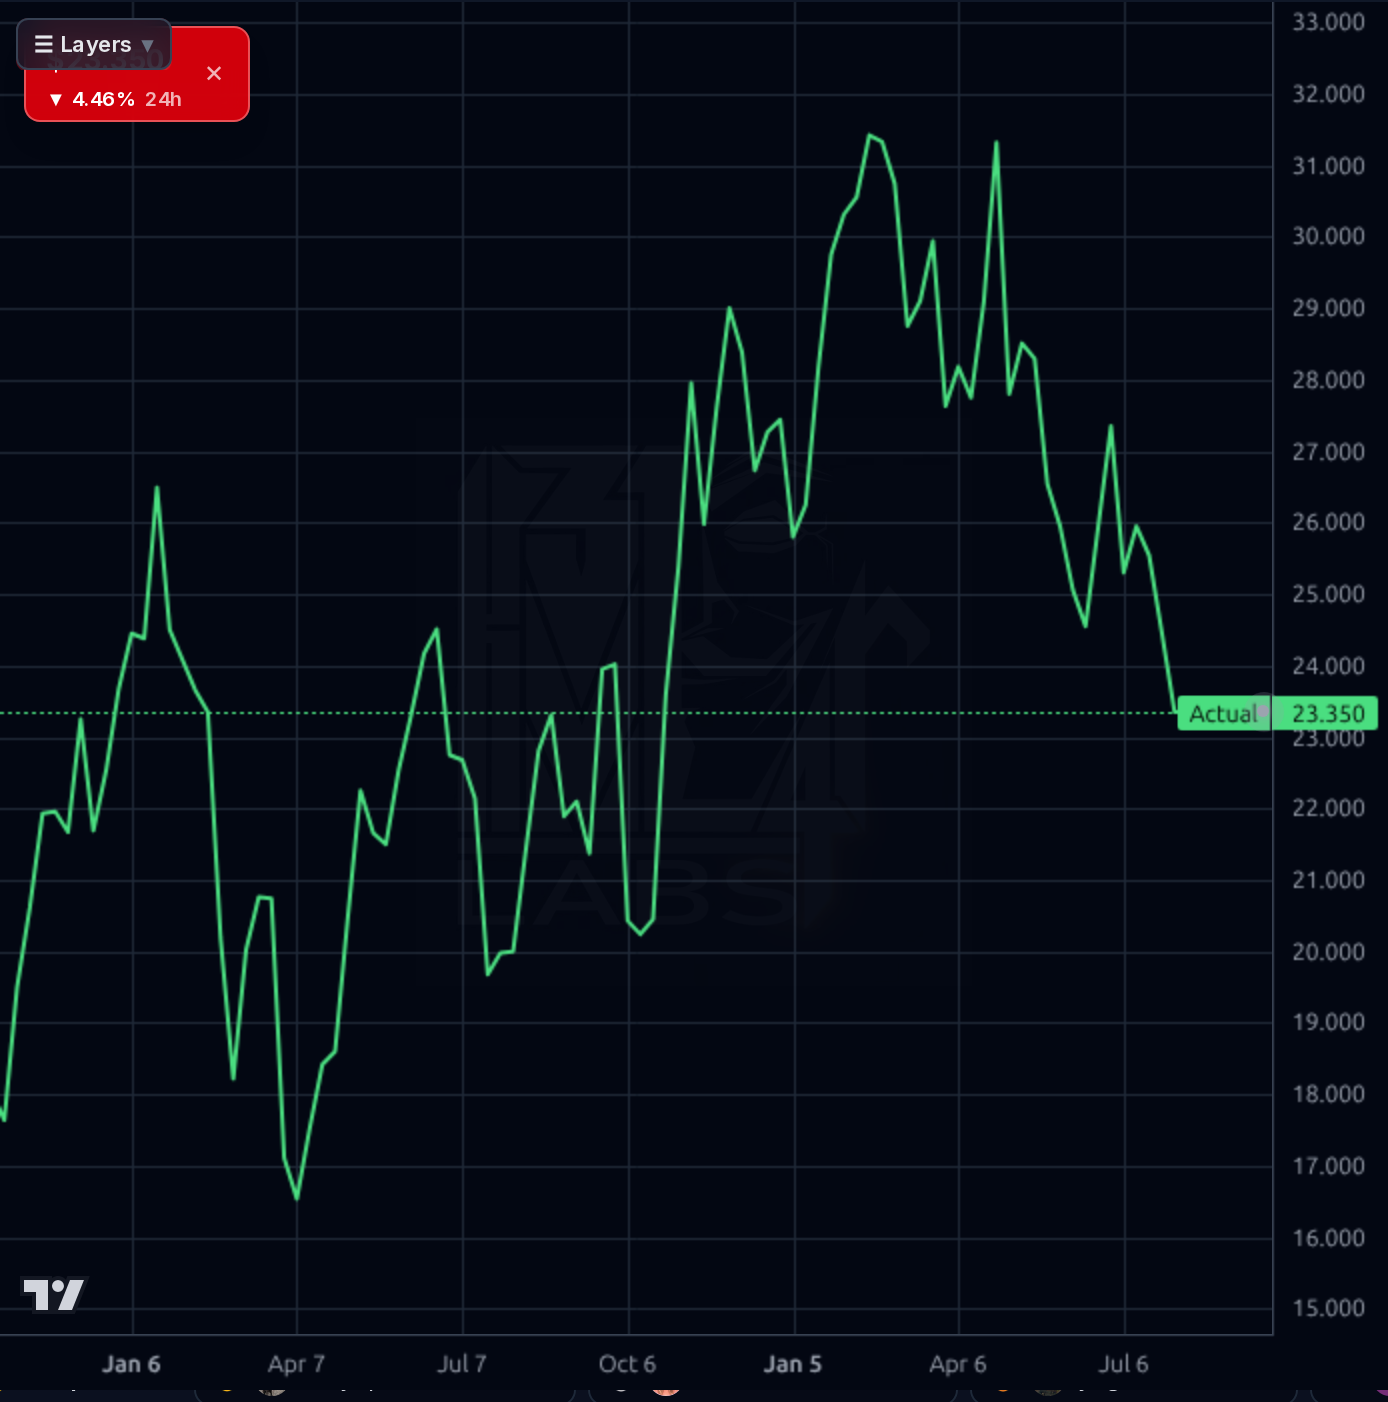
All four timeframes tell the same story: BKV is in a defined downtrend with the 1h chart showing a clean staircase from $27.00 (Jul 7) to $23.35 today — a ~13% slide in under a month, punctuated by a decisive break through $25.00 on Aug 3. The 4h and 1d charts confirm the stock has broken the $24.00-$25.00 shelf that held from late June, and price now sits below SMA20 (-7.5%), SMA50 (-9.3%), and SMA200 (-14.2%) — a full trend structure failure. Weekly chart shows the stock has round-tripped the entire 2025 rally back to the $23-24 zone that acted as pivot from Jan-Jun 2025. RSI 35.4 is oversold-adjacent but not extreme, and prior bounces from RSI 30s on this name have faded without a fundamental catalyst. The forecast band on the 4h and 1d charts projects a mean-reversion snap toward $25.7-$28.3, but the model's realized directional accuracy (44% vs 75% naive baseline at 1d) means those bands should be heavily discounted — the naive 'assume trend continues' beat the model. Key levels: $22.90 (recent low) is the make-or-break support; a break opens $20 (bear case). Upside resistance is $24.50 then $25.50 (broken shelf).
Signal: Q2 earnings tomorrow (Aug 6 BMO) is the only news item that matters — everything else is stale wrapper. Sell-side is constructive but trimming: Truist $37→$34 (Buy), Susquehanna $37→$35 (Positive), consensus target $33.75 (Recom 1.23). Simply Wall St calls it ~28% undervalued at $25.54, which is now itself stale as the stock has since fallen another ~9%. An institutional holder (SG Americas) cut its position 89.3% in Q1 filings — small in absolute terms but directionally consistent with the crowding-out. Noise: retail social sentiment is 100% bullish across 4 tagged messages, mostly promotional/pump content, and should be treated as a mild contrarian tell rather than corroboration. Broader market context (SPY late markup, cyclical leadership, breadth improving) provides no specific tailwind for a levered E&P with a funding cliff.
- Binary Aug 6 earnings print — historical pattern is to sell into prints, and funding path disclosure is genuinely uncertain
- $522M TTM FCF deficit vs $289M cash forces external funding within 12 months; 20% short float already pricing dilution
- Debt built from $200M to $1.27B in three quarters — trajectory more concerning than absolute level
- Gross margin reset from 81% (Q2'25) to 58% (Q1'26) may be structural; further compression breaks the earnings power thesis
- 45Q credit regulatory continuity is politically vulnerable; any rollback would collapse CCS NPV
- Parent Banpu at 70.75% insider ownership creates persistent secondary-offering overhang
- Sell-side targets being trimmed (Truist $37→$34, Susquehanna $37→$35) even with maintained ratings signals estimate pressure
- Technical trend fully broken: below SMA20/50/200; $22.90 is the last defense before $20 bear case
- Forecast model directional accuracy (44%) is below naive baseline (75%) — do not lean on the yellow mean-reversion band
Get AI analysis on any stock
This is one of hundreds of Kronos AI reports — scored fundamentals & technicals, bull/base/bear price targets, a multi-horizon plan, and continuously-updated forecasts across the market. Create a free account to explore them all.
Create your free account →Already a member? Sign in · Join our Discord