BKV — AI Stock Forecast & Price Targets
Published 8/6/2026 · A free sample of K3vl4r’s AI-powered analysis.
Kronos price forecasts, scored fundamentals & technicals, and a multi-horizon plan.
View the live BKV price forecast →
BKV enters its Aug 6 Q2 print at $23.00, sitting just above the $22.90 support and ~30% off 52-week highs, with a genuinely bifurcated setup: strong operational scaling (Q1 revenue +64% Y/Y, two CCS facilities live, EPS Q/Q +146%) fighting a $522M TTM FCF hole, a $780M single-quarter debt build to $1.27B, and 20% short float pricing in dilution risk. Social chatter suggests Q2 GAAP EPS of $0.68 (revenue $465M, +44% Y/Y) — a beat vs $0.32 consensus if verified — but the print is binary and the model's 1d directional accuracy (41%) trails the naive baseline (77%), so I'd sit on hands into the tape and let the funding disclosure define the trade.
Do NOT size a swing into the Aug 6 print — it's binary, IV crush is coming, and the model's 1d forecast is unreliable in this regime (41% vs 77% naive). If pre-market gaps green on a clean beat AND management discloses non-dilutive funding (parent capital, project finance, ATM shelf capped), a starter position ~$24–25 targeting a $27–28 short-cover unwind is defensible; invalidation is a close below $22.90. If the print shows dilutive equity, guide cut, or capex creep, expect a gap to $20–21 and DO NOT try to catch it. Best posture into the tape: cash, wait for the funding disclosure to define direction.
1–6 month base case is a range trade $23–$27 as the market digests the funding plan and CCS commercial ramp. Upside path ($28–30) requires: (1) 45Q credit revenue starting to print in 2H26, (2) gross margin stabilizing at/above 55%, (3) Q3 capex re-baseline showing debt build slowing. Downside path ($19–20) is triggered by dilutive equity raise, further margin compression below 50%, or Barnett realized-price weakness on <$3 Henry Hub. Expected return range: –15% to +20%. What changes my mind bullish: explicit non-dilutive funding announcement and 45Q revenue disclosure. Bearish: any equity issuance at these prices.
1–3 year thesis hinges on whether BKV can scale to 1.5M tCO2/yr CCS injection by 2028 while running the Barnett as a cash engine. Terminal value depends almost entirely on 45Q tax credit continuity and the ability to monetize Sequestration-as-a-Service at scale — both are execution-heavy and politically exposed. Biggest structural risk is that the current capital intensity is not a one-time build but a permanent feature, in which case equity dilution becomes cyclical and multiple compresses further. Reasonable multi-year fair value $28–35 if execution holds; single digits possible in a bear commodity + 45Q rollback scenario.
The top line is genuinely strong — Q1 2026 revenue of $376.5M (Sales Y/Y TTM +52%, Q/Q +64%) with TTM revenue at $999M and net income of $293.7M produces a headline P/E of 6.96 and forward P/E of 11.7, which screens cheap. But the quality of that earnings stream is eroding: gross margin compressed from ~81% in mid-2025 quarters to 58% in Q1 2026, and operating margin fell to 8.7% from prior double-digits. The bigger problem is the balance sheet — total debt exploded from $200M (Q2 '25) to $487M (Q3-Q4 '25) to $1.27B in Q1 2026, a $780M single-quarter build, while cash sits at $289M and TTM free cash flow is –$522M against Q1 capex of $140M. Debt/Equity 0.57 is manageable in isolation but the trajectory is alarming and forces external funding within 12 months. ROE 15.9%/ROIC 8.9% are respectable; PEG 0.70 is attractive if growth persists. Insider ownership 70.75% is high (Banpu parent) which caps float and can enable a non-dilutive parent capital solution — that optionality is the fundamental swing factor tonight.
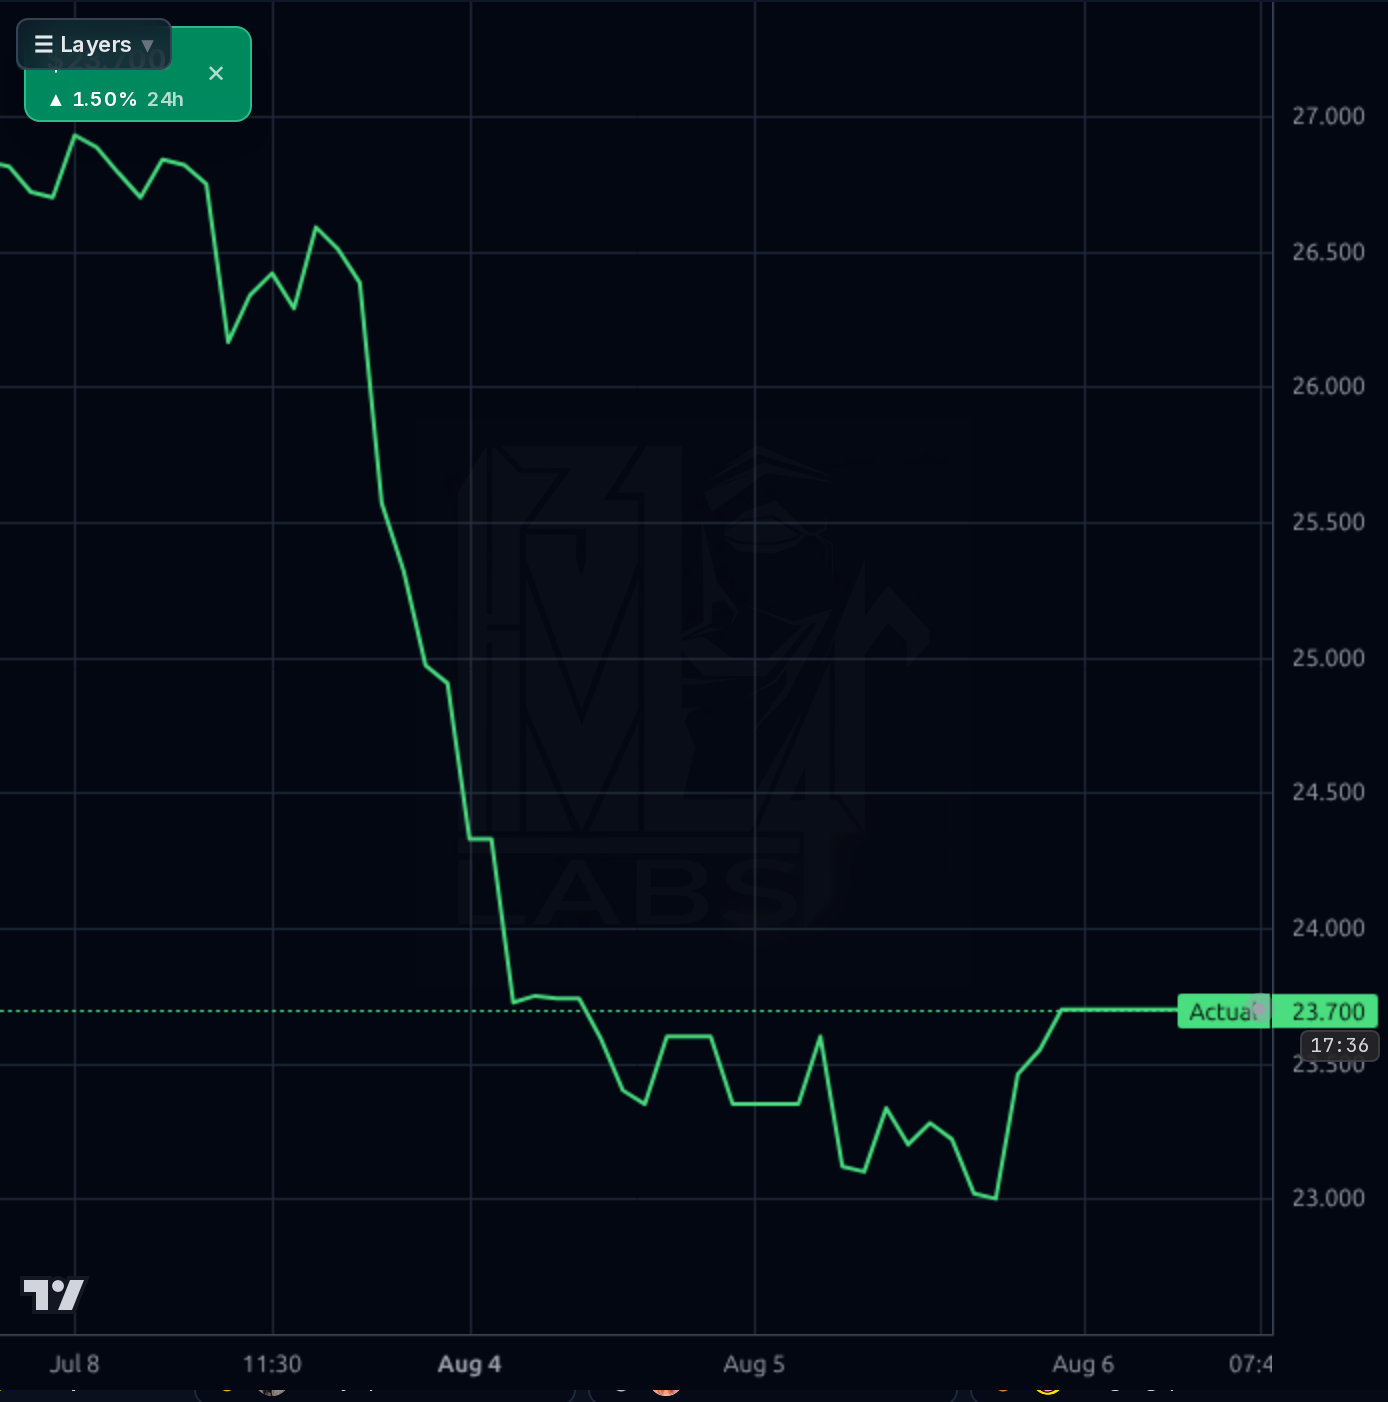
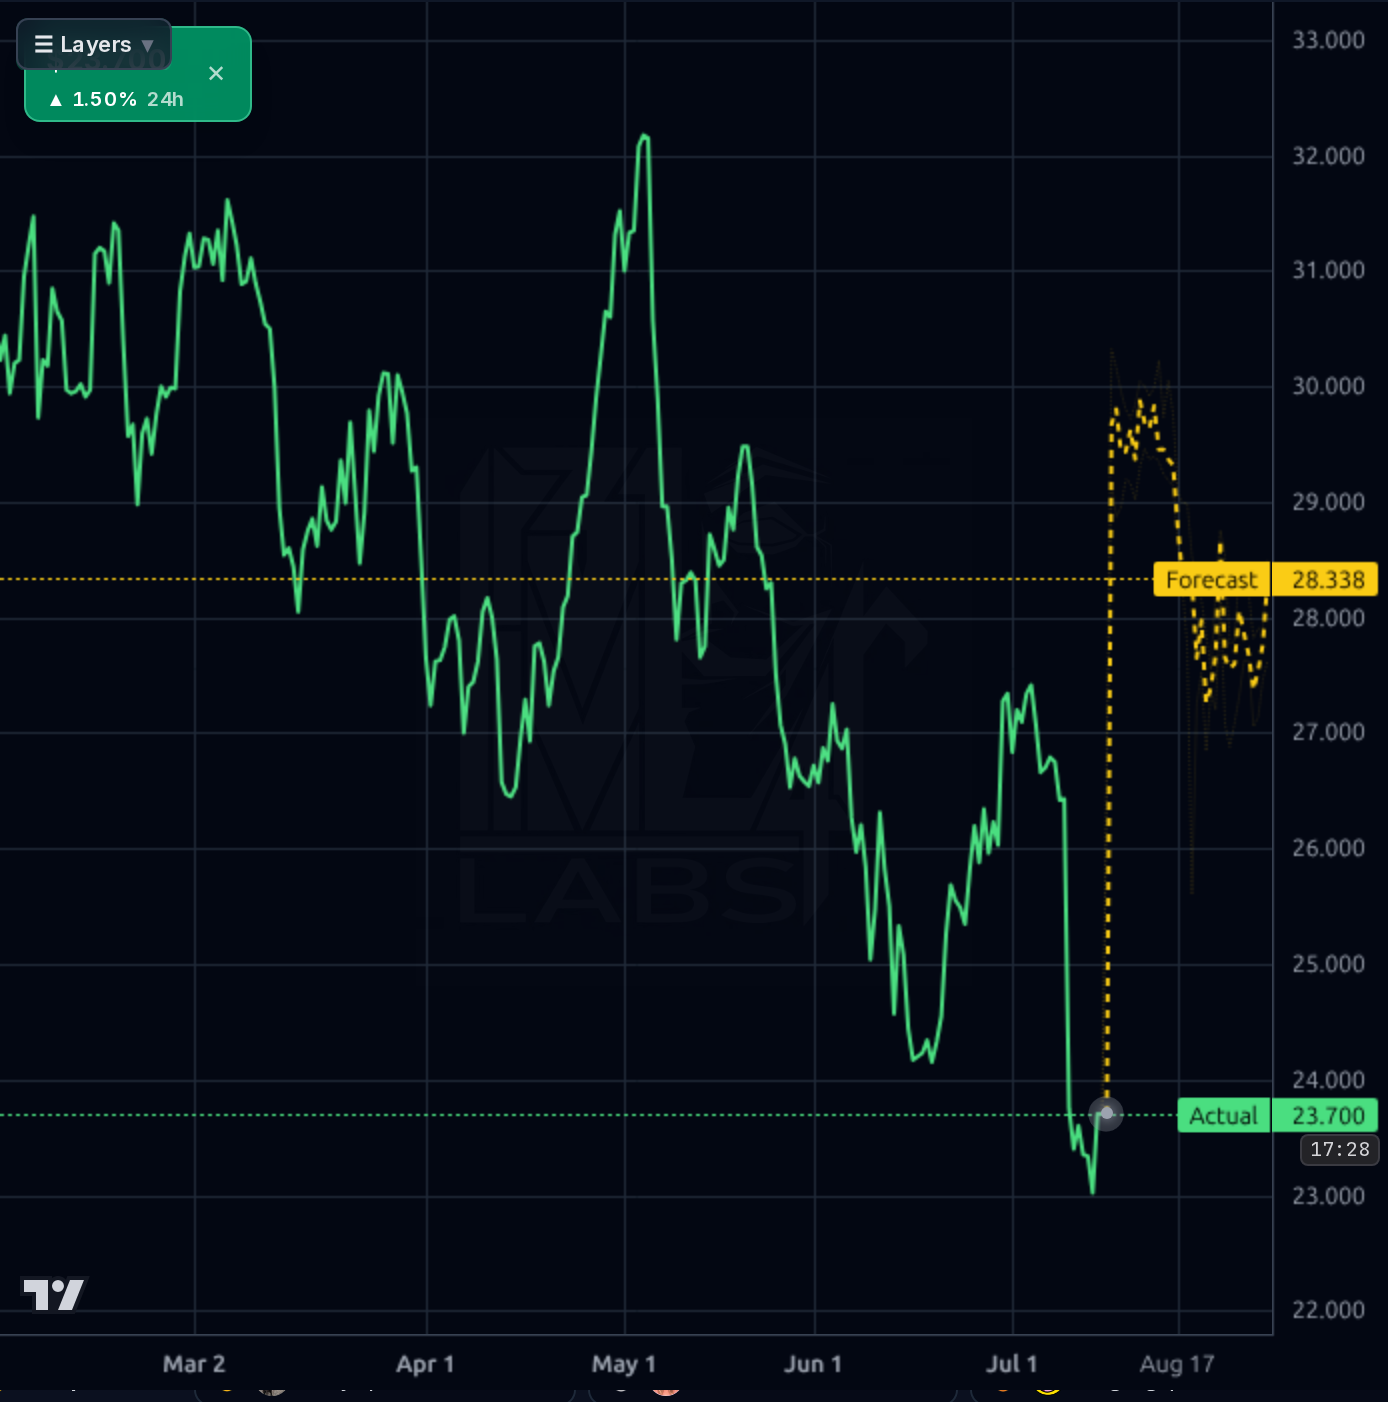
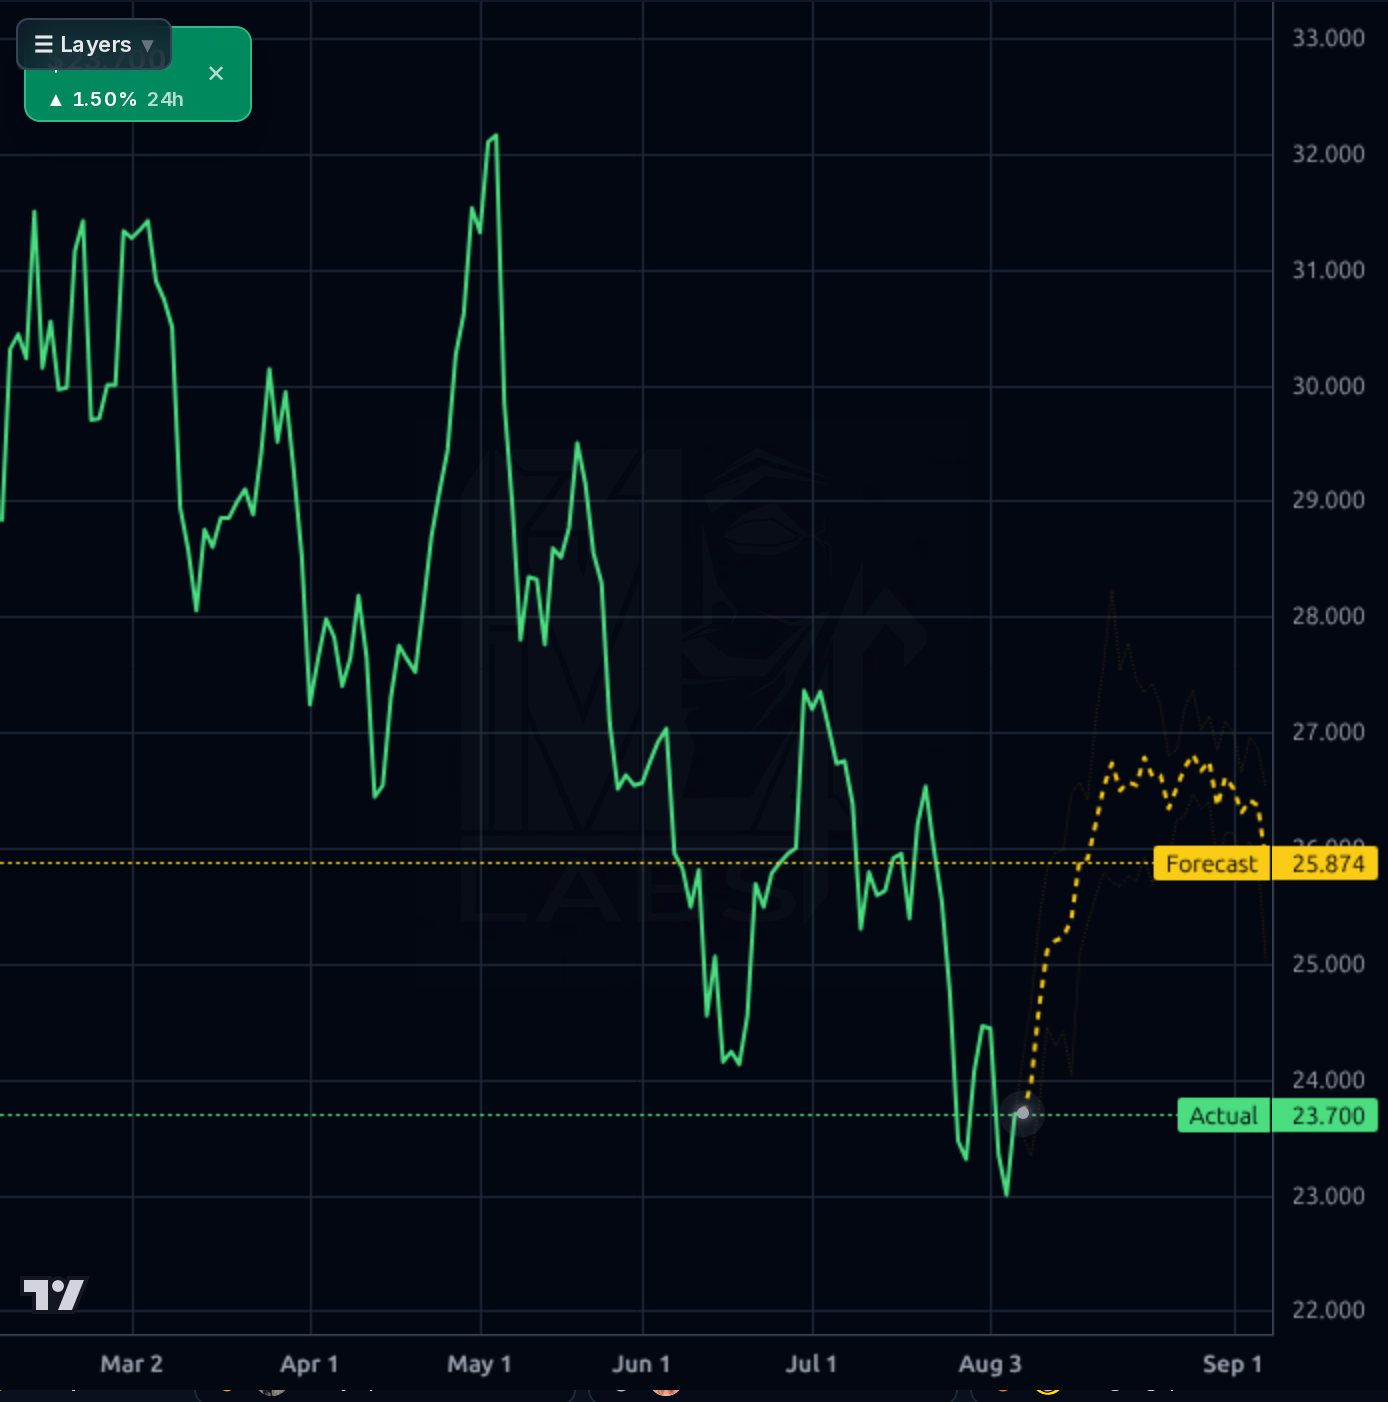
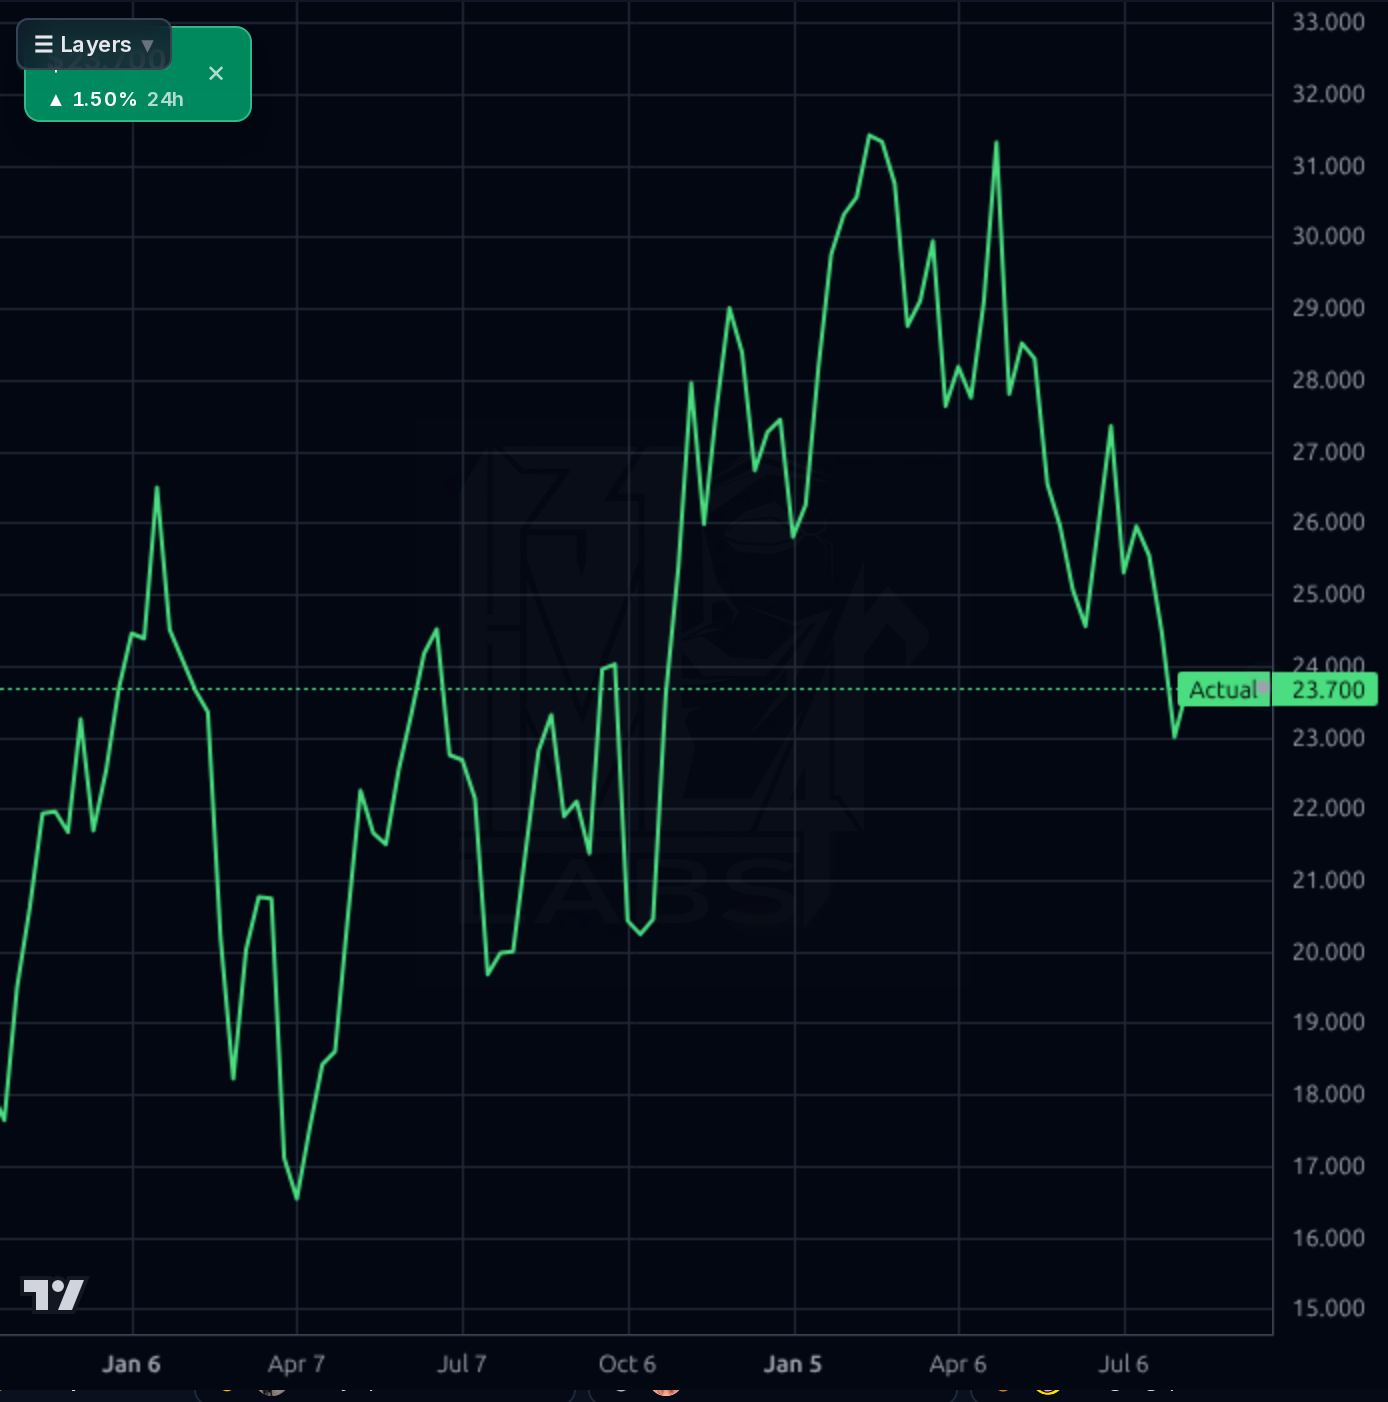
The setup is decidedly weak. The daily chart shows a persistent downtrend from the May peak near $32 through the Aug low at $23.00, with the 1h chart showing a fresh capitulation from ~$27 on Aug 3 to $23.00 and only a tepid intraday bounce. Price sits –8.2% below SMA20, –10.3% below SMA50, and –15.5% below SMA200 — all bearish, with –28.5% quarterly performance and –19.6% half-year. RSI 33.6 is not yet oversold but close; the $22.90 support (prior swing low) is the critical line — a break opens $19.56 (52-week low). The 4h forecast band ($27–$30) implies a mean-revert bounce to ~$28.3, but the model's realized 1d directional accuracy is 41% vs a 77% naive baseline, so I discount the yellow band heavily. Weekly chart shows the stock has round-tripped a full year of gains. Short float 19.9% and 7.55x days-to-cover create genuine squeeze fuel IF the print is clean and funding is non-dilutive.
The binary catalyst is tonight/tomorrow morning: Q2 2026 earnings pre-market Aug 6, consensus EPS $0.32 (–18% Y/Y). A social post claims the print landed at GAAP EPS $0.68 with revenue $465.5M (+44.6% Y/Y) — if accurate, this is a material beat, but treat as unverified crowd chatter until the 8-K prints. The confirmed 8-K referenced strong operational performance and new CCS projects online, consistent with the June 30 announcement of two operational CCS facilities validating the Sequestration-as-a-Service thesis. Sell-side has trimmed targets (Susquehanna to $35, Truist to $34) but remains constructive with mean target $33.75 and Recom 1.23 (strong-buy skew). Simply Wall St flags ~28% upside. Signal: operational execution and CCS milestones are landing; noise: pre-planned insider sale, AI data-center narrative amplification.
- Two new CCS facilities became operational June 30, 2026 — first hard proof of Sequestration-as-a-Service commercial model
- Q1 2026 revenue +64% Y/Y ($376.5M) and EPS Q/Q +146% show upstream scaling with advanced completions uplift
- Path to 1.5M tCO2/yr CCS injection capacity by 2028 provides multi-year asset visibility with 45Q credit monetization
- BKV-BPP Power JV integrates gas power generation with CCS for closed-loop economics, positioned for Texas AI data center power demand
- Barnett + Marcellus dual-basin production with 52% TTM sales growth and favorable hedging coverage de-risks near-term revenue
- $522M TTM FCF deficit vs $289M cash forces external funding decision within 12 months — dilution risk is live
- Debt ballooned from $200M to $1.27B in three quarters; trajectory more alarming than absolute level (D/E 0.57)
- Gross margin compression from ~81% to 58% in one year signals unit economics deteriorating faster than revenue growth compensates
- 45Q tax credit political sensitivity — any rollback collapses CCS NPV and the entire differentiation thesis
- 20% short float + 7.55x days-to-cover reflects real institutional skepticism on the funding path, not a technical squeeze setup
- Q2 EPS consensus –18% Y/Y — margin/cost headwinds expected even by the Street; miss risk is asymmetric to the downside
- Technical trend broken: price below all SMAs, –28% quarter, testing $22.90 support with 52-week low $19.56 as the next shelf
Get AI analysis on any stock
This is one of hundreds of Kronos AI reports — scored fundamentals & technicals, bull/base/bear price targets, a multi-horizon plan, and continuously-updated forecasts across the market. Create a free account to explore them all.
Create your free account →Already a member? Sign in · Join our Discord