BKV — AI Stock Forecast & Price Targets
Published 7/29/2026 · A free sample of K3vl4r’s AI-powered analysis.
Kronos price forecasts, scored fundamentals & technicals, and a multi-horizon plan.
View the live BKV price forecast →
BKV trades at $23.47, down 5% today and 8% since yesterday, entering an Aug 6 earnings print with a $522M TTM FCF hole against $288M cash, a $780M single-quarter debt build to $1.27B, and a 20% short float that reflects real dilution/funding anxiety. Core business is scaling well (Q1 revenue +64% Y/Y at 55% gross margin, two CCS facilities now commercial), but the market is pricing balance sheet risk ahead of a binary catalyst 8 days out. HOLD into the print — sizing is the hedge, not a directional bet.
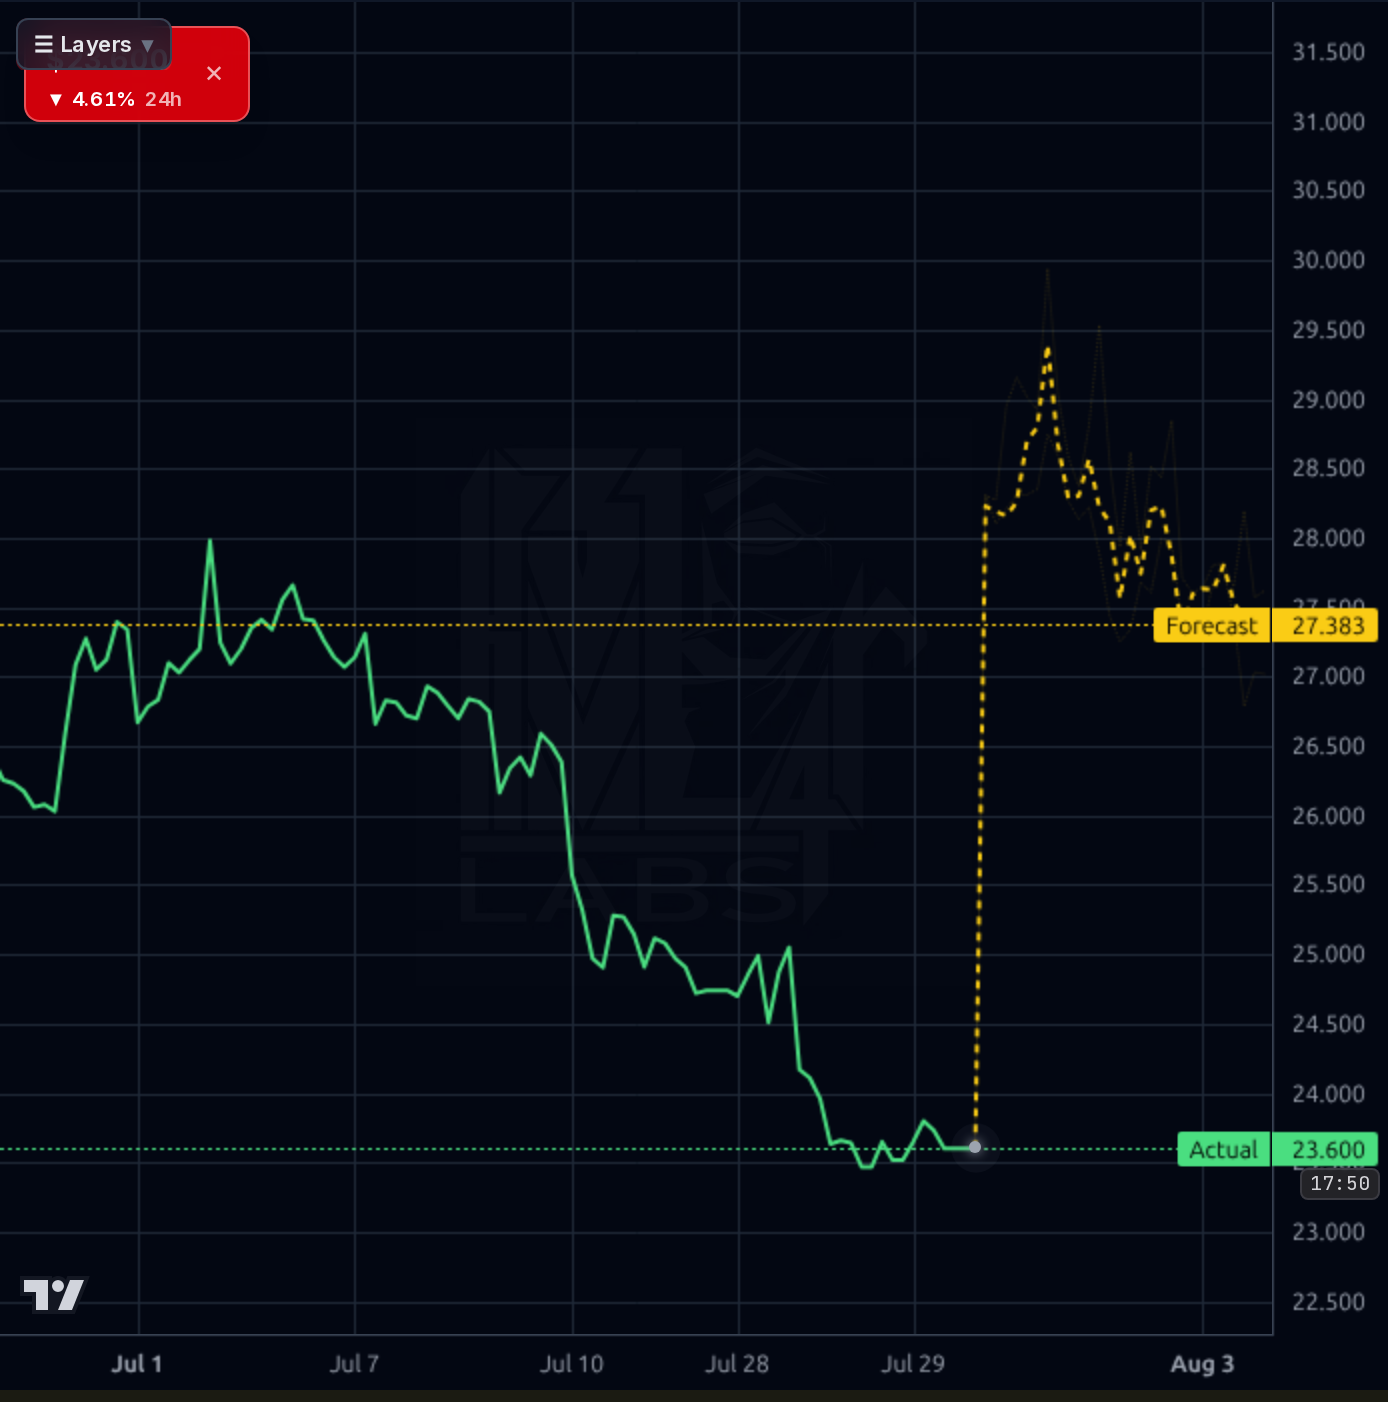
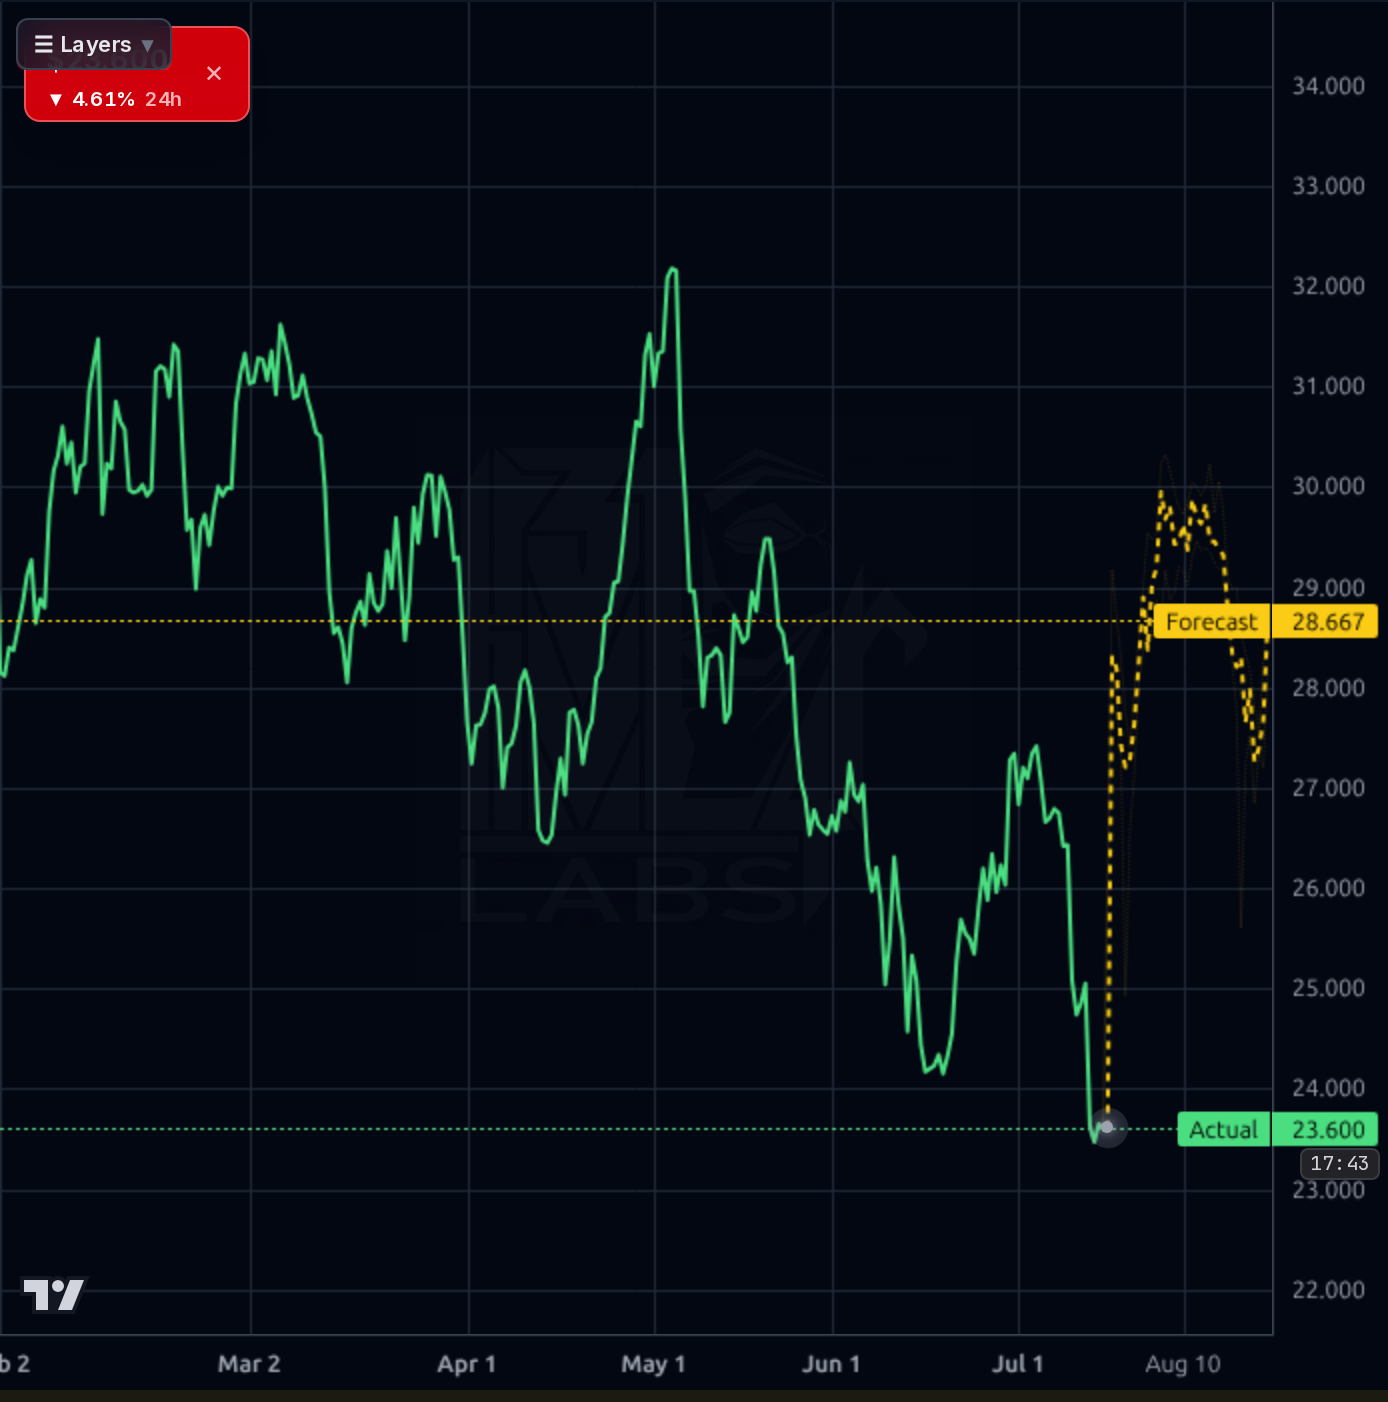
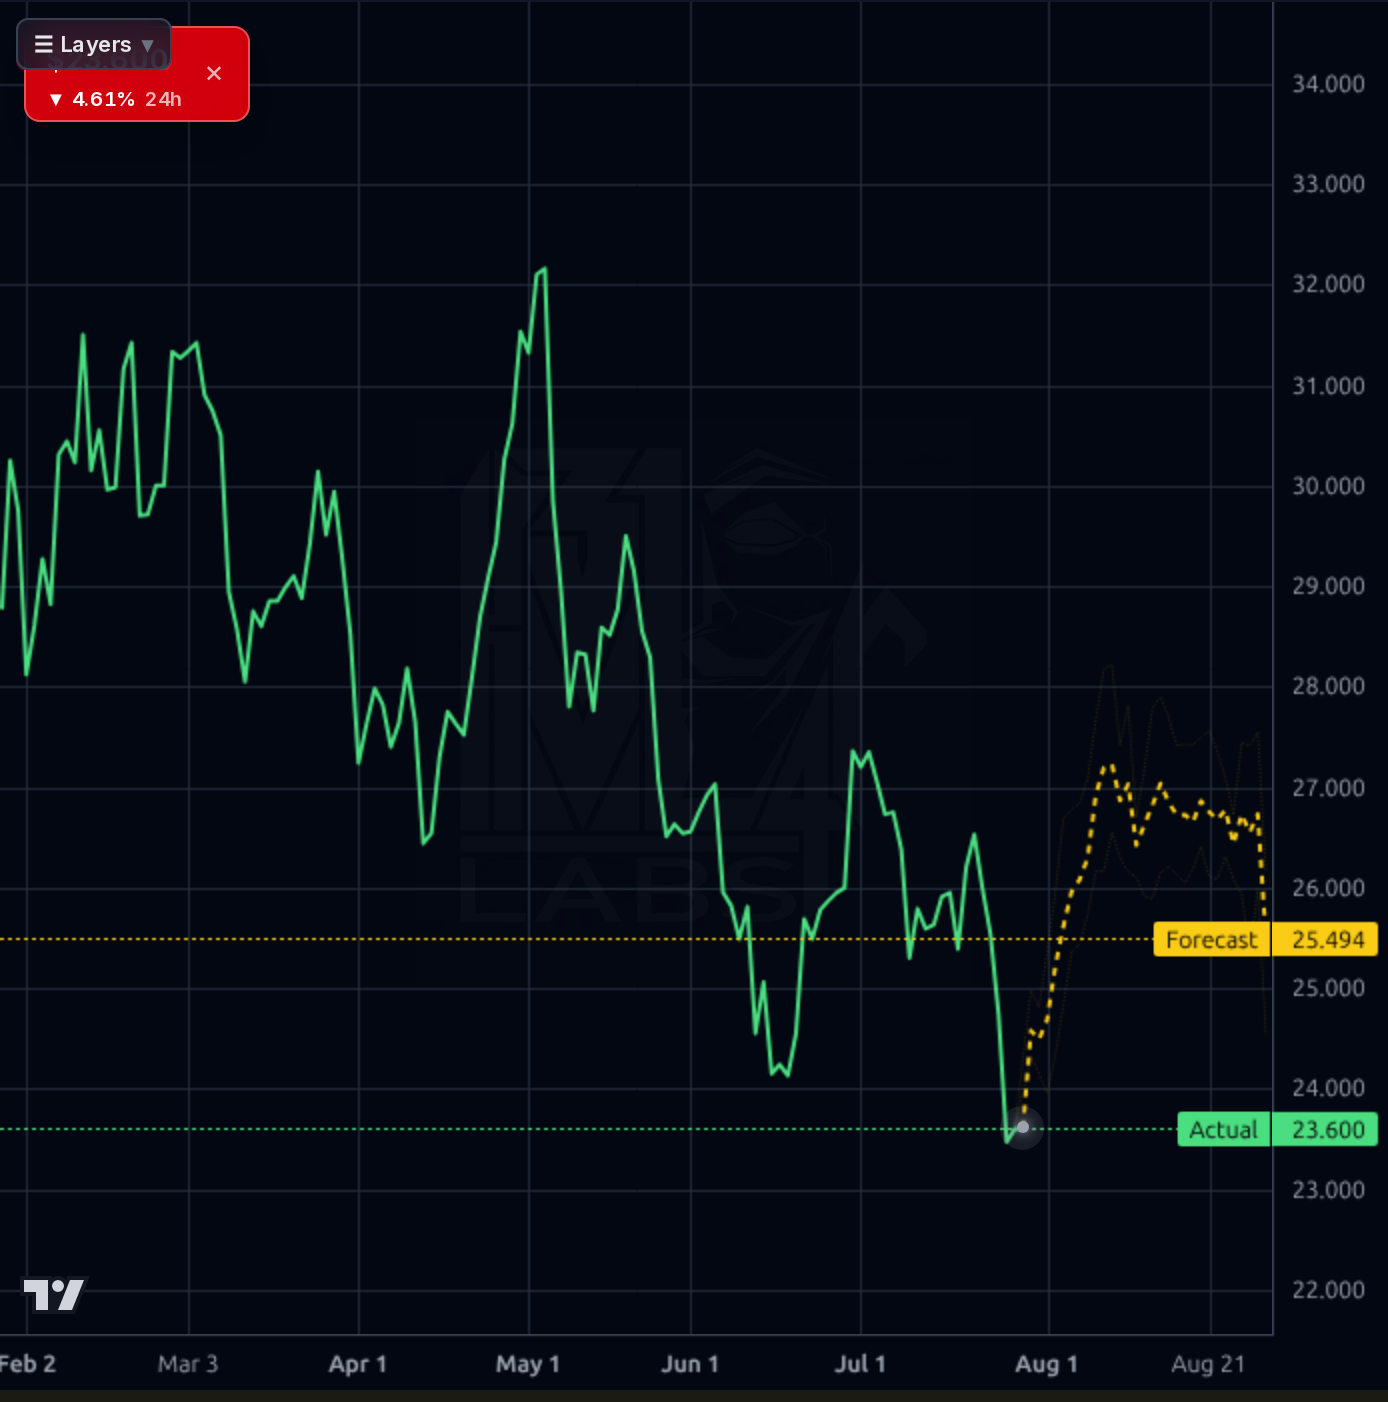
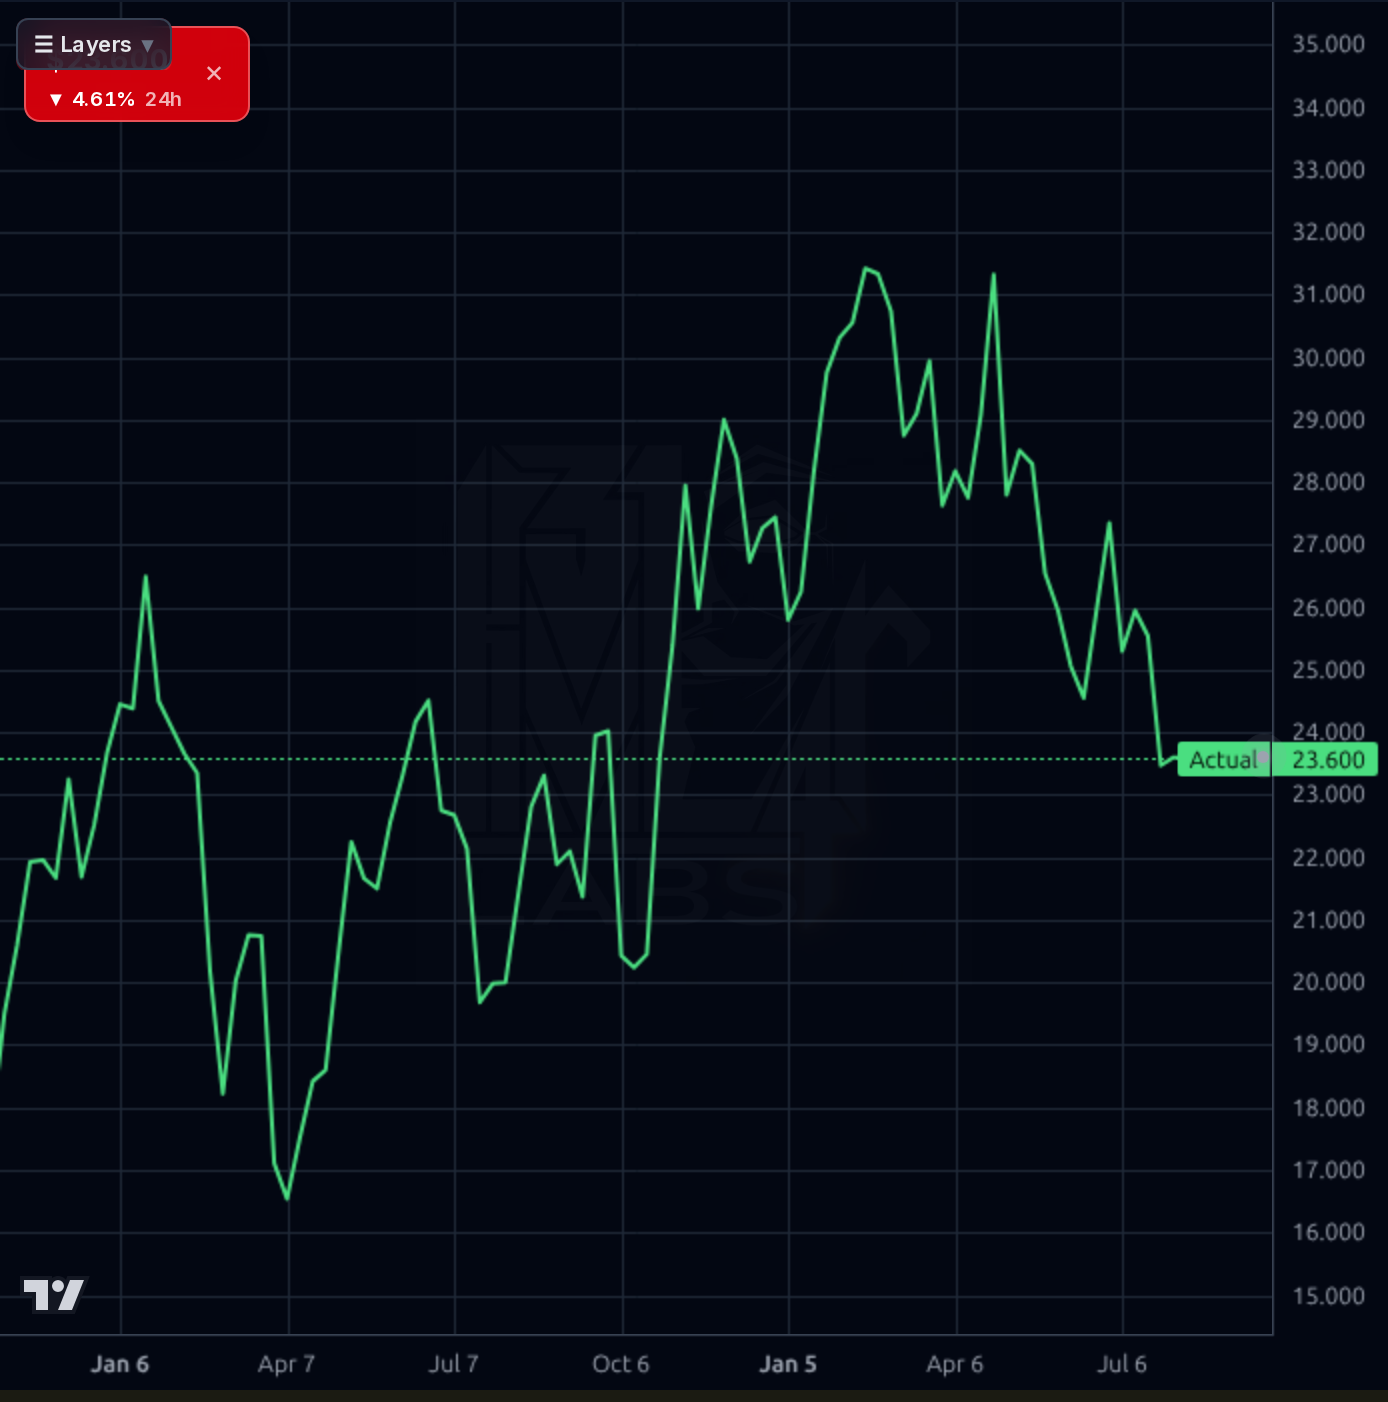
HOLD into the Aug 6 print — do NOT establish a directional swing trade on either side of a binary event with 20% short interest and a $522M funding question. If already long, keep position size at half-normal; the model's near-term bullish forecast is unreliable (sub-naive accuracy). For opportunistic adds, $20-21 (near the 52W low of $19.56) is the only level with a defensible risk/reward pre-print; above $24.74 the setup is chasing. Invalidation: a close below $22 pre-earnings signals accelerating capitulation and the print will likely disappoint. Post-print, wait for the first 48 hours of price action to establish the new range before re-engaging.
1-6 month base case is range-bound $23-27 assuming the Aug 6 print delivers a credible non-dilutive funding bridge (project finance, DevCo, or CCS-backed structured debt). Bull case ($30) requires management to guide 2027 CCS EBITDA specifically and reaffirm no near-term equity issuance. Bear case ($19-20) triggers on any explicit equity raise, capex overrun disclosure, or 2H26 guidance cut. Sell-side PTs of $34-35 look aspirational given the calibration record — my base is $25.5. Expected return range: -15% to +20% skewed slightly bearish given the FCF math is unforgiving until CCS revenue actually shows up on the income statement.
1-3 year thesis rests entirely on whether the closed-loop model (upstream + power + CCS) generates a durable, non-commodity-linked margin from 45Q credits and voluntary carbon offtakes. If Eagle Ford/Cotton Cove ramp per plan and BKV can build to 500K+ tons CO2/year sequestered, this becomes a genuinely differentiated integrated energy platform worth a premium multiple. Terminal price could be $35-45 in a bull outcome. Biggest structural risk: 45Q policy stability under a potentially different regulatory regime, plus voluntary carbon market price volatility — both are exogenous. Secondary structural risk is that E&P + power + CCS conglomerate structures rarely earn full sum-of-parts valuations. Requires patient capital and tolerance for further dilution.
The operating story is bifurcated. Top-line growth is real: Q1 2026 revenue of $376.5M vs Q2 2025's $204M shows the acquisition-plus-CCS-ramp is scaling, TTM sales up ~52% Y/Y, gross margin at 58% and profit margin near 28% (though quarterly gross margins have compressed from ~81% in mid-2025 as lower-margin acquired assets consolidate). ROE of 16.6% and ROIC of 8.9% are respectable for E&P. The problem is the cash conversion: TTM operating cash flow of $298M against capex that produced -$67M FCF in Q1 alone and -$279M in Q4 2025, generating a $522M TTM FCF deficit. Total debt exploded from $200M in Q2 2025 to $1.27B in Q1 2026 — a $1.07B build in three quarters — while cash sits at $288M. Debt/equity has moved to 0.57 and EV/EBITDA is 13.3x, no longer cheap for a levered E&P. The Jan 2026 ~7M share equity raise ($186M) already diluted holders once; the math forces either more debt at worsening terms, another equity raise, or a demonstrable inflection in CCS-driven FCF. Fwd P/E of 11.9x prices in the 45Q monetization thesis but not much execution risk.
Every timeframe shows the stock in a defined downtrend. On the 1h chart, price collapsed from ~$28 on Jul 7 to $23.60 by Jul 29 — a clean lower-highs/lower-lows structure that broke prior $24 support. The 4h and daily views confirm the break of the multi-month $24-32 range, with price now at the lower band and RSI at 31.7 signaling oversold but not yet a reversal. Distance from moving averages is uniformly negative: -9.9% to 20-day, -10.6% to 50-day, -13.6% to 200-day. Perf month -9.6%, quarter -20.3%, half-year -18.3%. The forecast band on both 1h and 4h projects a mean-reversion bounce toward $27-28.7, but the model's realized 1-day directional accuracy (67%) is BELOW the 71-77% naive baseline in this regime — I discount the near-term bullish signal heavily. Support is now the 52-week low at $19.56; the 1-week chart shows this zone was a durable pivot in Jan 2026. Resistance is $24.74 (yesterday's close), then the broken $25.50-26 shelf. ATR of $1.00 on a $23.47 print means 4%+ daily ranges are normalized — sizing needs to reflect this.
Signal: Susquehanna cut PT to $35 (from $37) but MAINTAINED Positive; Truist cut to $34 (from $37) but MAINTAINED Buy — sell-side is trimming, not capitulating. Simply Wall St flags a 28% undervaluation vs analyst PTs. Most material catalyst is confirmed: the Eagle Ford CCS facility started up Jun 30, and combined with Cotton Cove will sequester >120,000 metric tons CO2 annually — this is the 45Q revenue pillar becoming tangible, not just a slide-deck item. StockStory and Seeking Alpha coverage explicitly names dilution as the swing factor. Noise: retail sentiment on Stocktwits is 100% bullish among tagged messages (a contrarian yellow flag given the short float spike from 15.2% to 23% in mid-July before easing to 20.2%). The dominant fact set: earnings Aug 6 BMO, which will explicitly address the funding plan, 2026 capex trajectory, and CCS revenue capture — every other data point is subordinate to that print.
- Eagle Ford CCS facility online Jun 30, 2026; combined with Cotton Cove targets >120,000 metric tons CO2/yr sequestered — first tangible 45Q revenue capture in 2H26
- BKV-BPP Power JV: Jan 2026 acquisition of additional 25% stake (now 75% controlled) via $186M equity raise expands power-gen capacity feeding the closed-loop model
- Q1 2026 revenue of $376.5M (+64% Y/Y) validates upstream scaling from Barnett Shale consolidation
- Aug 6 Q2 print is the near-term inflection: management guidance on 2026 capex trajectory and funding plan will reprice the equity
- Potential Bedrock Energy Partners Barnett Shale acquisition flagged for late 2025/early 2026 impact — further upstream consolidation
- $522M TTM FCF deficit vs $288M cash mathematically forces external funding — additional equity dilution is a live scenario within 12 months
- Total debt ballooned from $200M (Q2 2025) to $1.27B (Q1 2026); leverage now material and rate-sensitive
- Aug 6 earnings is a binary event with 20% short float — gap risk in either direction is elevated, IV crush post-print
- 45Q credit economics depend on regulatory stability; voluntary carbon market prices are volatile and thinly traded
- Stock has broken $24 support and every major moving average; technical damage takes weeks to repair even with a good print
- Gross margin compressed from 81% (Q2/Q3 2025) to 58% (Q1 2026) as lower-margin acquired assets consolidate — mix shift is a headwind
- Model's own near-term directional accuracy (67%) is below the 77% naive baseline, so the bullish forecast band is unreliable in this regime
Get AI analysis on any stock
This is one of hundreds of Kronos AI reports — scored fundamentals & technicals, bull/base/bear price targets, a multi-horizon plan, and continuously-updated forecasts across the market. Create a free account to explore them all.
Create your free account →Already a member? Sign in · Join our Discord