BR — AI Stock Forecast & Price Targets
Published 8/6/2026 · A free sample of K3vl4r’s AI-powered analysis.
Kronos price forecasts, scored fundamentals & technicals, and a multi-horizon plan.
View the live BR price forecast →
Broadridge just posted a strong FY2026 print (recurring revenue +8% cc, adj EPS +12%) and the stock is rebounding off the $133-146 base, but at $164 it still sits ~40% below its 52W high with elevated leverage (D/E 1.21) and a wide bull/bear analyst spread. The setup favors accumulation into a re-rating toward the $190-210 consensus zone, though the model's 1wk forecast is beaten by naive baseline and should be discounted.
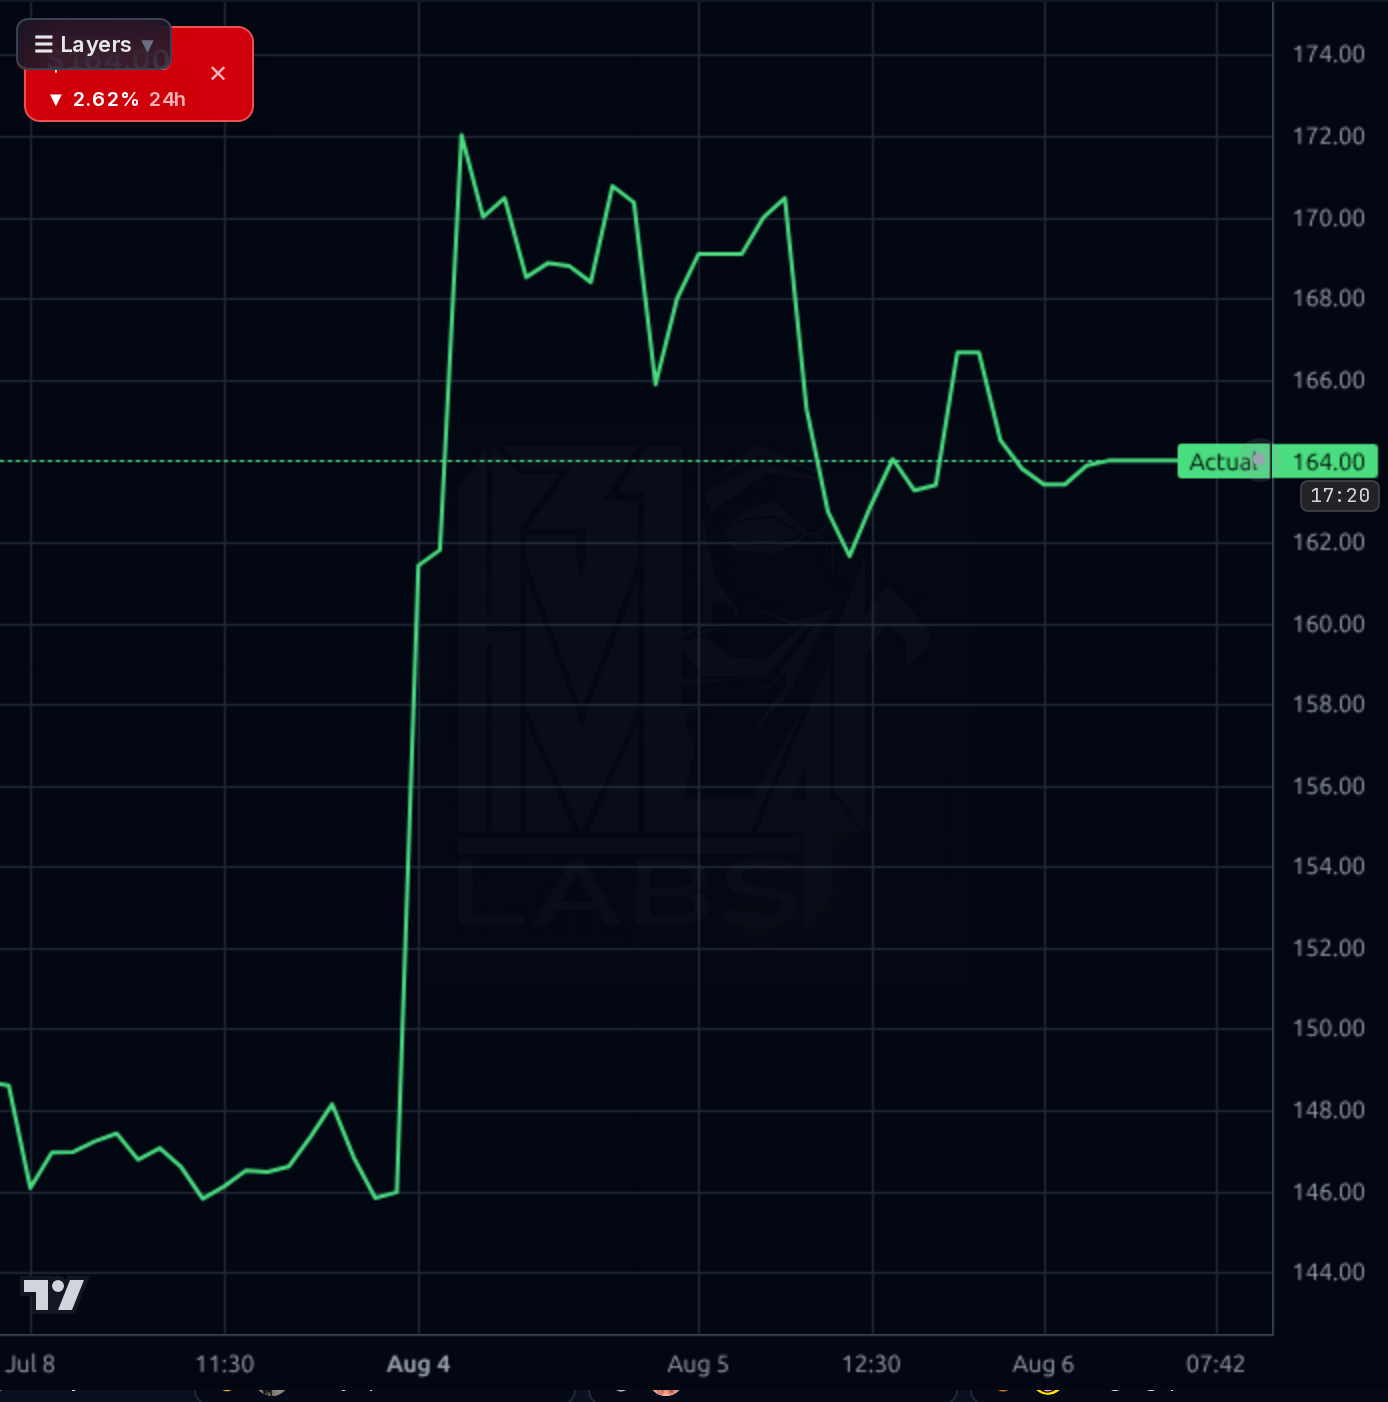
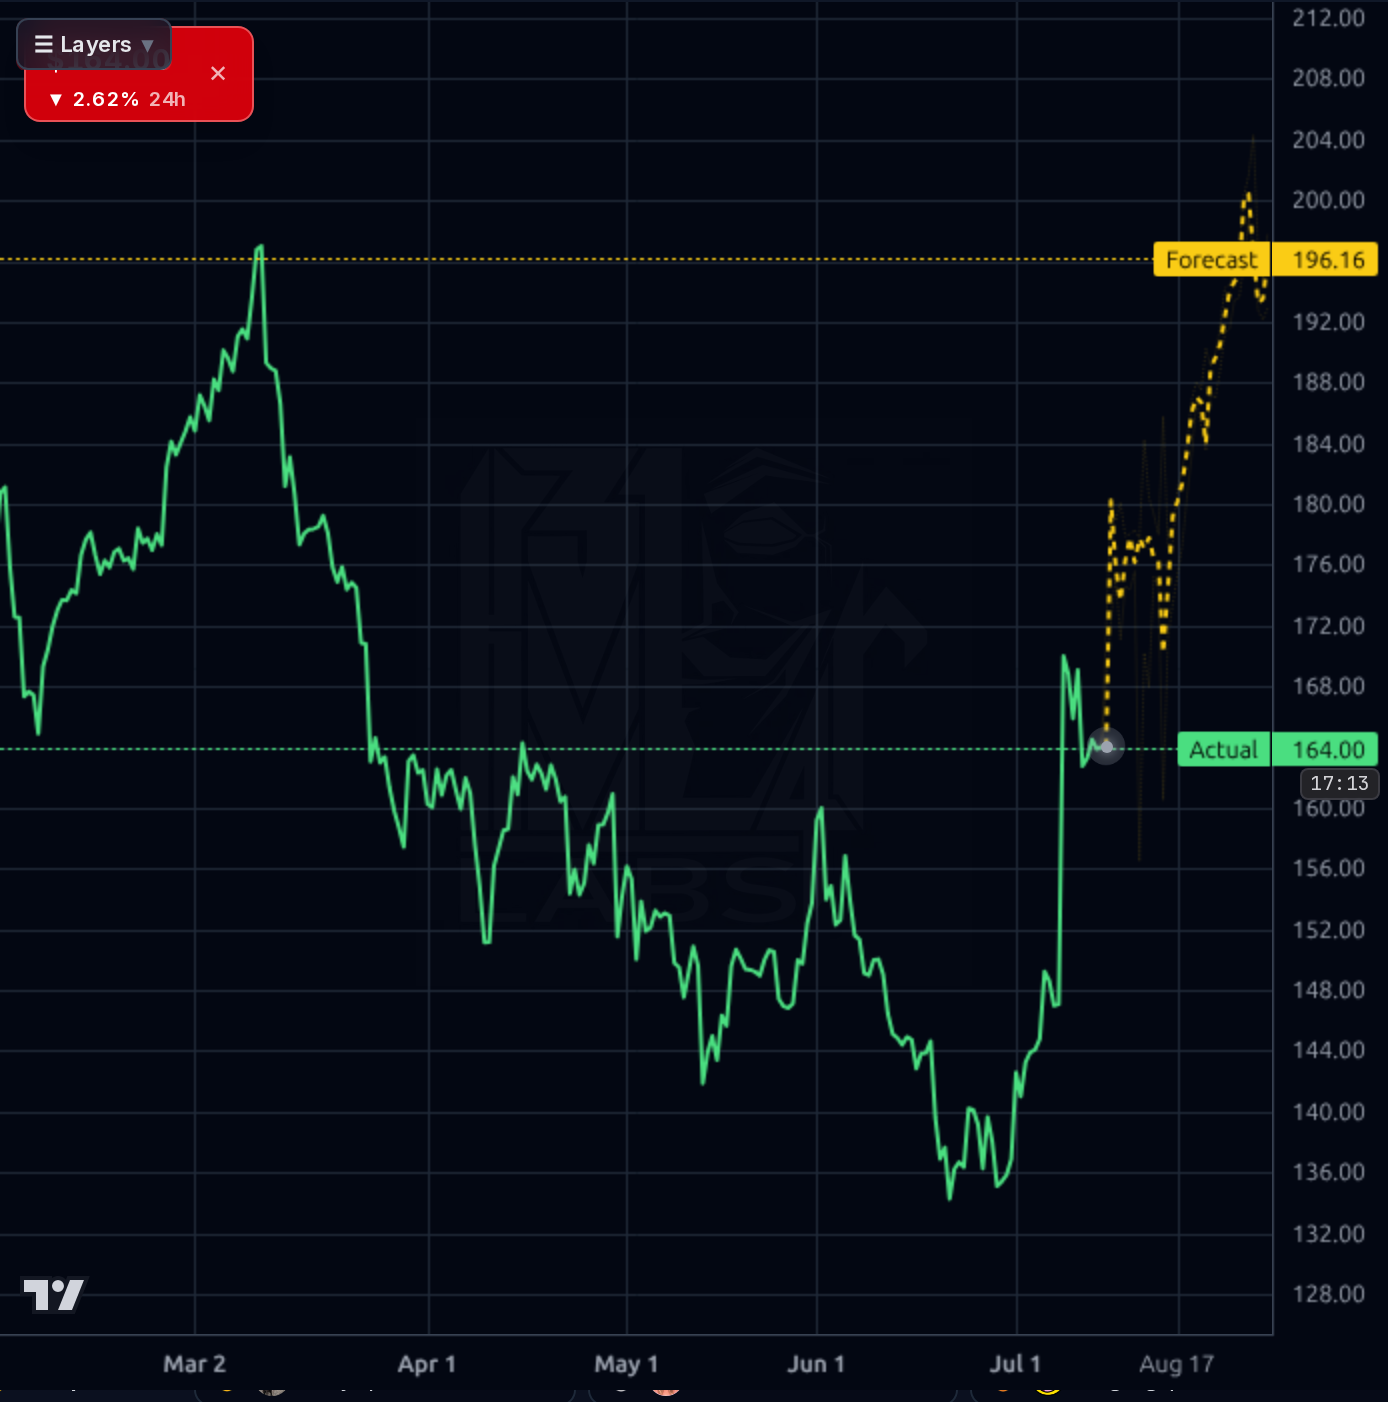
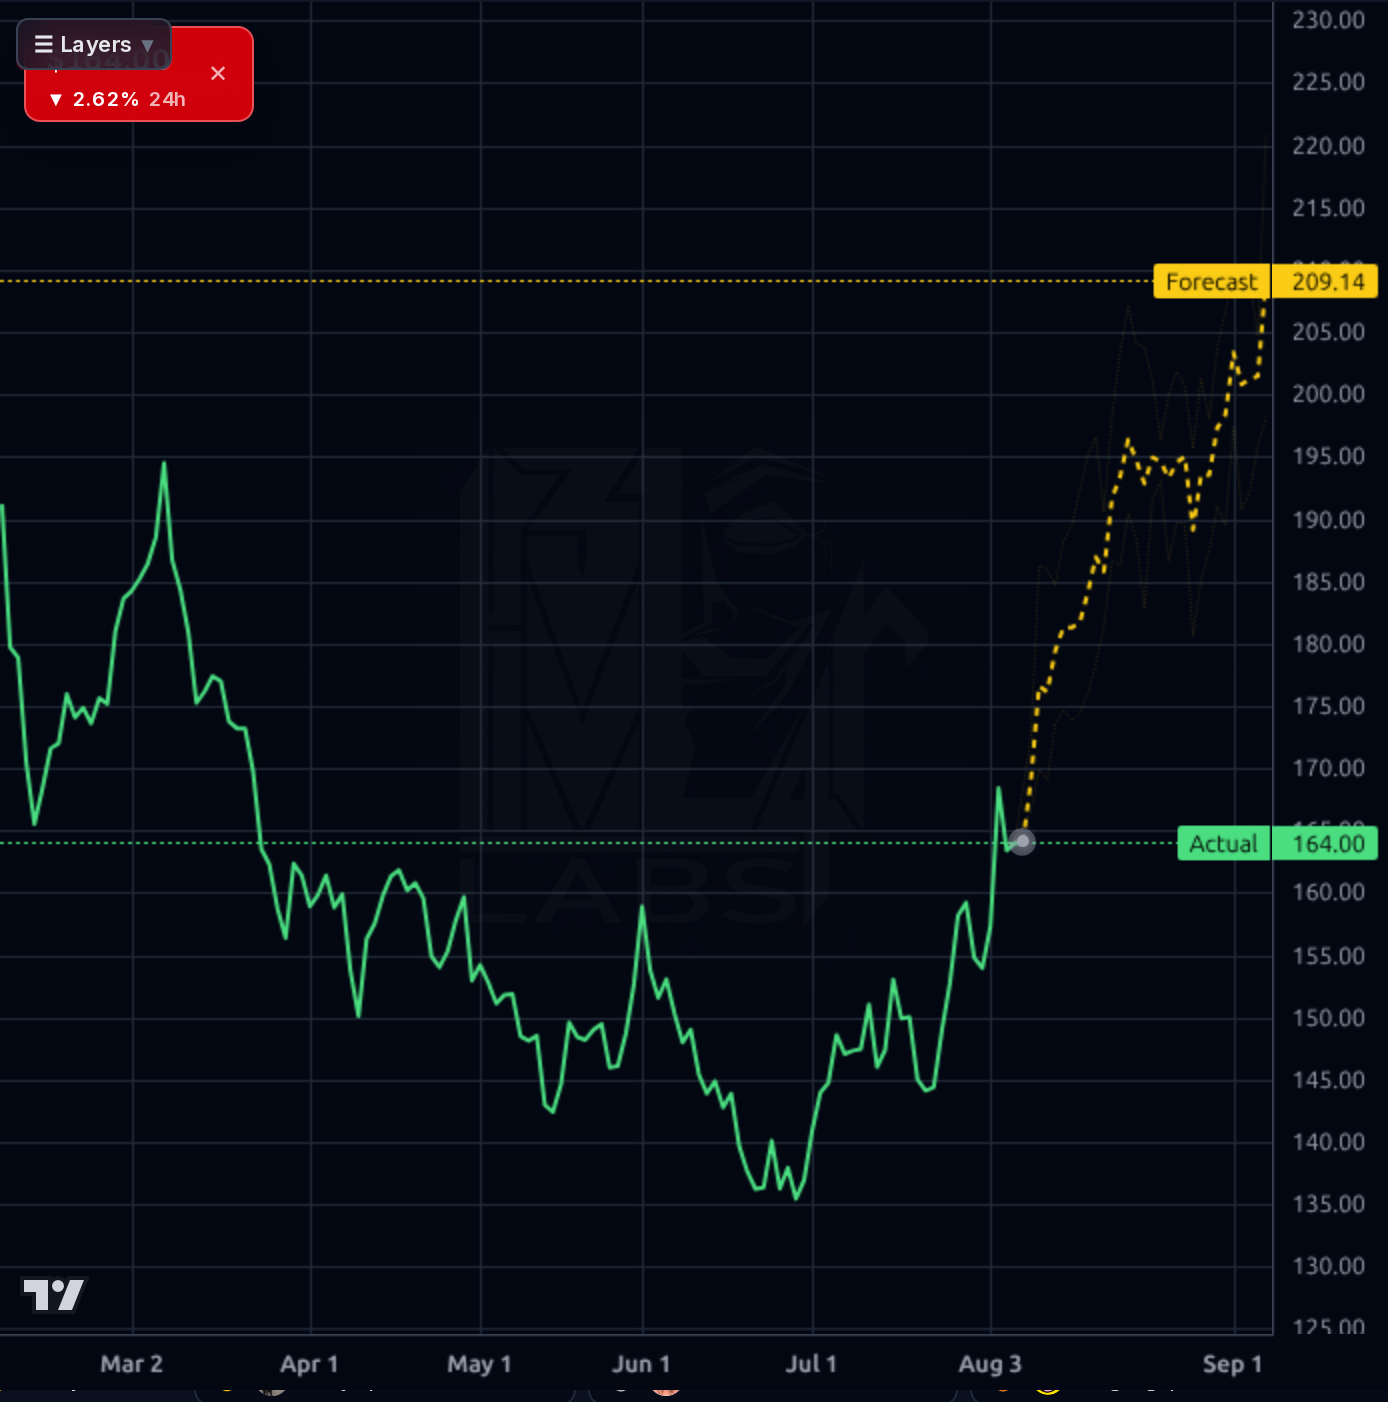
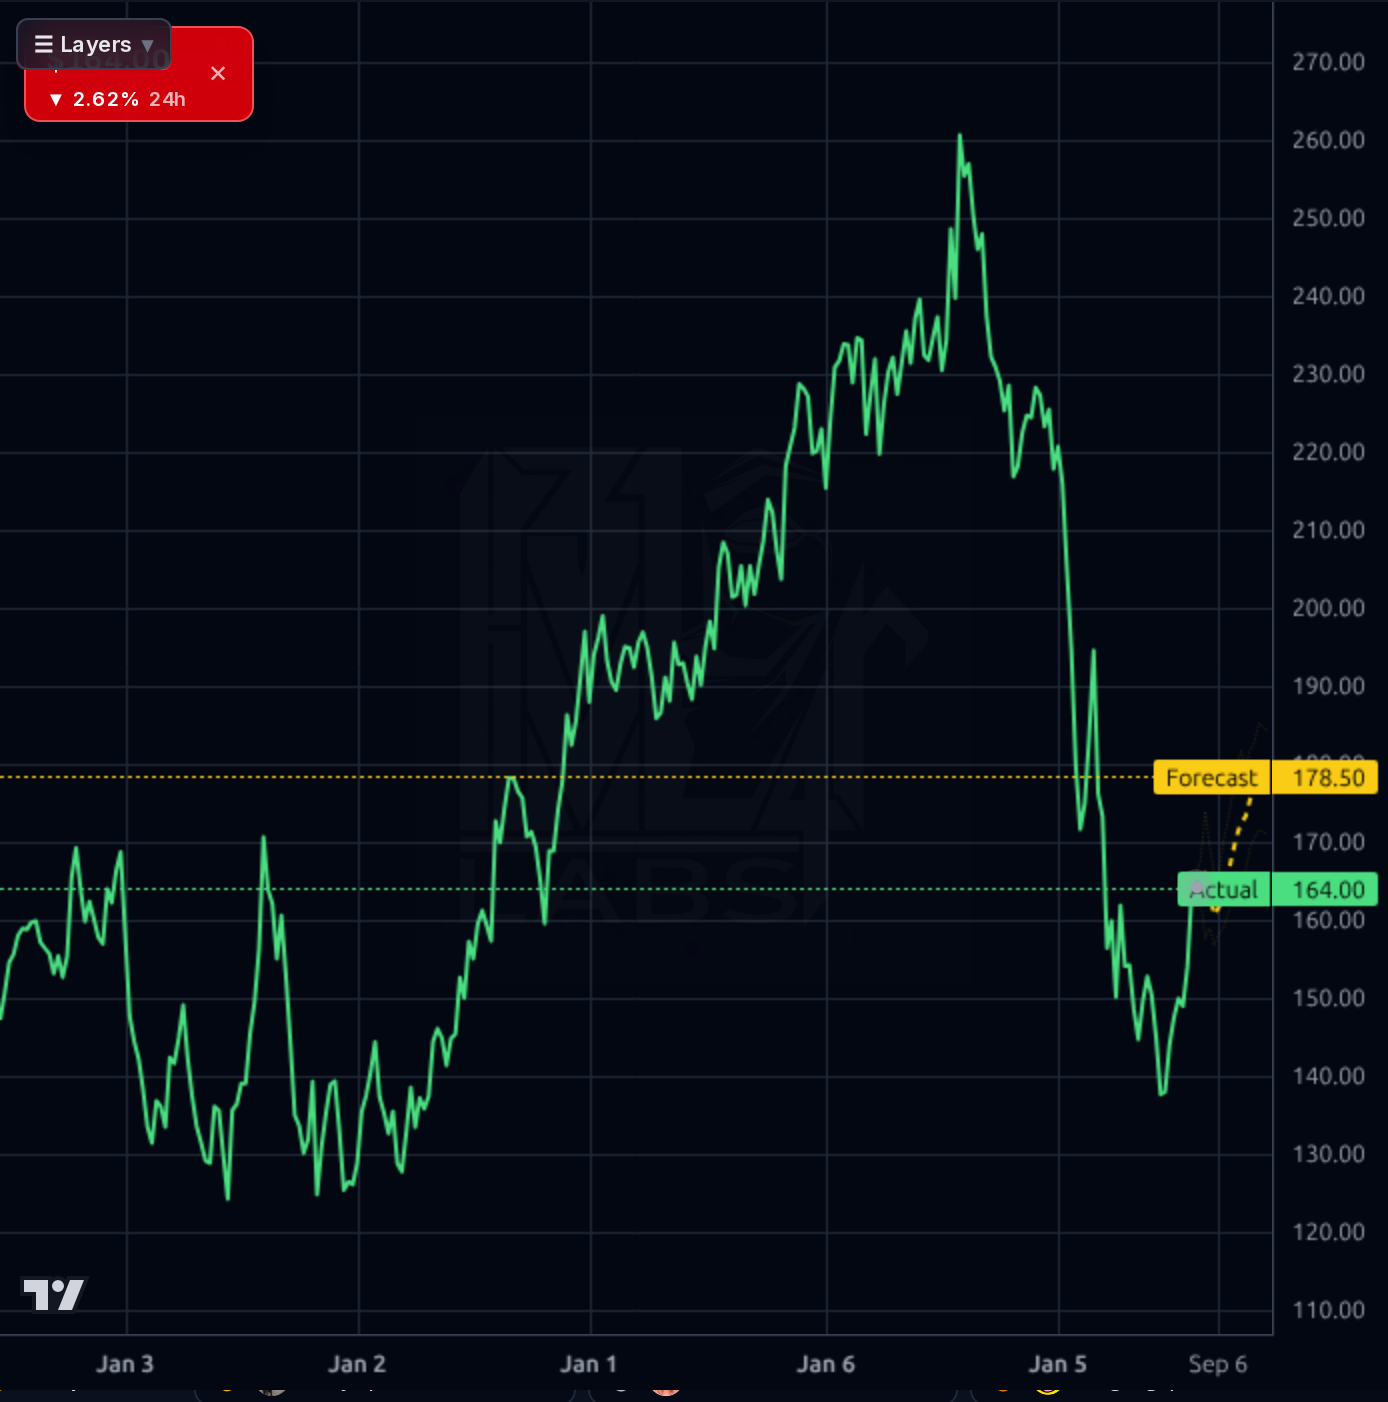
1-4 weeks: with price consolidating above the $160 gap-fill after an earnings beat and RSI 63 (not overbought), initiate/add on any dip toward $160-162 with invalidation on a decisive close below $155 (loss of gap support). First target $172-175 (earnings high + round number). Size at 60-70% of intended full position and reserve the balance for either a $155 retest or a break/close above $175 on volume. Ex-dividend Sep 3 is a non-event but creates a small technical air-pocket that day.
1-6 months: thesis is a re-rating toward $190-210 as FY27 guidance is validated by Q1 (Nov 3 earnings) and Q2 prints. Expected return 15-25% base, 30%+ if closed-sales pace inflects and the AI/tokenization narrative gets any concrete revenue attribution. Catalysts: Nov 3 earnings, investor conferences, any RBC-style PT hike from other covering analysts (consensus $210, high $257). Thesis breaks if recurring-revenue growth slips below 6%, or if operating margin compresses versus the FY26 24.6% Q4 exit rate, or if the stock loses $146 on volume.
1-3 years: Broadridge is a mission-critical financial-plumbing utility (proxy voting, trade processing, wealth platforms) with a >95% institutional-ownership base and 40%+ ROE — a compounder profile. Multi-year drivers: (1) tokenization of traditional securities where BR's rails are already positioned, (2) agentic-AI-embedded regulatory/comm workflows, (3) continued 7-9% recurring revenue growth compounded with buybacks/dividends. Biggest structural risk: technological disruption from blockchain-native settlement platforms that could disintermediate the proxy/communications monopoly, combined with a leveraged balance sheet that constrains M&A response if a real challenger emerges. A secondary risk is capital-markets cyclicality dragging transaction-tied revenue in a bear tape.
Broadridge continues to compound: TTM revenue $7.48B with sales Y/Y +8.2%, EPS Y/Y TTM +40%, and Q4 FY26 (Jun-2026) showing a clear step-up — revenue $2.22B, operating margin 24.6%, net margin 17.9%, and free cash flow of $642M in the quarter alone (FCF TTM $1.19B). ROE of 41-42% and ROIC of 19% underline capital efficiency, and the 20th consecutive dividend hike (+11.8%) plus 40.6% payout ratio signals shareholder-friendly capital return. The blemish is leverage: total debt $3.52B against $403M cash and stockholders' equity of $2.84B (D/E 1.21, LT D/E 1.02), with a current ratio of 1.24 and quick ratio 0.94 — manageable given cash generation but a real sensitivity to rates. Forward P/E 14.1x and P/FCF 14.4x look reasonable for a mid-teens EPS grower with recurring revenue mix, and PEG 1.46 is not stretched. The Q1 FY26 (Sep-2025) margin dip (op margin 11.9%) versus the Q4 blowout shows real seasonality — investors need to weigh full-year averages, not point quarters.
The 1wk chart shows the classic 2024 run to $260 followed by a full retrace to the $137 low in mid-2026 — a 47% peak-to-trough drawdown. Off that low, price has snapped back to $164 (SMA20 +7.4%, SMA50 +10.5%, but SMA200 still -10.5%), so we are in the early stage of a recovery, not a confirmed uptrend. The 1h and 4h show a decisive post-earnings gap from $146 to $172 on Aug 4, followed by orderly digestion into the $162-166 zone — bullish consolidation above the breakout. RSI 62.9 is warm but not extended, and Perf Month +9.97% / Perf Quarter +7.4% confirm momentum has turned. The forecast bands (1d, 4h, 1d timeframes) all point higher toward $196-209, but the model has BEATEN-by-naive stats on the 1wk horizon, so treat magnitude with skepticism. Key support: $160 (gap fill), then $146 (pre-earnings base). Resistance: $172 (earnings-day high), then $180 and the psychological $200. Perf YTD -26.8% and price -39.9% from 52W high mean plenty of overhead supply remains.
The dominant signal is the Aug 4 FY2026 Q4 print: 8% recurring revenue growth (constant currency), 12% adjusted EPS growth, record closed sales, and a robust FY27 pipeline — leading RBC to raise its PT from $200 to $225 (Outperform maintained). Management explicitly cited demand across governance, capital markets, and wealth-management tech, plus continued AI investment. The stock is trading up on the print but well below RBC's and consensus ($210 median) targets, suggesting the market wants to see FY27 execution before fully re-rating. Signal: recurring-revenue durability and margin expansion are intact. Noise: the retail crowd is 100% bullish and dividend-focused (20th straight raise, SCHD holding chatter) — a mildly contrarian yellow flag but not enough to fade a fundamentally healthy print. YTD closed sales pacing was softer than prior year (per the Feb Q2 transcript history), so watch FY27 closed-sales cadence.
- FY26 recurring revenue +8% cc with FY27 pipeline described as robust — organic base case for HSD growth intact
- Record closed sales in Q4 FY26 signals bookings inflection versus softer YTD pacing seen in Feb Q2 print
- Q4 FCF of $642M (TTM $1.19B) funds continued dividend growth (20th consecutive raise, +11.8%) and tuck-in M&A
- Explicit management investment in AI capabilities across governance, capital markets, and wealth platforms
- Direct positioning in tokenization of traditional securities via existing market infrastructure rails
- RBC PT raised to $225 post-print; scope for other covering analysts to follow toward $210 consensus
- D/E 1.21 and total debt $3.52B vs $403M cash makes BR sensitive to sustained higher rates
- Stock still -39.9% from 52W high and -26.8% YTD — significant overhead supply between $172 and $220
- Q1 FY26 (Sep-2025) op margin was only 11.9% — quarterly seasonality can create bearish optical prints
- YTD closed sales in Feb 2026 were $89M vs $103M prior year — bookings lumpiness could resurface
- Model 1wk directional accuracy (67%) trails naive baseline (83%) — magnitude of AI forecast should be discounted
- Retail sentiment 100% bullish is a mild contrarian caution against chasing above $172 without a pullback
- Regulatory uncertainty around tokenized assets could delay monetization of the strategic pivot
Get AI analysis on any stock
This is one of hundreds of Kronos AI reports — scored fundamentals & technicals, bull/base/bear price targets, a multi-horizon plan, and continuously-updated forecasts across the market. Create a free account to explore them all.
Create your free account →Already a member? Sign in · Join our Discord