BSIN — AI Stock Forecast & Price Targets
Published 8/5/2026 · A free sample of K3vl4r’s AI-powered analysis.
Kronos price forecasts, scored fundamentals & technicals, and a multi-horizon plan.
View the live BSIN price forecast →
BSIN remains a high-risk speculative play driven by cyclical energy commodity prices and potential asset monetization, but severe financial distress with negative margins and declining revenue undermines its viability. The technicals analysis shows volatility without clear directional bias, while fundamentals indicate unsustainable cash flow issues. Current price near $1.19 is above the 52-week low of $0.67.
Wait for earnings (Aug 11) to validate or invalidate the technical breakout; if price breaks above $1.20, consider a small long position with stop-loss at $1.13. Invalidation is below $1.13 due to recent support.
Hold until earnings report; if positive cash flow emerges, reconsider as a speculative play. Catalysts include asset sales or regulatory shifts, but current financial distress makes sustained upside unlikely without material catalysts.
The company's long-term viability depends on successful deleveraging and revenue growth. However, with declining revenue (-61.17% Y/Y TTM) and negative margins, the terminal thesis is likely a distressed asset play rather than a growth story. Structural risk includes persistent commodity price volatility and regulatory shifts in energy markets.
Revenue has declined sharply (-61.17% Y/Y TTM), with gross margins negative at -24.53% and operating margins at -153.40%. The company faces severe financial distress: negative net income, high debt-to-equity (7.45x), and persistent negative cash flow (-$16.8M FCF). While short float has reduced from 9.1% to 4.34%, this is offset by a $2.75 target price that appears disconnected from current fundamentals given the company's inability to generate positive operating cash flow. The forward P/E of 19.83x is misleading due to negative earnings, and the high short interest (1.53M shares) suggests significant bearish sentiment.
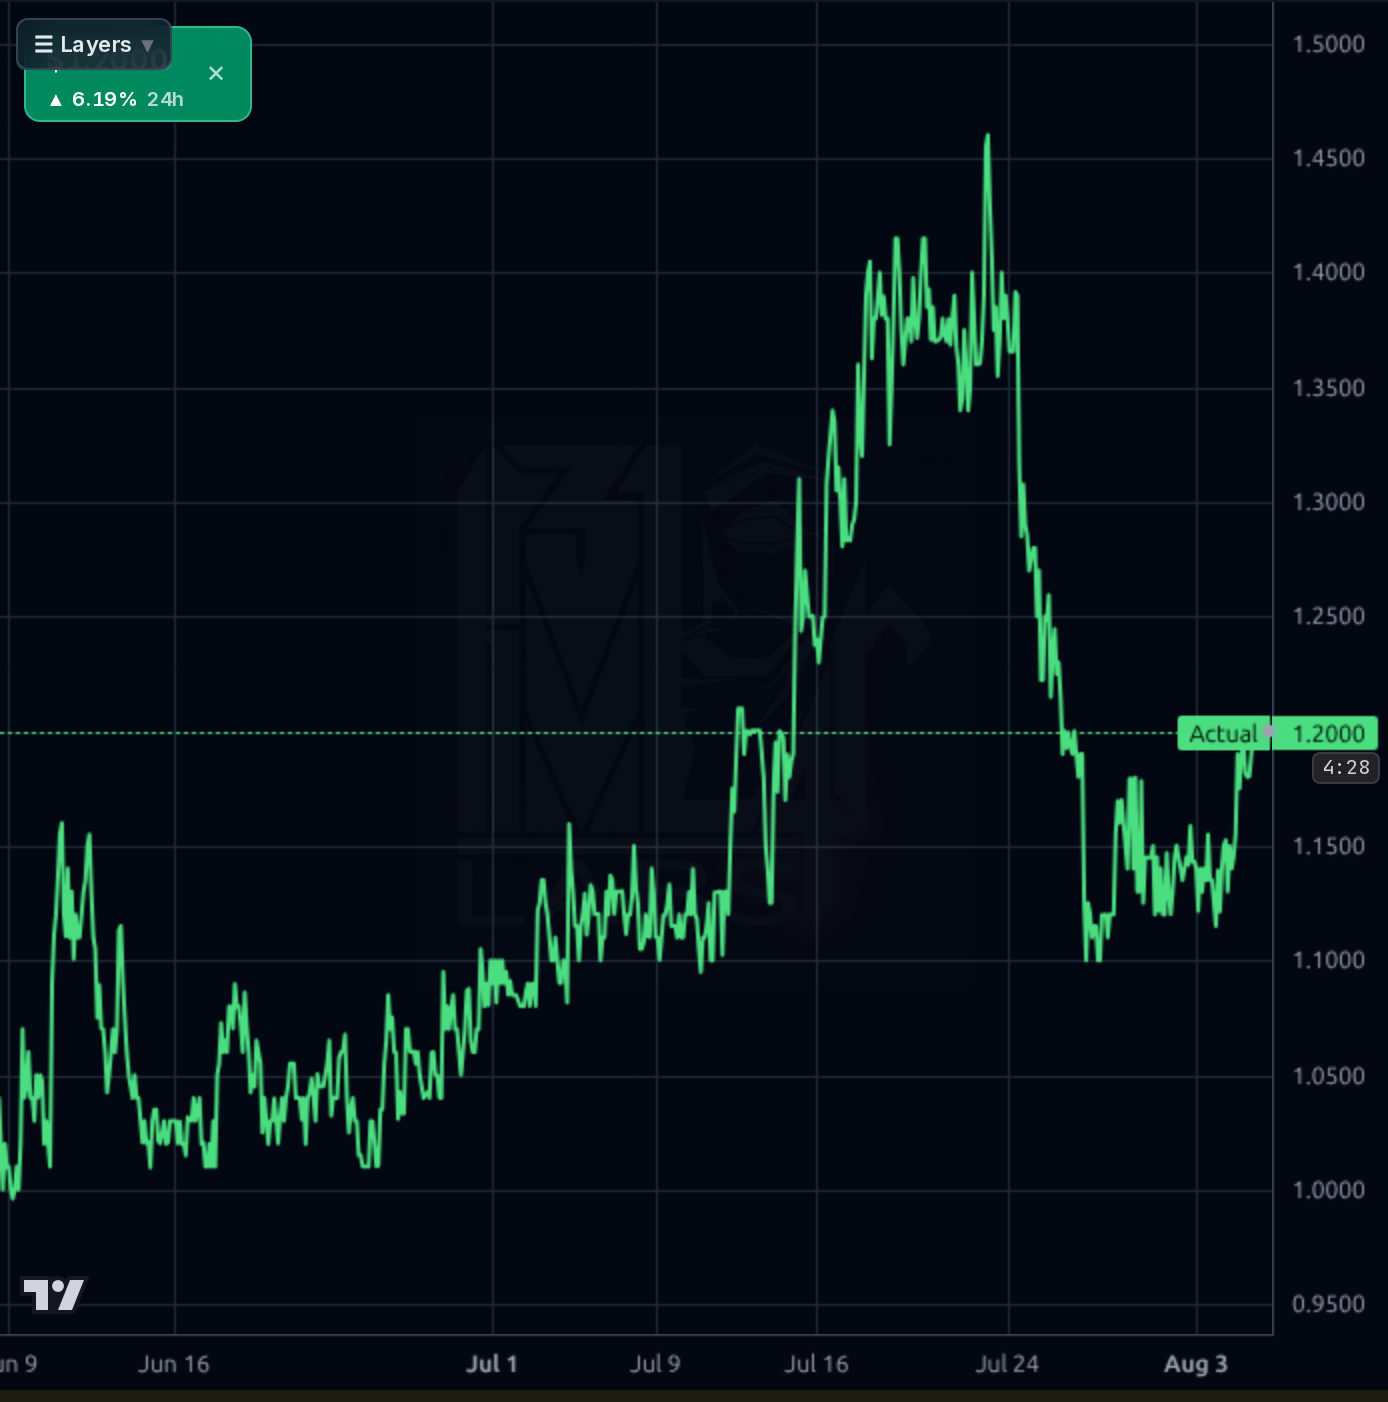
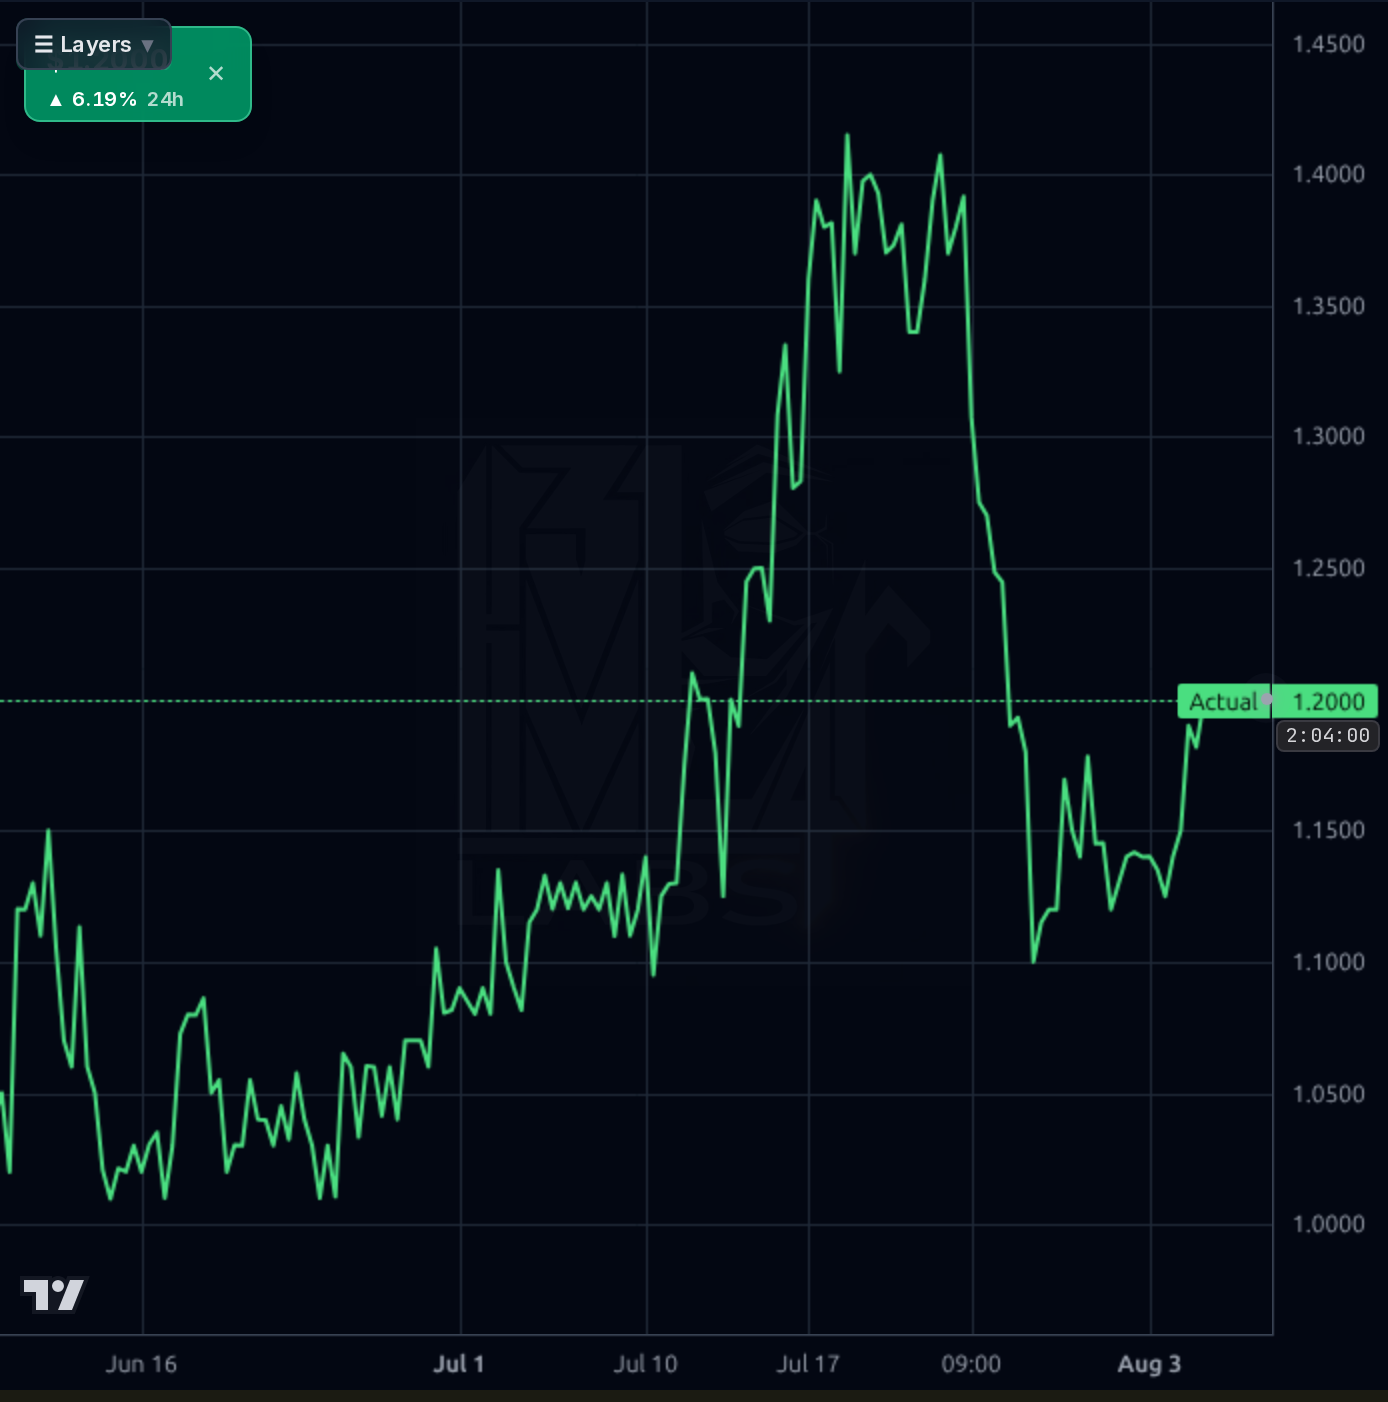
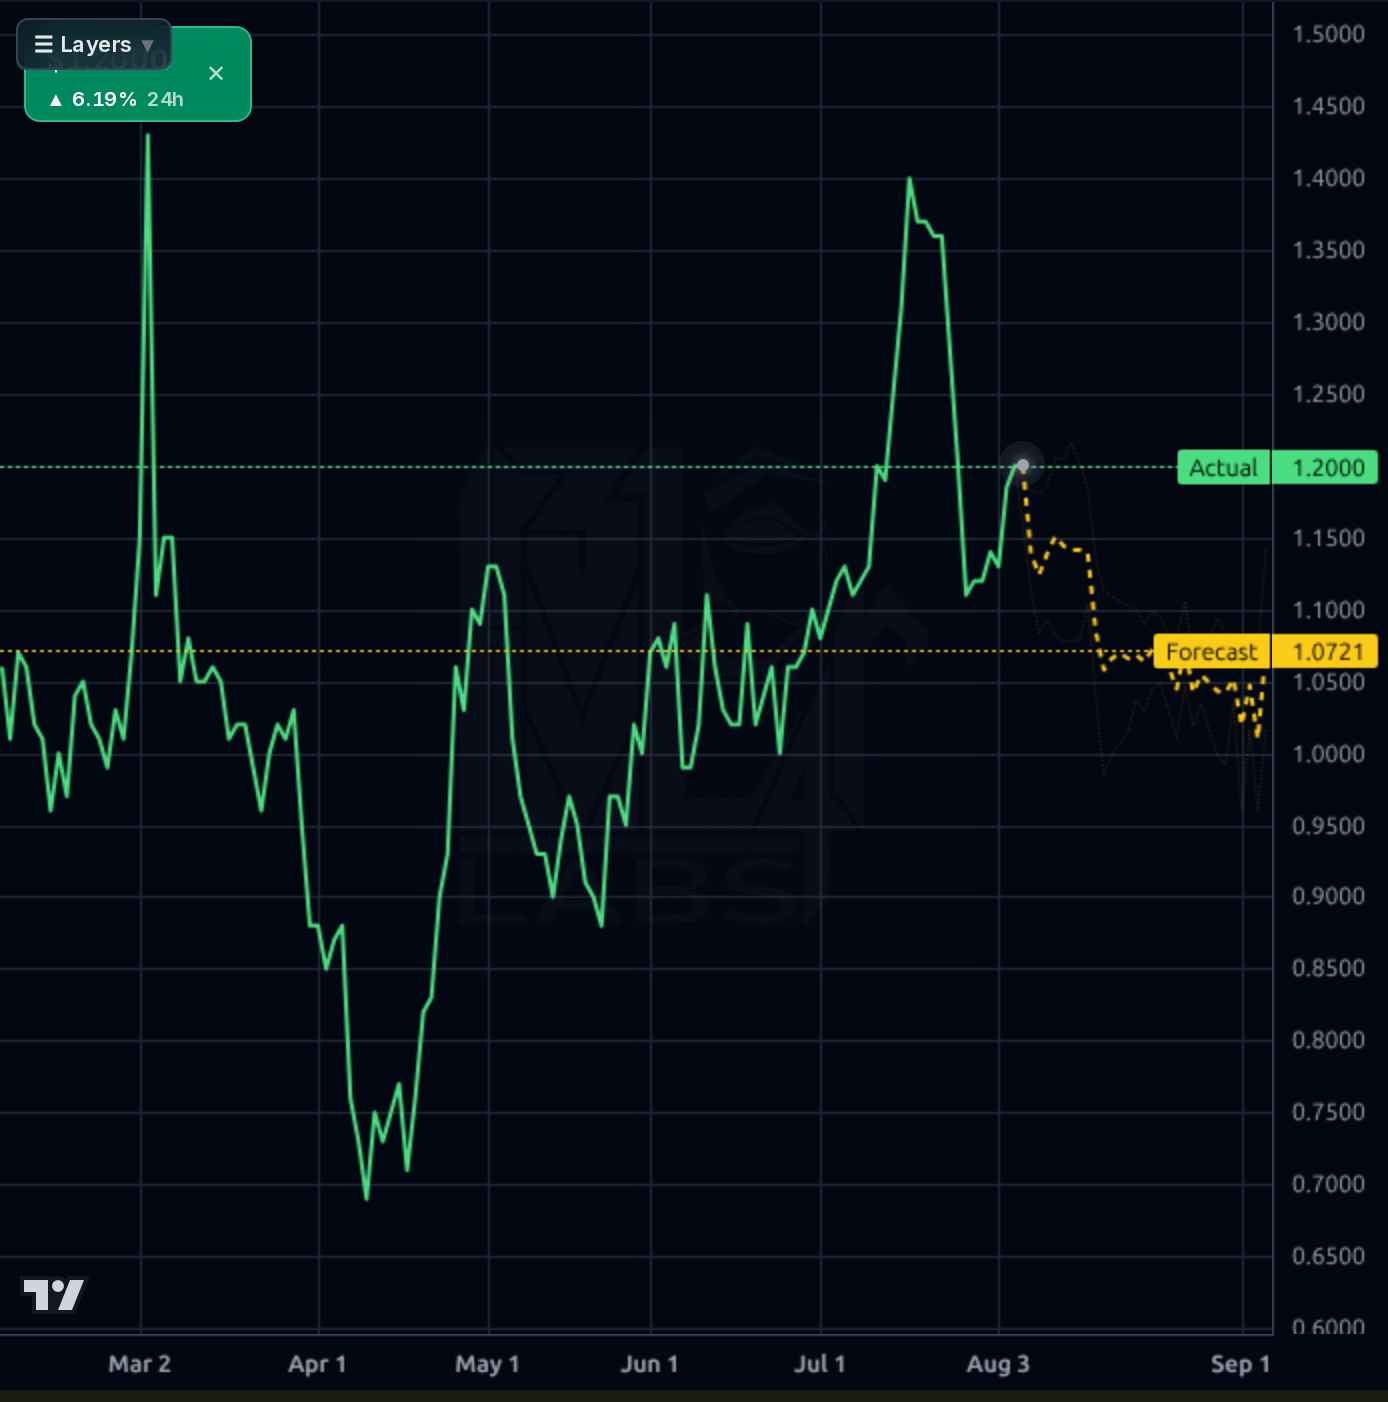
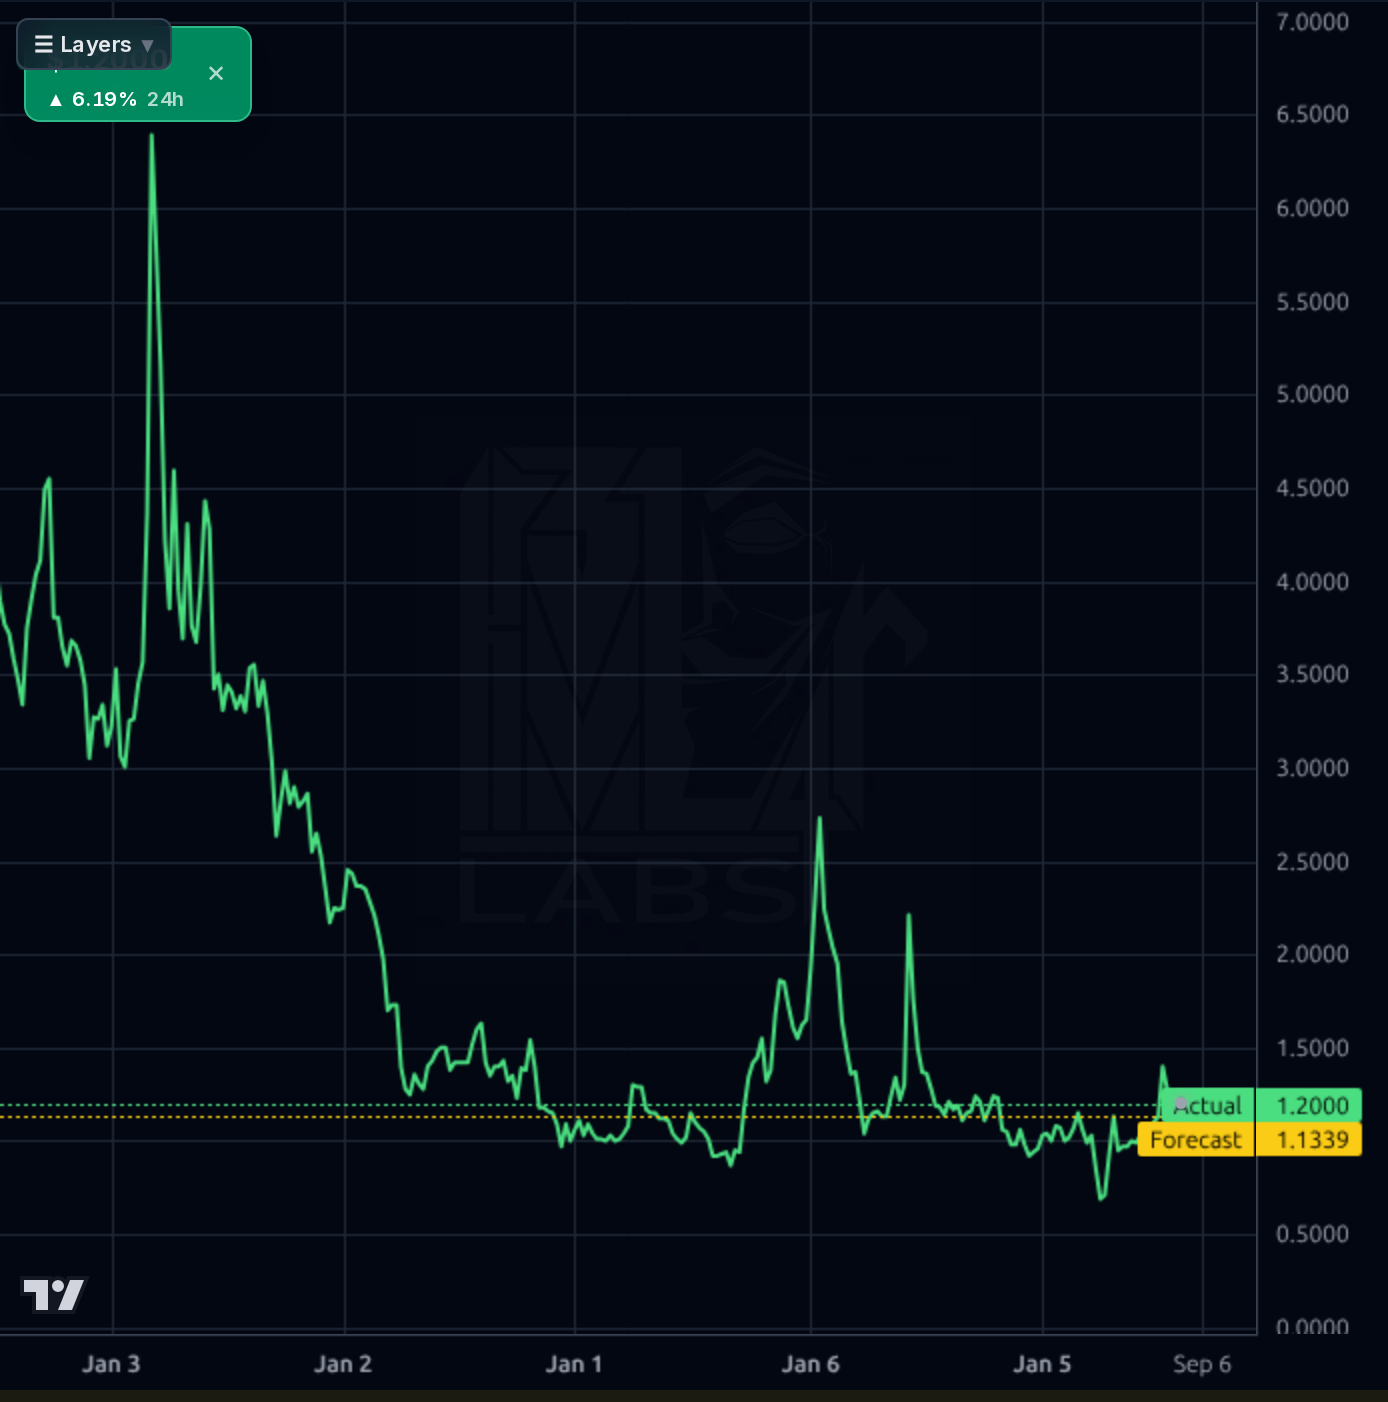
The chart shows a volatile uptrend with strong resistance at $1.20 (actual price), while Kronos AI forecasts suggest continued volatility without clear directional bias. The 52-week range is $0.67-$1.52, but the current price of $1.19 is near the upper end of the recent consolidation. The forecast band shows a narrow range between $1.07 and $1.20, indicating limited upside potential without material catalysts. Technical momentum is weak with RSI at 51.54 (neutral), and the SMA20 (-2.70%) suggests short-term weakness.
No significant news in our database; however, the imminent earnings report on Aug 11 is a binary event that could trigger volatility. The company's financial distress remains unchanged with negative margins and declining revenue, while the $2.75 target price appears disconnected from current fundamentals given the lack of sustainable growth drivers.
Get AI analysis on any stock
This is one of hundreds of Kronos AI reports — scored fundamentals & technicals, bull/base/bear price targets, a multi-horizon plan, and continuously-updated forecasts across the market. Create a free account to explore them all.
Create your free account →Already a member? Sign in · Join our Discord