BSX — AI Stock Forecast & Price Targets
Published 8/5/2026 · A free sample of K3vl4r’s AI-powered analysis.
Kronos price forecasts, scored fundamentals & technicals, and a multi-horizon plan.
View the live BSX price forecast →
Boston Scientific remains a broken compounder trading at $49 vs. a 52-week high of $109.50, down 48% YTD despite still-robust operating fundamentals (Q1'26 revenue $5.2B, 69.4% gross margin, 25.8% net margin). The stock has stabilized off the $42.20 low, RSI is now 67.6 and above SMA20/50, with insider buying and a modest price-target cut being the fresh signals. Forward P/E of 14.3x on $3.44 forward EPS is reasonable for a mid-teens grower, but prior base targets have consistently overshot the tape — I'm keeping an accumulate stance with disciplined, closer-in targets.
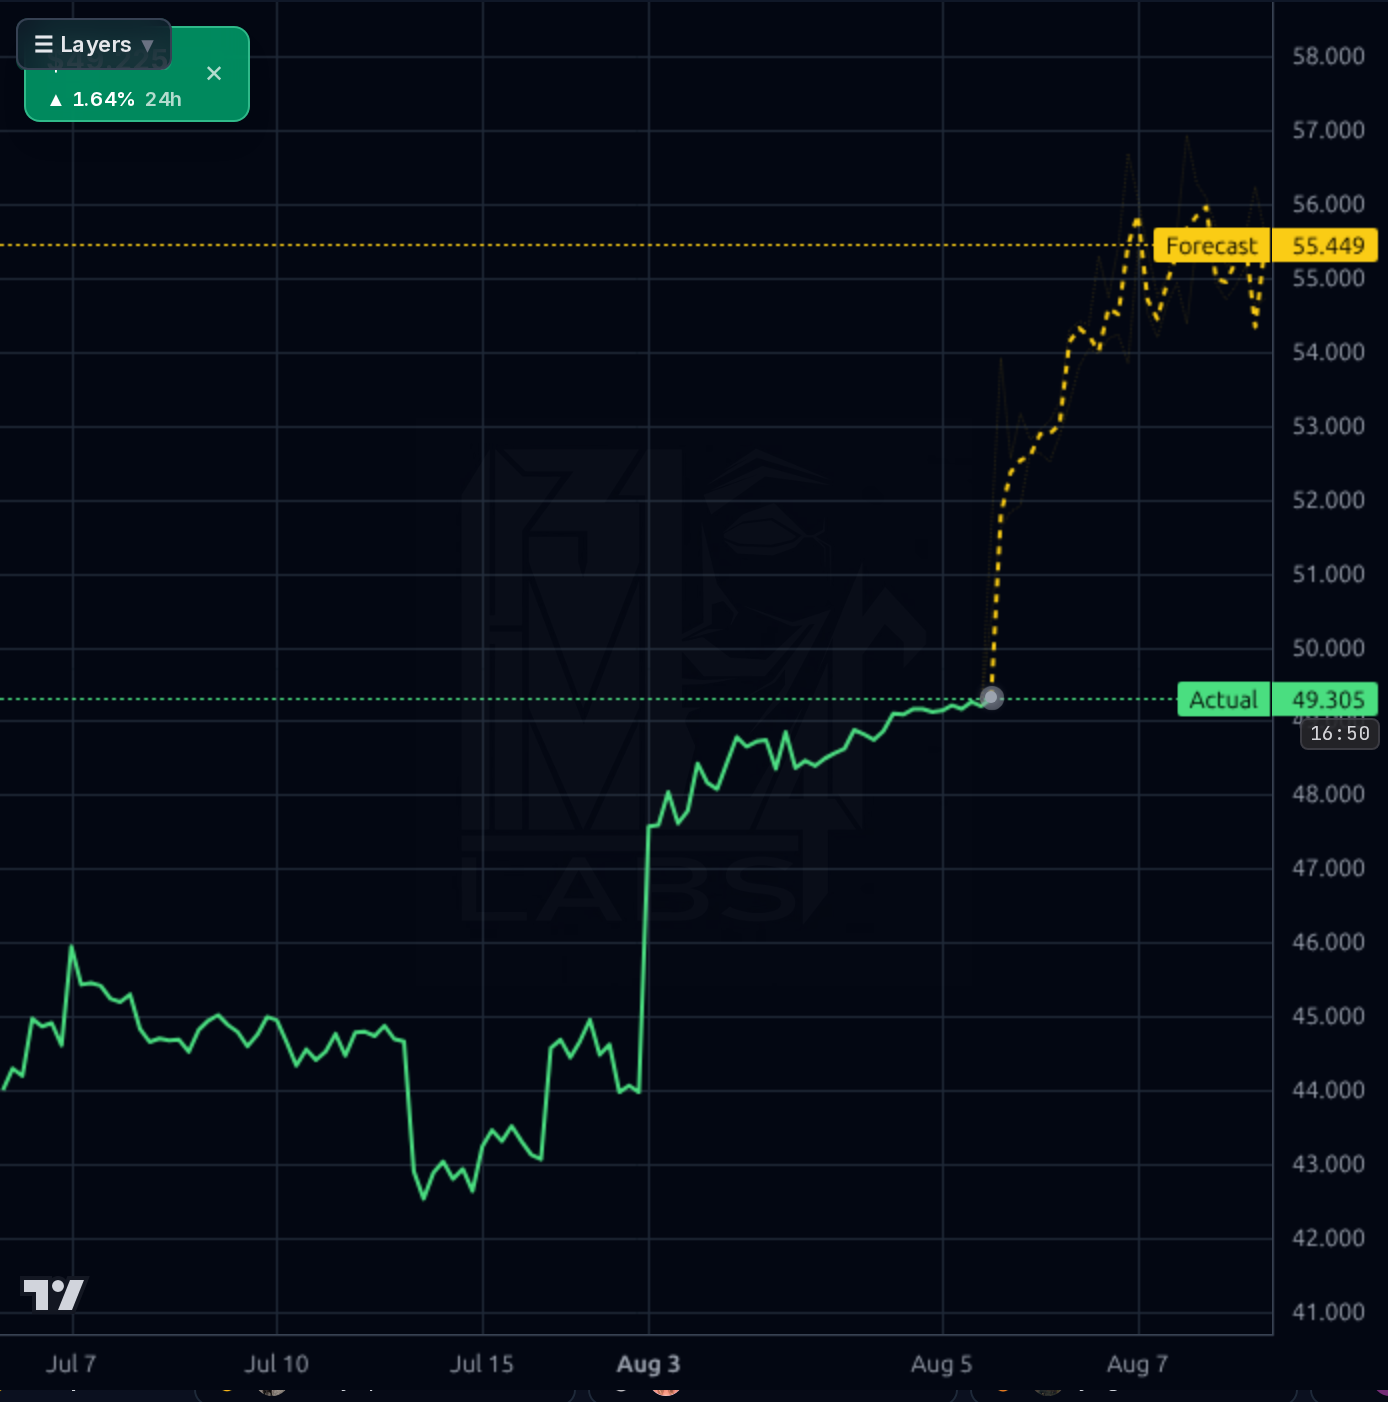
Price has run +6.6% in a week and RSI 67.6 puts it near overbought after a gap-up. I'd not chase here — accumulate on pullbacks toward $46–47 (breakout retest / SMA20 zone) rather than into strength. Initial invalidation: sustained close below $44 (would negate the base and re-open the $42.20 low). Upside handle for a swing: the $53–57 gap-fill zone flagged on shorter timeframes. Position sizing: quarter to half sized starter here, add on the retest.
Over 1–6 months the setup is: does the stock re-rate toward the $61 sell-side target as WATCHMAN/EP concerns normalize, or does the guide-down get extended in October? Q3 earnings on 10/21 is the pivot. Base case: grind higher into earnings toward $55–60 as institutions rebuild positions (Inst Own 91.6% but Inst Trans -3.1% shows recent trimming that could reverse). Bull case requires guidance stabilization and clean EP commentary. What would change my mind: another guide cut in October, WATCHMAN volume declines accelerating, or a break below $42 that would signal fundamental thesis erosion, not just sentiment.
Over 1–3 years the terminal thesis is that a $21B-revenue, 22% operating-margin medical device franchise with a 15%+ ROE and a still-growing EP/structural heart franchise should not trade at 14x forward earnings. Historical premium multiples were 25–30x forward. If the company can re-establish a mid-teens EPS growth trajectory (EPS 5Y estimate is currently only 7.2% — needs to lift), a 20–22x multiple on $4.50–5.00 EPS by 2028 gets you to $90–110 — but that requires WATCHMAN FLX/next-gen and EP portfolio traction being real. Biggest structural risk: competitive disruption in EP (Medtronic PFA, J&J Varipulse) permanently caps share gain and forces continued multiple compression.
The underlying business is high-quality: TTM revenue $21.0B with Sales Y/Y TTM +13.5%, gross margin 66–69% quarterly, operating margin ~22%, net margin ~17.5%, and ROE ~15.3%. Q1'26 delivered $5.20B revenue, $3.61B gross profit (69.4% GM), $1.07B operating income, $1.34B net income and $1.60B EBITDA — clearly not a business in operational distress. Cash generation is solid on an annual basis (TTM operating CF $4.5B, FCF $2.45B) though Q1'26 FCF of $171M was seasonally soft. Balance sheet carries real leverage: total debt $11.03B vs. cash $1.45B, D/E ~0.51, EV/EBITDA 14.2x, and quick ratio only 0.74 — servicable given cash flow but sensitive to rate moves. The dislocation is not fundamental collapse but a guidance reset around WATCHMAN and electrophysiology, which the Q2 print (BSX Q2 Deep Dive: 'WATCHMAN and Electrophysiology Challenges Temper Growth Outlook') largely confirmed: 7.5% revenue beat but next-quarter guide $5.27B was 2.2% below consensus. Sell-side has trimmed the average PT to $61.41 (~10% price target cut on 7/30 to $62.96 from $70.31), yet Recom sits at 1.45 (near strong buy) with 91.6% institutional ownership — the Street still believes in the franchise; they're just modeling less near-term upside.
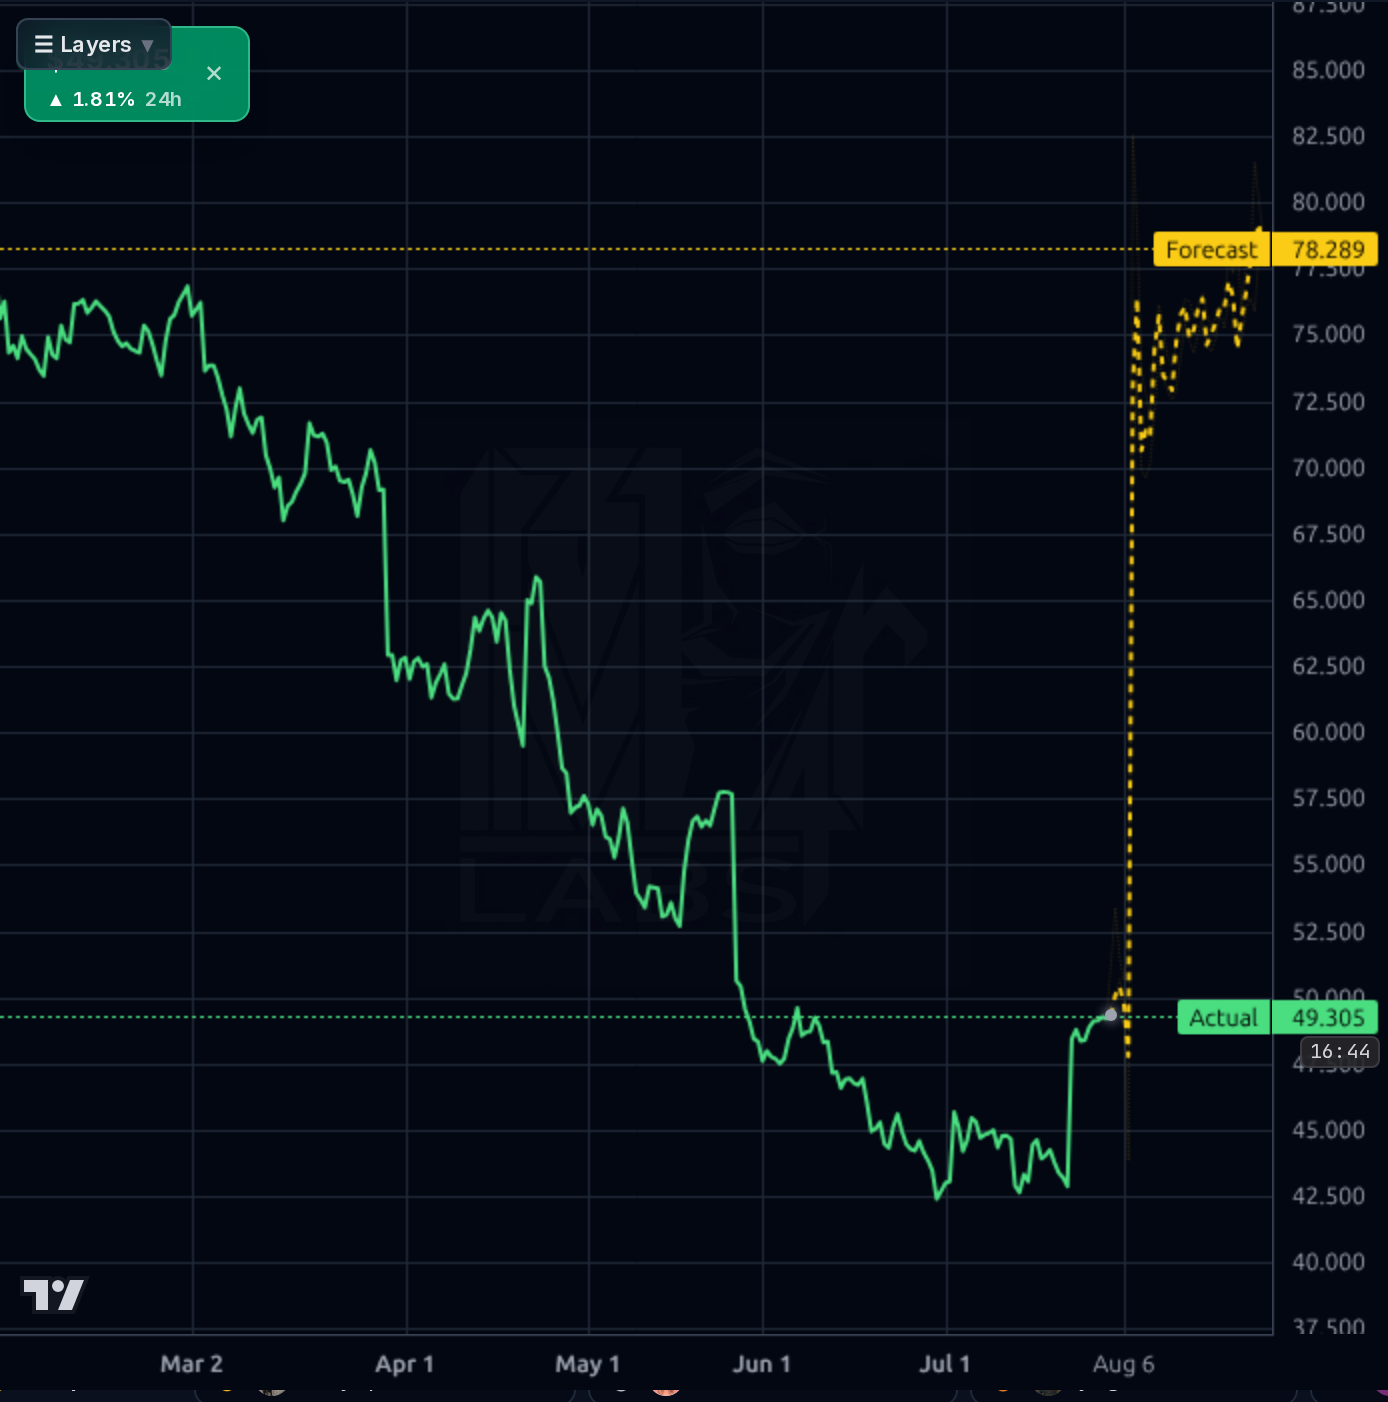
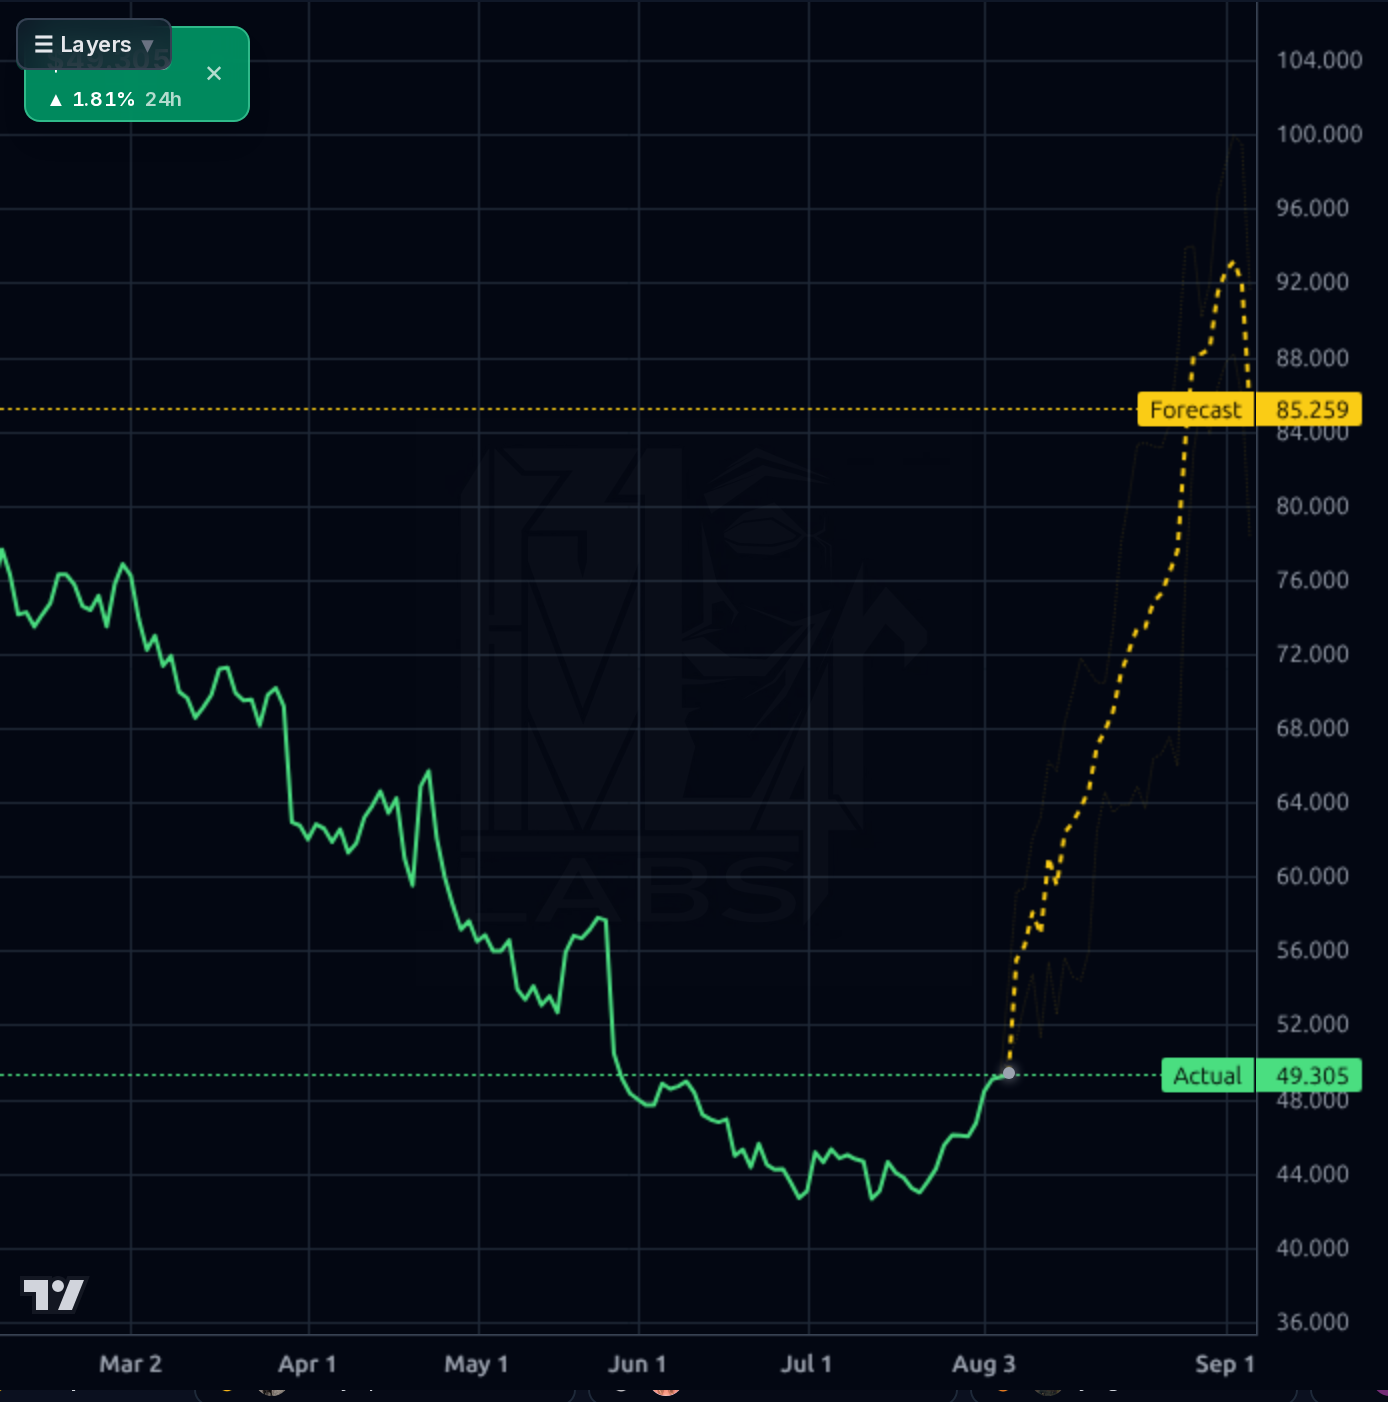
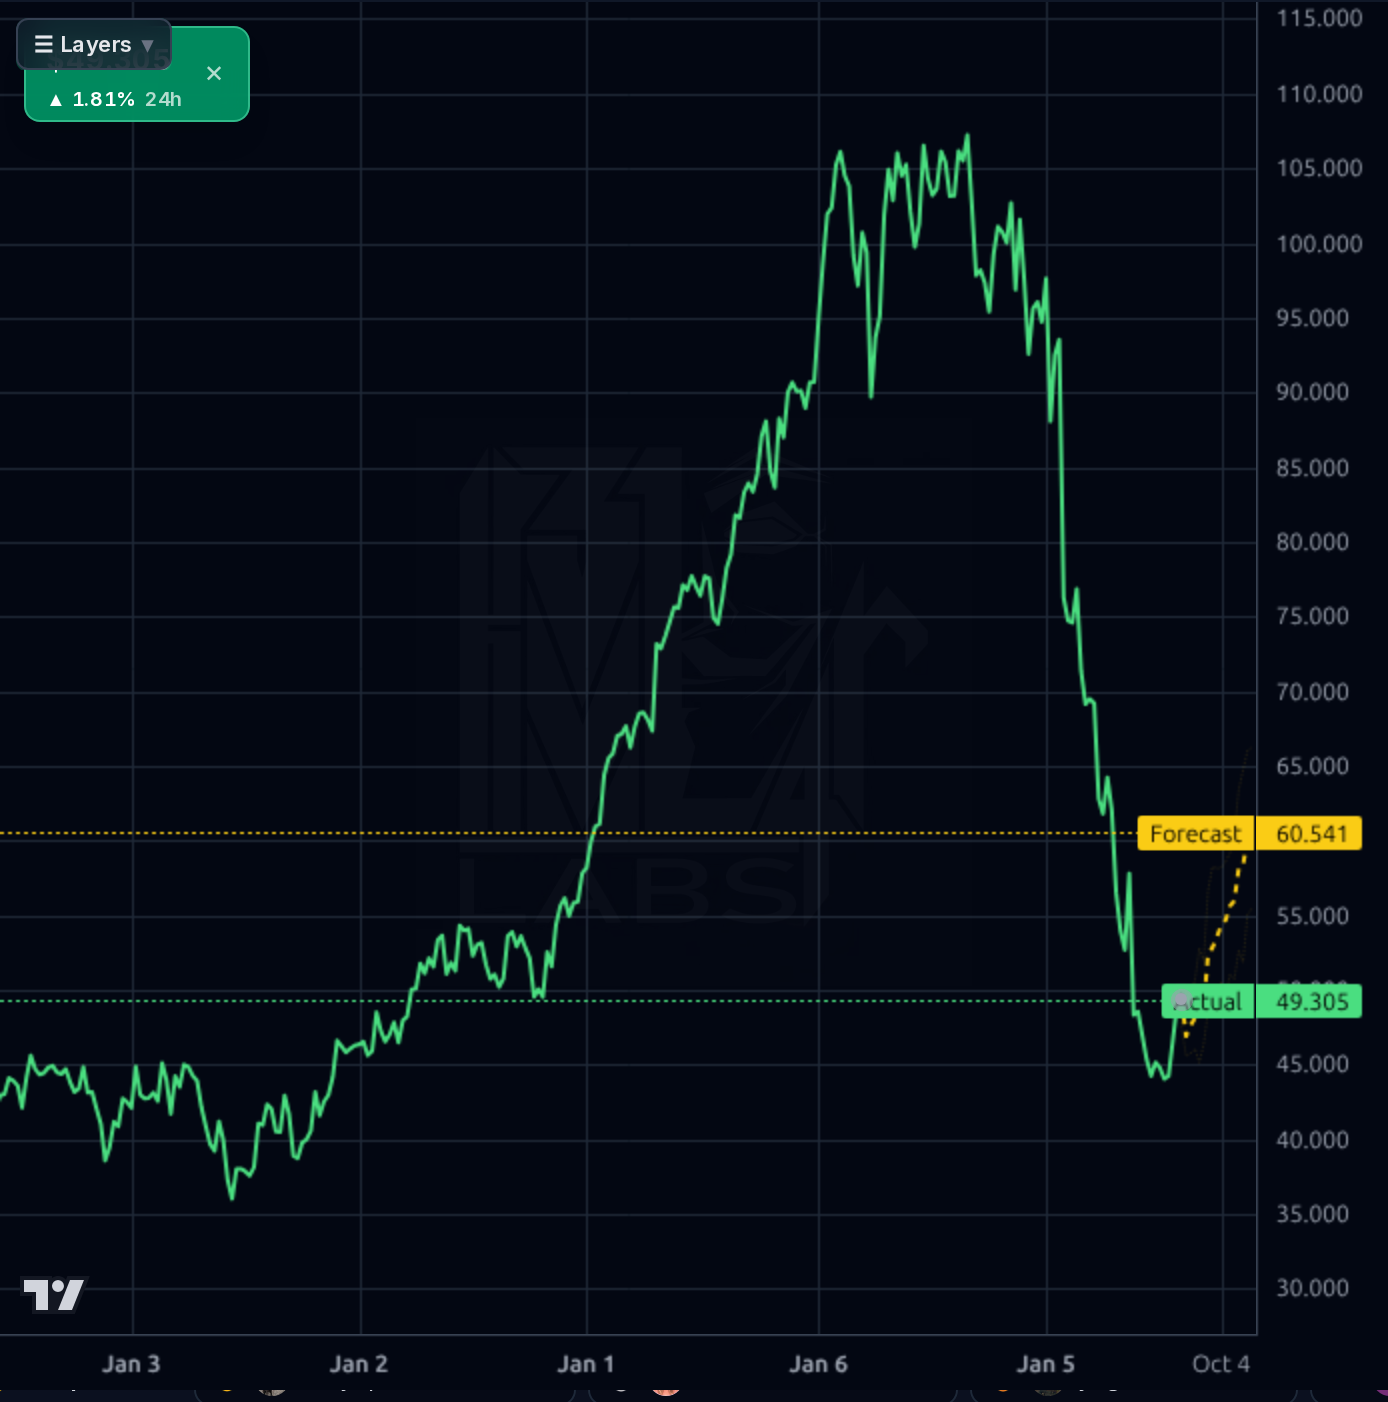
Across the four timeframes, the picture is a nascent recovery inside a broken longer-term trend. The 1h chart shows a decisive Aug 3 gap-up from ~$44 to ~$47–49 with follow-through and price now at $49.30, and the forecast band projects continuation to ~$55.4 into next week. The 4h chart makes clear how vertical this reflex has been off the ~$42 base after a March–July slide from ~$77 to ~$43. The 1d chart puts the move in context: a healthy multi-quarter rounded-base attempt with the daily forecast band projecting into the $85–92 zone — historically these long-horizon bands have been optimistic and today's realized-accuracy data confirm it (1wk directional accuracy 67% vs. 100% naive baseline — beaten by naive, discount heavily). The weekly chart shows the stock still ~55% below the $109.50 52-week high with SMA200 -32.5% below price, so this is a countertrend rally within a broken macro trend. Momentum indicators are constructive short-term (RSI 67.6, +9.2% above SMA20, +6.1% above SMA50, +10.1% Perf Month, +6.6% Perf Week) but approaching overbought. Key levels: support $46 (breakout retest) then $44 and $42.20 (52w low, invalidation); resistance $53–57 (visible gap zone flagged by retail chatter), then $60 (analyst target cluster / prior 4h swing) and $65 (early-Feb breakdown pivot).
The dominant catalyst was the 7/29 Q2 print: revenue $5.44B (+7.5% Y/Y, beat), non-GAAP EPS $0.86 (+3.8% beat), but next-quarter guide $5.27B came in 2.2% light on continued WATCHMAN and EP softness. That drove the 7/30 average price target cut from $70.31 to $62.96 (-10.4%) — a legitimate but not thesis-breaking downgrade to expectations. Separately, one healthcare-focused piece framing an analyst's 35% upside case on Abbott implicitly benchmarks large-cap medtech comps positively. A tangible bullish signal: director Edward Ludwig bought $227k of open-market stock on 7/31, right after the print — insider buying into a guide-down is a conviction signal, though the size is modest. Everything else (StockStory profitability screens, S&P500 gap lists) is context noise.
- WATCHMAN FLX next-gen launch — flagged in prior thesis and remains the single most-watched near-term revenue catalyst; Q3 commentary will be decisive
- Electrophysiology portfolio (Farapulse PFA) — cited as multi-year growth engine; Q2 print noted challenges but franchise expansion still intact
- Q1'26 net margin expansion to 25.8% (from ~15% in Q3'25) suggests operating leverage building as revenue scales past $5B/quarter
- Referenced PEM deal in social chatter — pending M&A closure could add inorganic growth optionality (unverified in filings shown)
- Sales past 3Y CAGR of 16.5% provides real top-line runway; if reaffirmed post-guide-cut, forward P/E of 14.3x becomes clearly cheap
- Continued WATCHMAN/EP guidance cuts — Q2 next-quarter guide already came 2.2% below consensus; Q3 (Oct 21) is a repeat risk
- Sell-side price target cuts (avg PT $62.96 after 10.4% cut on 7/30) signal the Street is still trimming expectations
- Leverage: $11.03B total debt, D/E 0.51, quick ratio 0.74 — servicable but sensitive to rate environment; EV $85B vs. market cap $73B
- Technical: still -32.5% below SMA200 and -55% off 52w high; this is a countertrend bounce inside a broken longer-term trend
- Forecast model reliability weak on 1wk horizon (67% directional accuracy, beaten by naive baseline) — don't trust the bullish AI band uncritically
- Competitive risk in electrophysiology from Medtronic and J&J PFA platforms — could permanently cap the growth re-acceleration story
- Historical calibration: prior base targets on this name have averaged +21% above realized price — I'm intentionally setting a tighter base
Get AI analysis on any stock
This is one of hundreds of Kronos AI reports — scored fundamentals & technicals, bull/base/bear price targets, a multi-horizon plan, and continuously-updated forecasts across the market. Create a free account to explore them all.
Create your free account →Already a member? Sign in · Join our Discord