CELH — AI Stock Forecast & Price Targets
Published 8/6/2026 · A free sample of K3vl4r’s AI-powered analysis.
Kronos price forecasts, scored fundamentals & technicals, and a multi-horizon plan.
View the live CELH price forecast →
CELH just gapped down ~17.9% on Aug 6 Q2 earnings, breaking the $26.54 52-week low and printing $24.32 — a clear negative reaction that invalidates the pre-print coil/HOLD thesis and confirms the bear risk of margin/organic-growth disappointment. At ~12x forward EPS the valuation is finally reasonable, but the tape is telling us estimates and multiple both need to reset lower before this becomes a buy. This is a HOLD-leaning-TRIM until price stabilizes and management commentary is digested.
Do NOT catch the falling knife on day one. HOLD if already long; if flat, wait 2-3 sessions for the post-earnings reaction to settle and read the transcript for gross margin trajectory and guidance. Key levels: $22-24 is the next real support zone (structural base from early 2023); reclaim of $26.50 with volume would be the first sign the flush is done. Invalidation for any tactical long attempt is a close below $22. Any 1-4 week trade is now post-earnings mean-reversion — size small (0.5-1% risk) and only after a base forms.
1-6 month view is genuinely uncertain and depends entirely on the Q2 detail: if gross margin held above 48% and management reiterated the FY revenue trajectory, this is a bombed-out GARP setup at 12x forward with a base target of $28-30 (gap fill). If GM broke below 48% or guidance was cut, forward EPS resets toward $1.60-1.75 and fair value drops to $22-25. Catalysts: Q3 print (early Nov), any Pepsi DSD commentary at investor conferences, category share data from Nielsen/Circana. Change my mind bullish: GM stabilization + core CELSIUS organic reacceleration. Change my mind bearish: further GM erosion or Alani Nu deceleration.
1-3 year terminal thesis rests on CELH becoming the #3 US energy platform behind Red Bull/Monster via the Pepsi DSD moat and multi-brand portfolio (CELSIUS / Alani Nu / Rockstar). If the company can hold 20%+ operating margin and grow revenue mid-teens organically off the enlarged base, $1.97 forward EPS becomes $3+ by 2028 and a re-rate to 20-25x supports $60-75 — consistent with the $63.89 analyst consensus target. Biggest structural risk is single-partner distribution dependency on PepsiCo (~59% of NA sales) combined with the fact that acquisition-driven growth masks organic deceleration in the flagship brand. Aluminum inflation and category saturation are secondary concerns.
The pre-print business was reaccelerating hard: Q1 2026 revenue $782.6M (+137.7% YoY driven by Alani Nu/Rockstar in Pepsi DSD), operating margin 18.3%, EBITDA $158.5M vs -$61M in Q3 2025, and $549M cash against $669M debt (net debt just ~$120M) with $65.8M Q1 FCF. Gross margin, however, compressed from 51.5% (Q2'25) to 48.3% in Q1'26 — the structural mix-dilution concern. Trailing P/E 65-70x is nonsense; the honest lens is 15x forward on $1.97 EPS, which becomes ~12x at today's $24.32 print — attractive IF that EPS estimate holds. The 17.9% post-print drop strongly implies either a revenue miss vs the $872M consensus, gross margin below the 48.3% floor, weak organic core-CELSIUS trends, or soft guidance. Balance sheet still solid, but the equity story hinges on gross-margin trajectory and whether Alani Nu growth is organic sell-through or channel-fill — and today's tape says the market just voted skeptically.
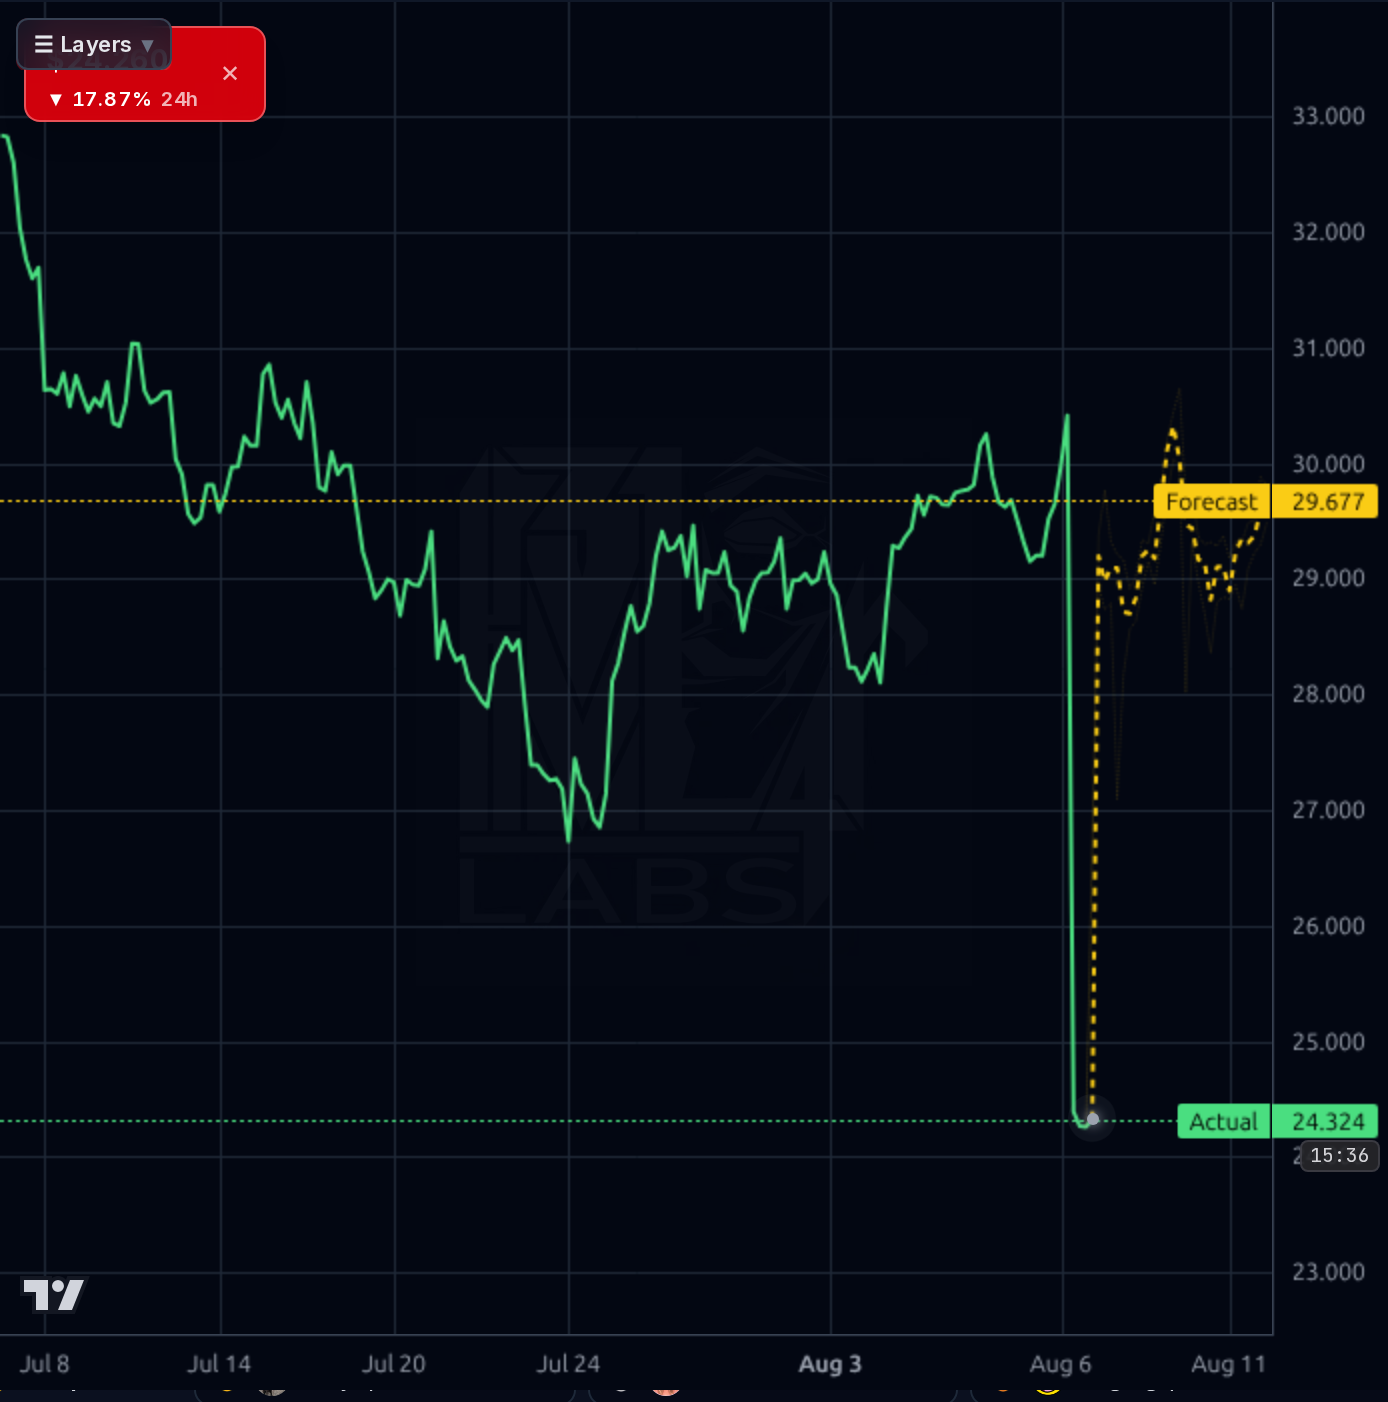
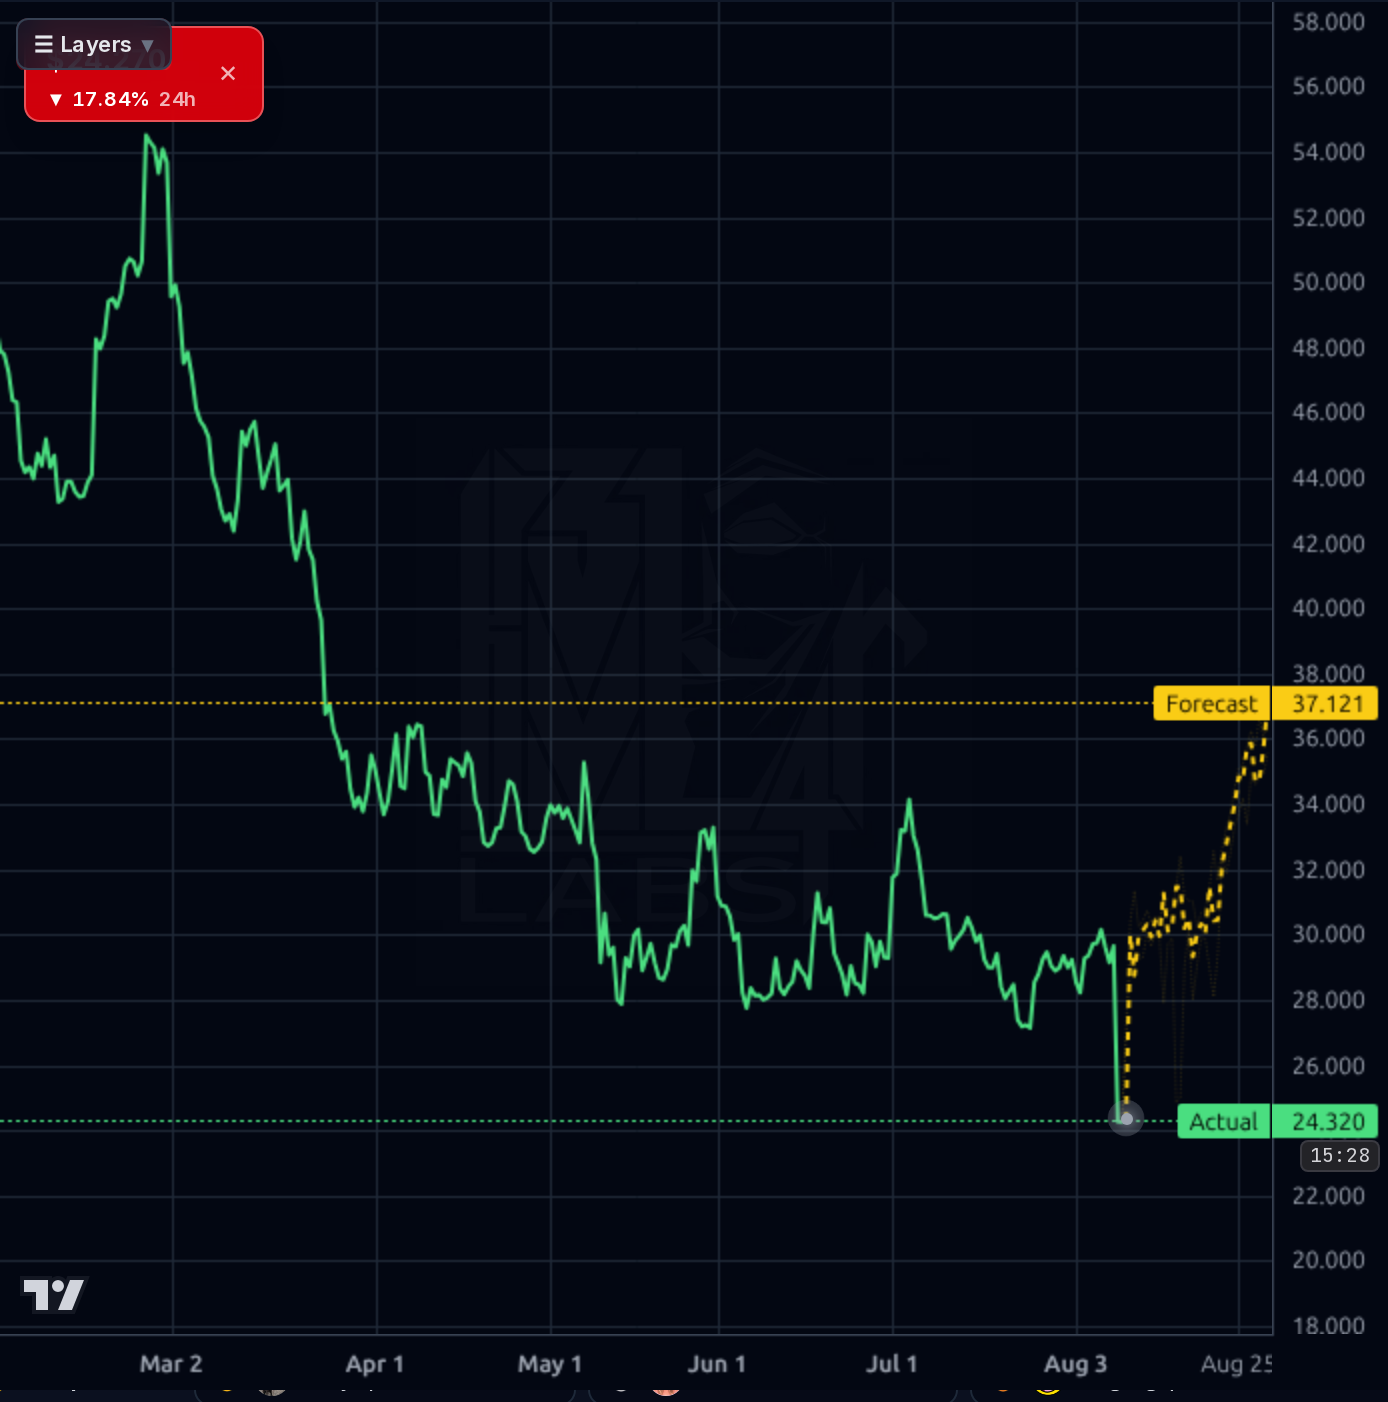
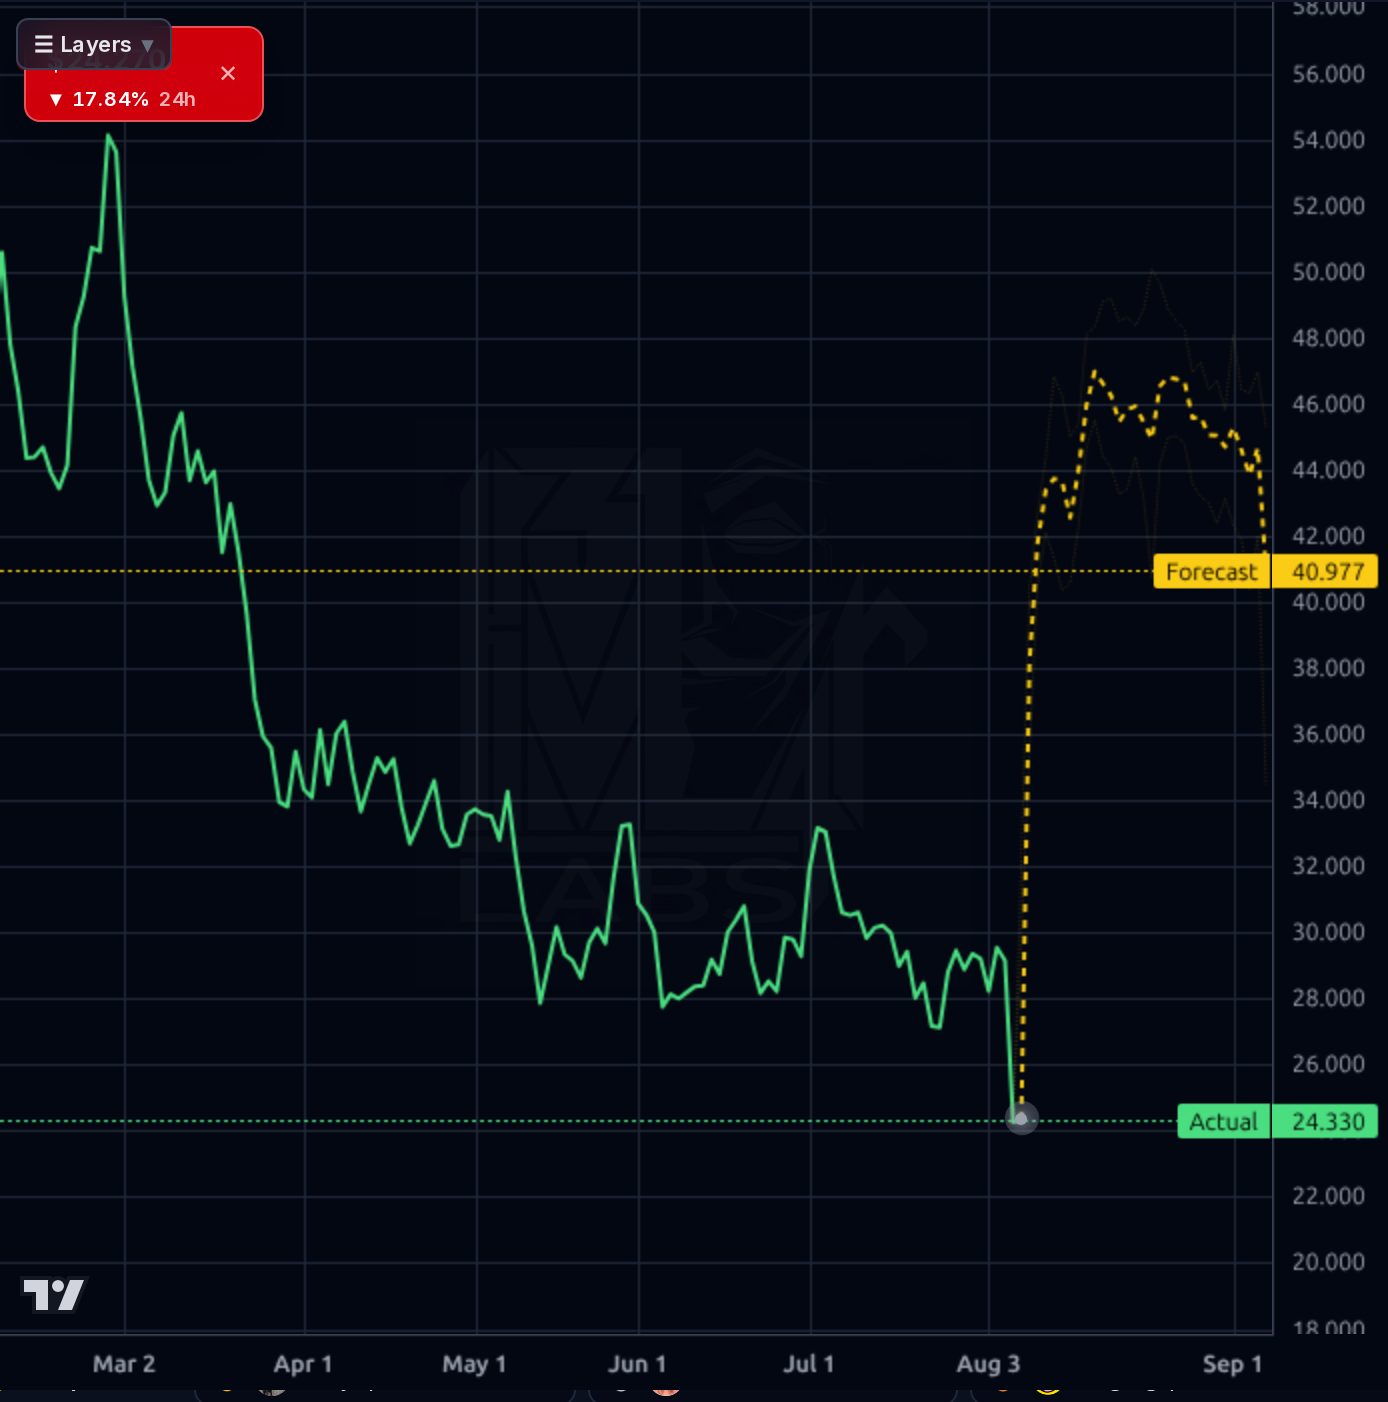
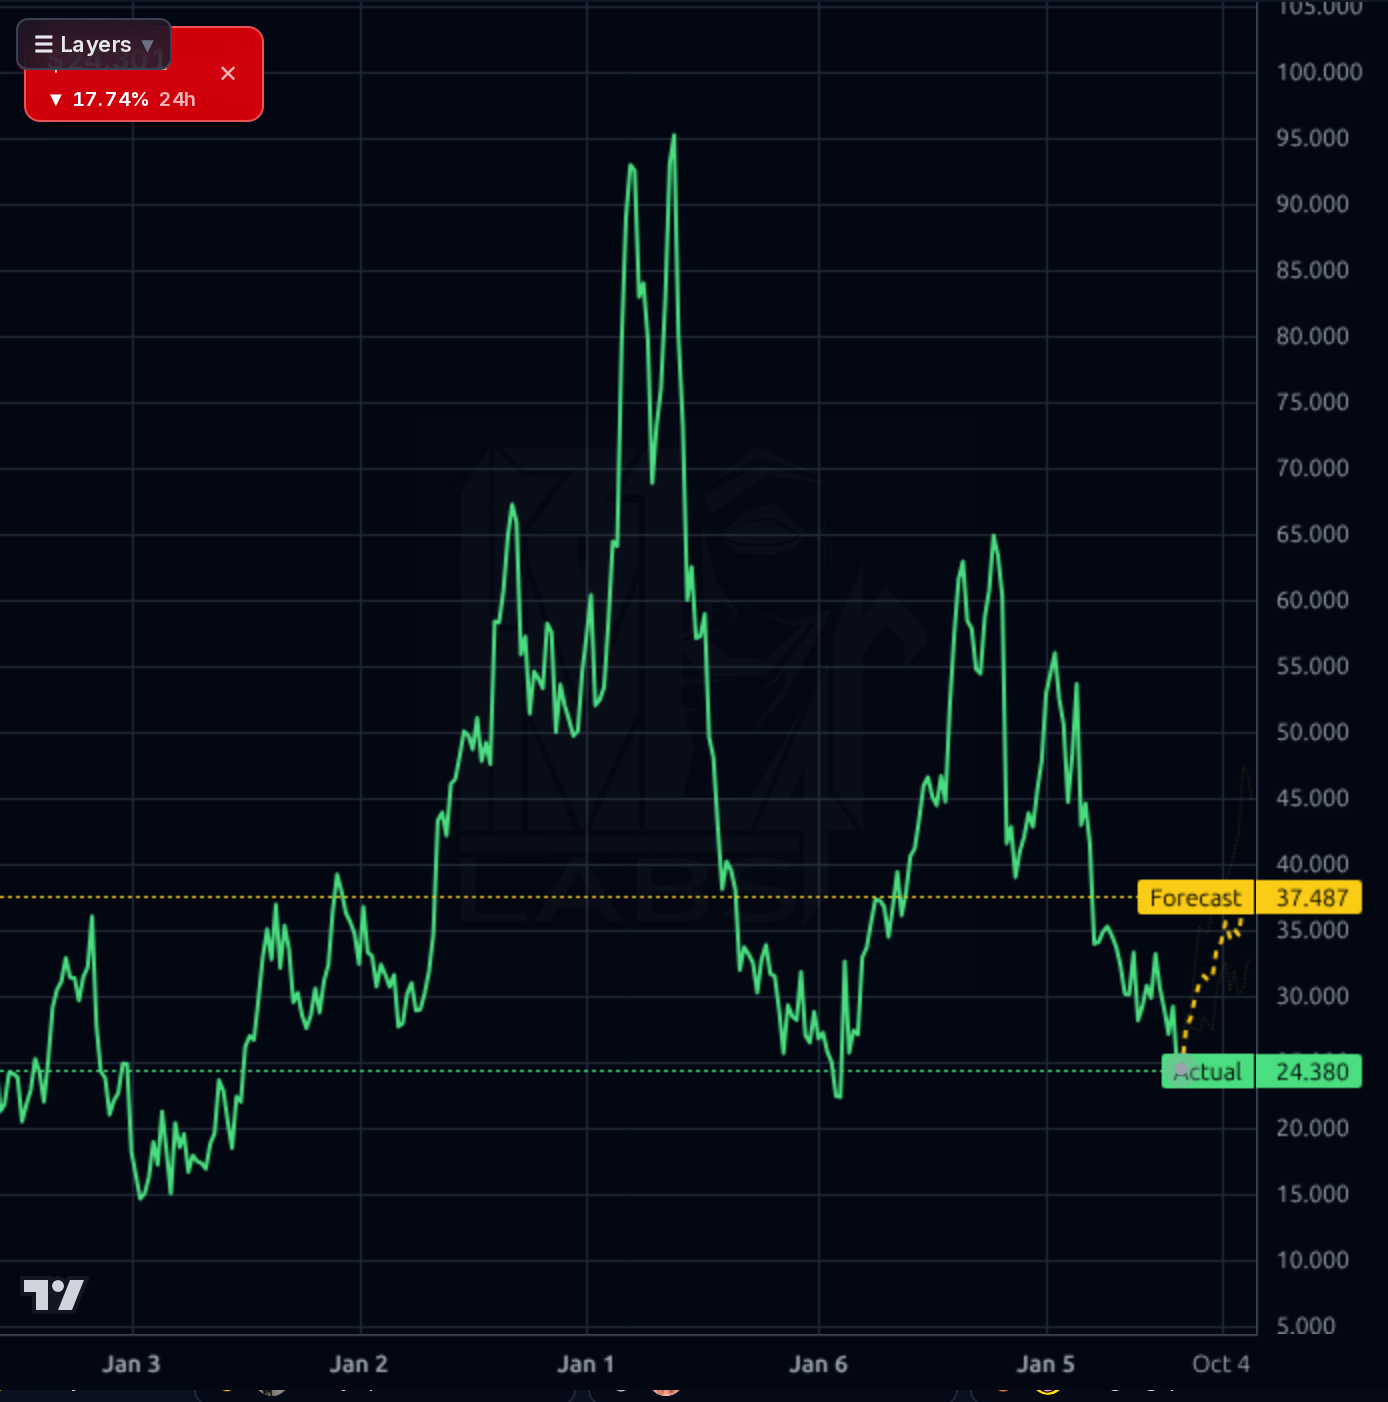
Across timeframes the picture is decisively broken: the 1h and 4h charts show a violent gap from ~$29.50 straight to $24.32, blowing through the $26.54 52-week low that had been the multi-month floor. The daily chart shows CELH was already 27.85% below its 200-day SMA and has now taken out horizontal support at $26.50-$27.00 that had held since April. Weekly chart shows we're re-testing the deeper base zone from early 2023. The AI forecast band is completely stale — it projected $29-30 on 1h and $37-41 on 1d against a realized $24.32; the model's directional accuracy on this name is 25% vs a 75% naive baseline, so the yellow lines should be ignored. RSI was ~49 pre-print; will be oversold intraday. Next real support is the $22-24 zone (Q1 2023 base); resistance is now the broken $26.50 shelf and then $28-29 gap-fill.
The dominant signal is the 8-K filed Aug 6 (Items 2.02/7.01) announcing Q2 2026 results and the accompanying ~17.9% price collapse — the market's verdict that either the print or the guide fell short of the $872M revenue / $0.42-0.43 EPS consensus, or that gross margin/organic trends disappointed. Secondary context: an insider buying blitz (~$716K) around Q1 was a bullish signal that has now been overwhelmed; the July 15 refinancing 8-K is minor housekeeping. Peer read: SUJA reported +11.6% Q2 sales growth, showing the functional beverage category is still growing but decelerating — not helpful for a name priced for hypergrowth. Retail sentiment (Stocktwits 100% bullish) is a mild contrarian negative into a broken tape. TV mentions are all product-buzz noise, not thesis-relevant.
- Alani Nu integration into PepsiCo DSD driving shelf-space wins and route-to-market leverage — the largest 2026 revenue driver
- Rockstar brand refresh under the CELH portfolio umbrella, though Q1 commentary flagged Rockstar weakness that must reverse
- International/European expansion, still early-stage and margin-dilutive but a multi-year TAM lever
- CELSIUS ESSENTIALS (200mg caffeine SKU) getting explicit shelf pull-through mentions on financial TV — new product cycle
- Hydration line (zero-sugar powders/sticks) diversifying beyond RTD energy into adjacent functional categories
- Q2 print already triggered a 17.9% gap down — estimate cuts and multiple compression likely follow in coming days
- Gross margin compression from 51.5% to 48.3% signals structural mix dilution; further erosion collapses the bull case
- PepsiCo concentration risk (~59% of NA sales) with channel-fill vs true sell-through ambiguity
- 21.2% short float creates two-way violence — squeezes on good news, cascades on bad news like today
- $26.54 52-week support just broke, exposing the $22-24 structural base as the next test
- Trailing P/E remains 65x even after the drop; the market is still pricing hypergrowth that just got questioned
- Q2 EPS consensus already implied a 10.6% YoY decline — a miss vs a low bar is particularly damaging
Get AI analysis on any stock
This is one of hundreds of Kronos AI reports — scored fundamentals & technicals, bull/base/bear price targets, a multi-horizon plan, and continuously-updated forecasts across the market. Create a free account to explore them all.
Create your free account →Already a member? Sign in · Join our Discord