CLNE — AI Stock Forecast & Price Targets
Published 8/12/2026 · A free sample of K3vl4r’s AI-powered analysis.
Kronos price forecasts, scored fundamentals & technicals, and a multi-horizon plan.
View the live CLNE price forecast →
CLNE is a deeply oversold, structurally unprofitable RNG/CNG fuel provider trading at multi-year lows near $1.61 with meaningful CEO insider buying at $1.62 and $1.77, but negative TTM margins (-21%), $323M debt vs $57M cash, and a Reduce analyst consensus keep this a speculative bounce trade rather than an investable thesis. The AI forecast band is aggressively bullish across all timeframes but has been beaten by naive baselines (26% 1d directional accuracy vs 90% naive), so the setup warrants a small tactical long only, not conviction accumulation.
Tactical: a small long is defensible here given the oversold flush, climactic-looking volume, CEO buying at $1.62, and price now $1.61. Entry $1.58–1.65, hard stop below $1.53 (below the $1.56 52-week low and CEO cost basis). First target $1.80–1.85 (gap fill / SMA20 reclaim), second target $2.00. Size at 25-40% of a normal position — this is a bounce trade, not an investment. Invalidation: daily close below $1.53 or a break of the CEO's $1.62 cost basis on rising volume.
Over 1-6 months the setup depends entirely on whether Q3 (reporting Nov 4) confirms Q2's $24M FCF print or reverts to burning cash. If Q3 FCF is positive and gross margin holds ≥18%, the stock can re-rate toward $2.20–2.40 (~35-45% upside). If Q3 shows the FCF was a working-capital fluke, expect a retest of $1.35–1.50 and dilution risk becomes real. Neutral bias; I would not add above $1.85 without margin evidence. Change-my-mind data: two consecutive quarters of positive OCF AND management addressing the debt maturity ladder concretely.
The 1-3 year terminal thesis rests on whether RNG dairy/livestock waste projects and LCFS/RIN credit economics can produce sustainable positive operating margins at scale. Structural drivers exist (heavy-duty transport decarbonization, secured Puerto Rico LNG contract, Tourmaline CNG expansion), but the industry track record of translating volumes into GAAP profits is weak, and $323M of debt against $14M EBITDA leaves little margin for error. Biggest structural risk is a refinancing or equity raise at depressed prices, which would likely cap upside even if operations improve. Long-term rating: speculative watchlist, not a core holding.
Revenue is growing modestly — Q2 2026 came in at $106.4M (+3.7% YoY) and Q1 at $117.6M, but margin quality is poor: Q2 gross margin was 18.3% (down from ~28% TTM prints), operating margin -4.8%, and net margin -14.0%. TTM net margin is -21.3% and ROE -16.5%. The balance sheet is the crux of the bear case: $57M cash against $322.6M total debt (D/E ~0.58, LT Debt/Eq 0.56) with EBITDA of only $13.9M TTM implying EV/EBITDA of ~35x — a stretched multiple for a business burning cash. That said, Q2 delivered a genuinely bright spot: operating cash flow of $28.8M and free cash flow of $24.2M, a sharp reversal from Q1's -$8.4M OCF/-$15.4M FCF. Whether that's a one-quarter working-capital swing or the start of true inflection is the single most important question, and one quarter is not enough. P/B of 0.68 and P/S of 0.85 look optically cheap, but as prior calls on this name have consistently shown, cheap multiples here reflect broken profitability, not arbitrage.
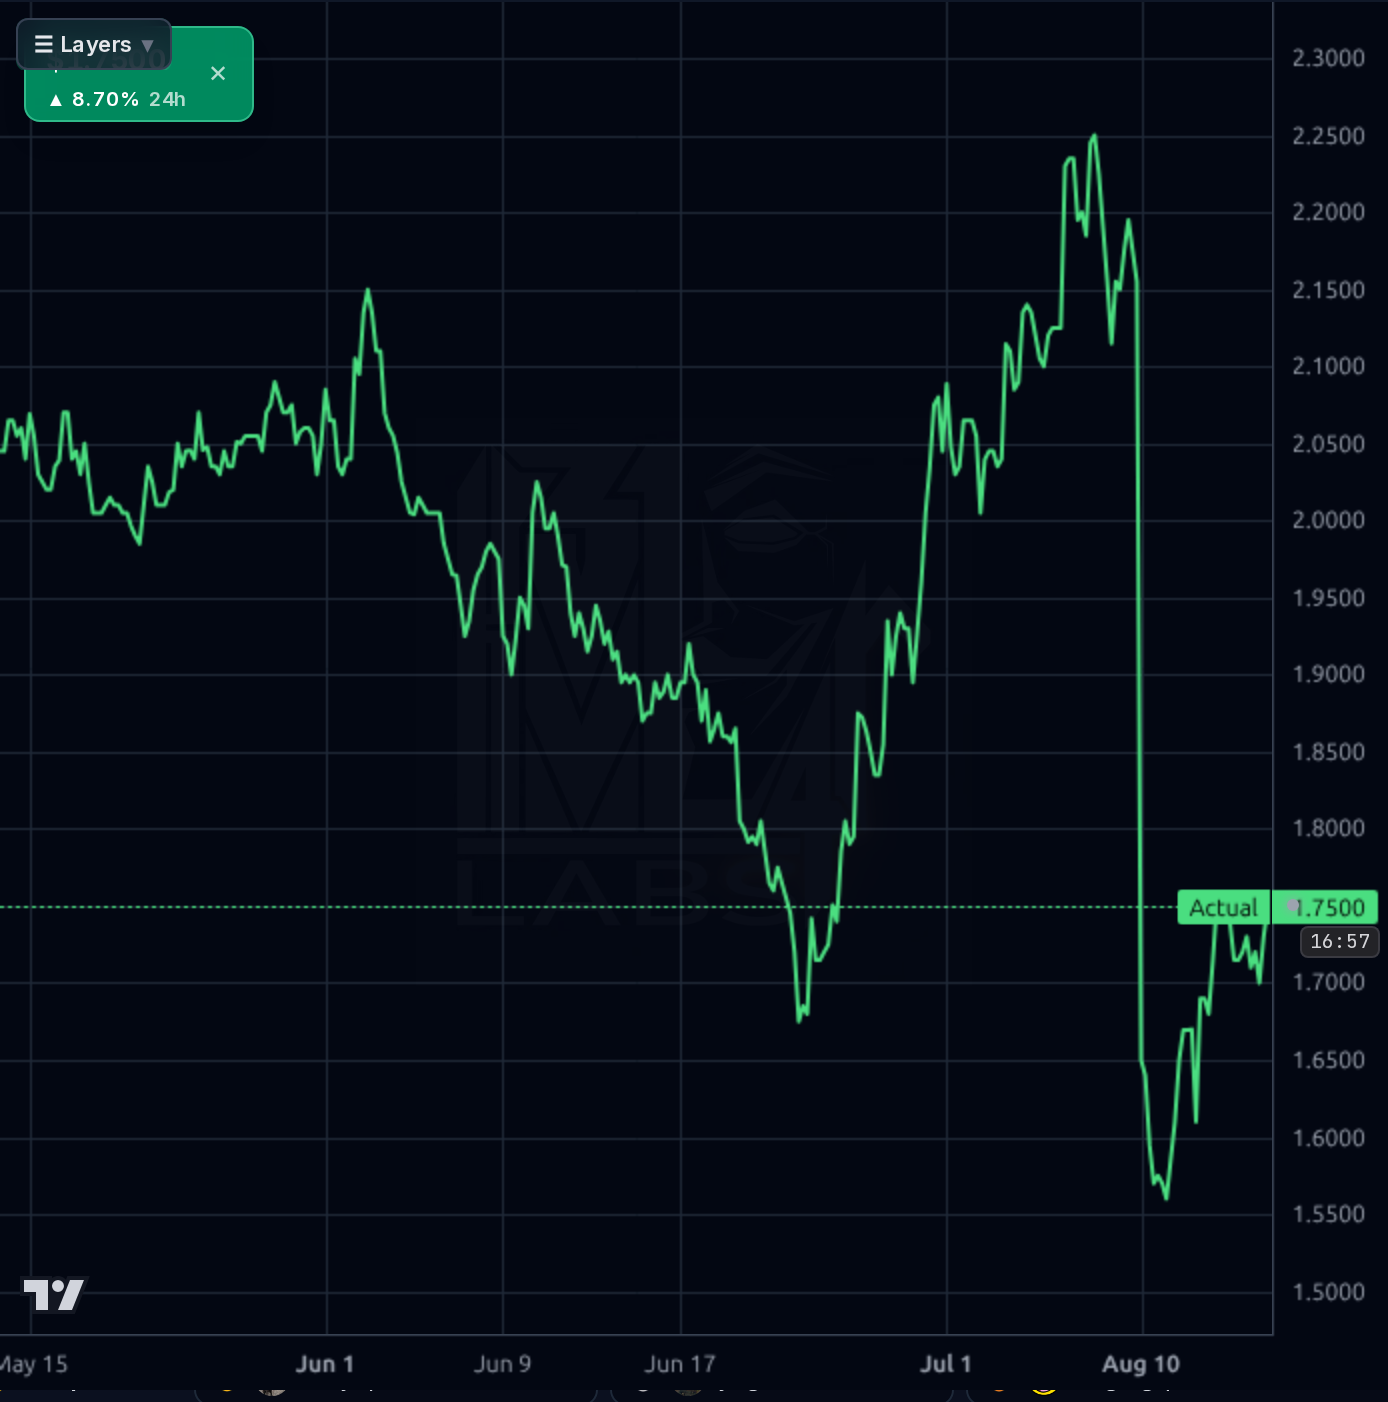
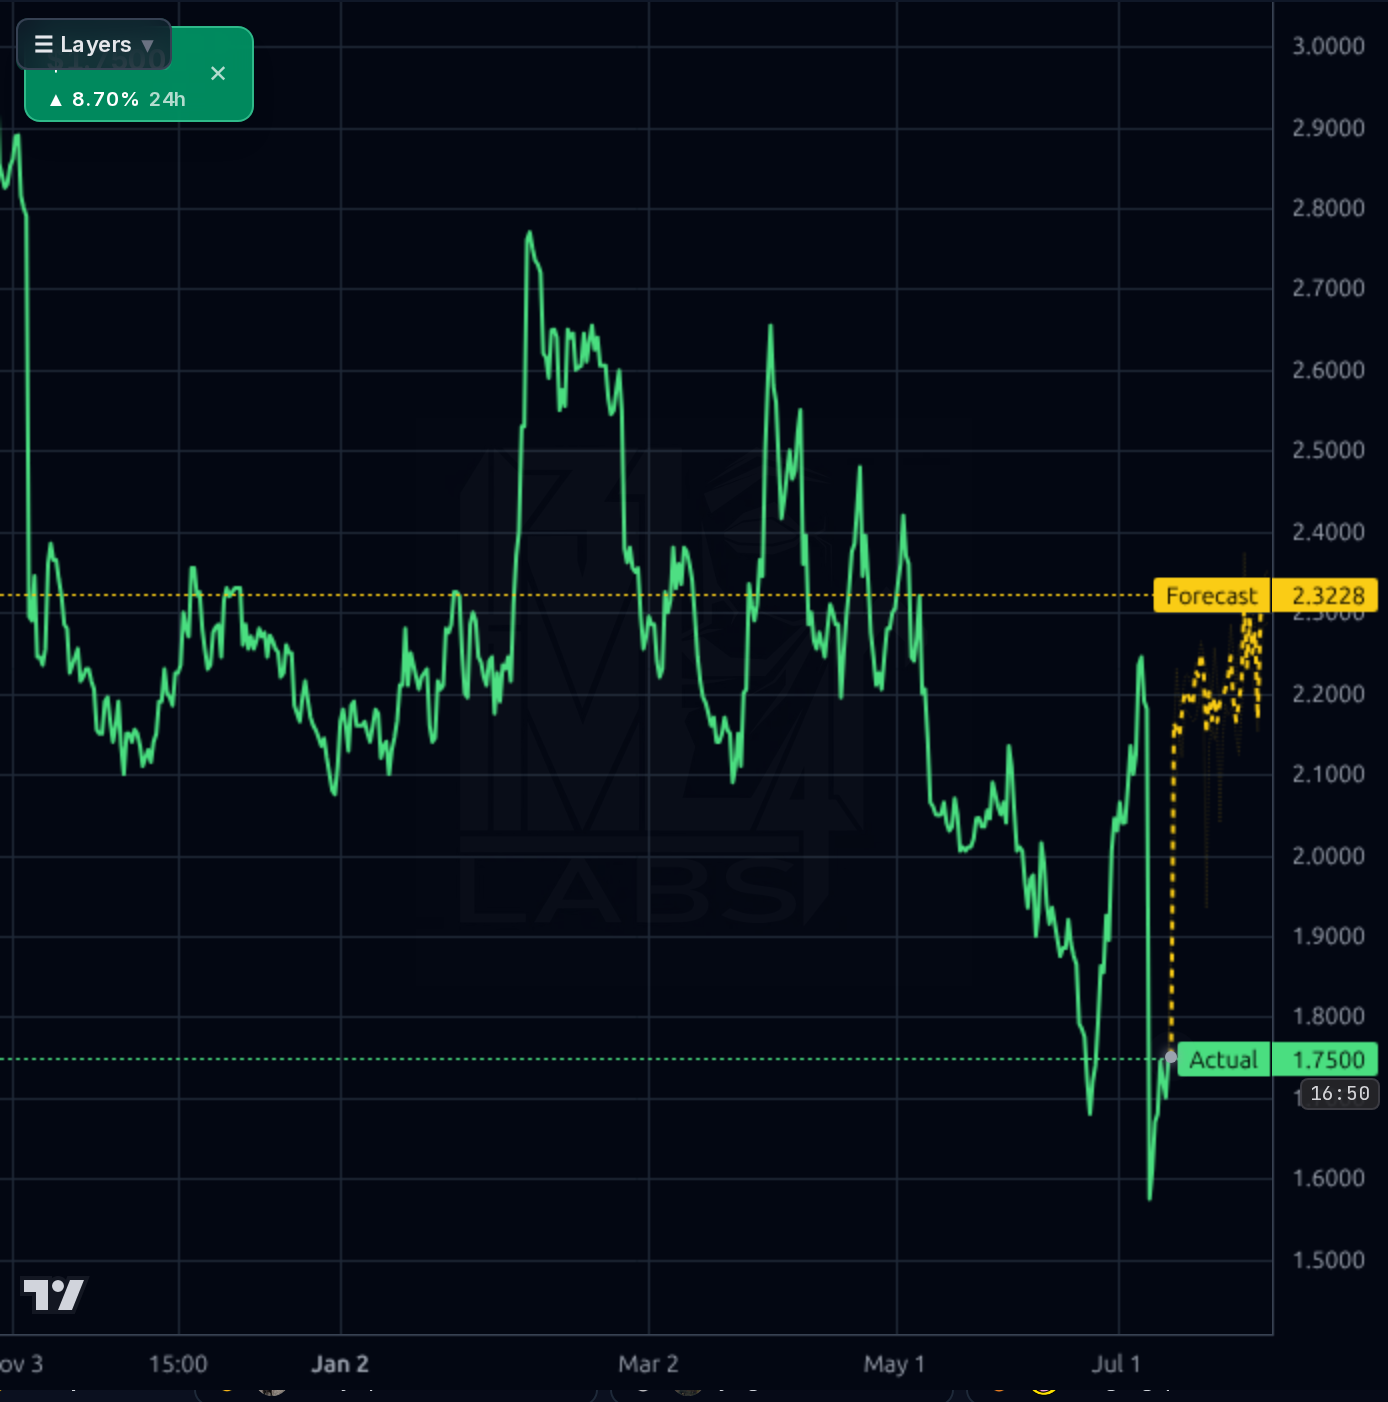
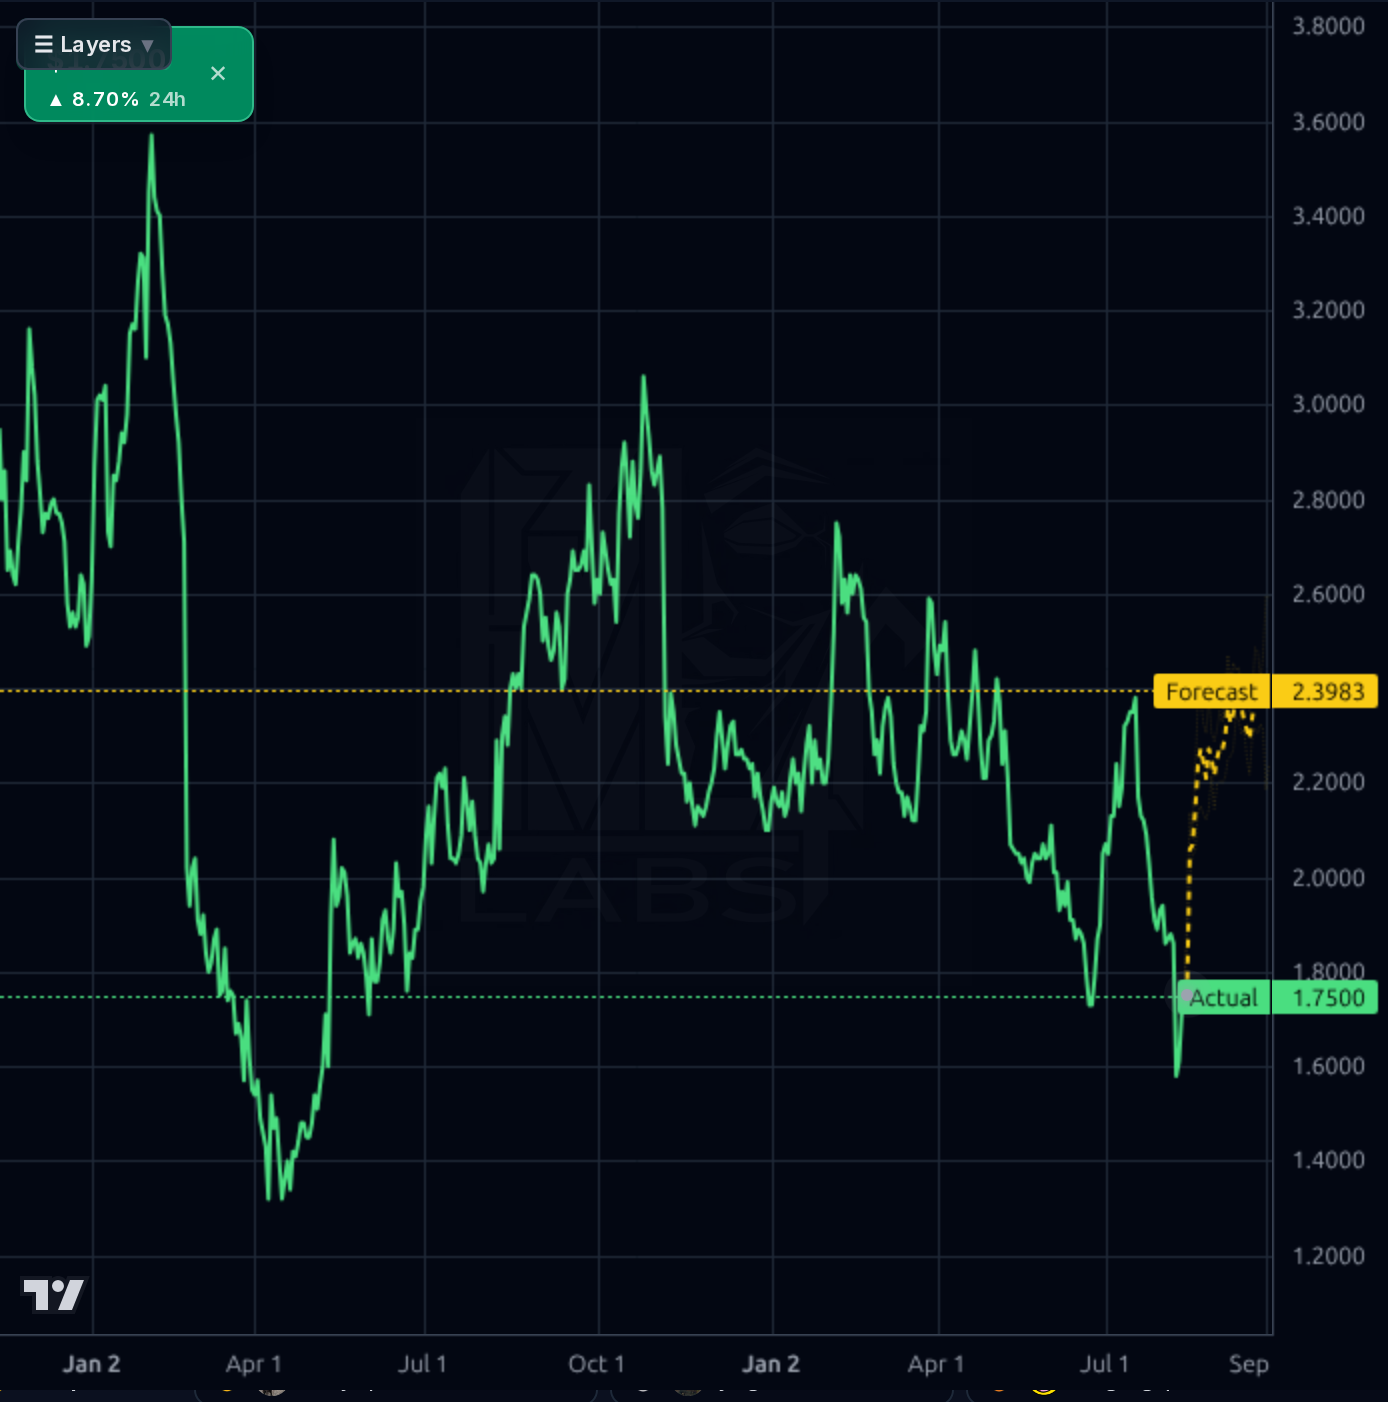
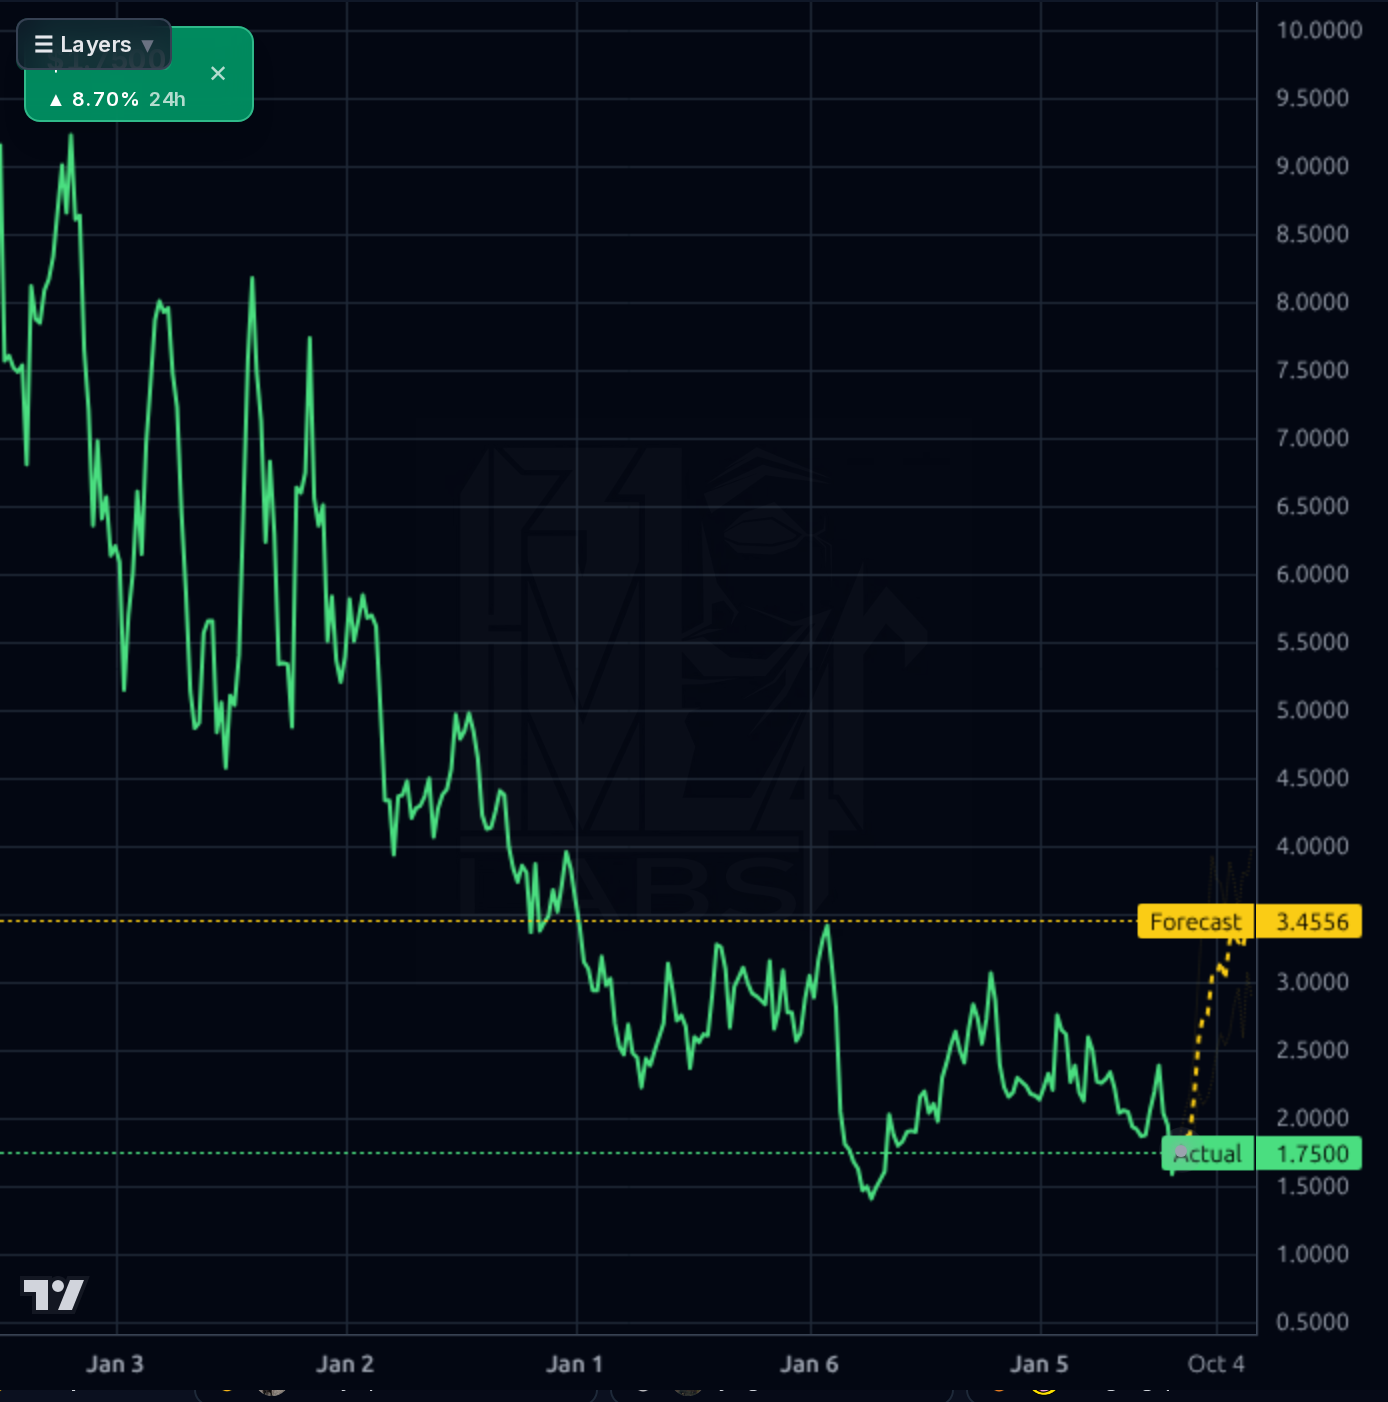
Across all three timeframes the tape is clearly damaged. The 1h chart shows a violent gap-down from ~$2.15 to ~$1.57 on the Q2 print with a partial recovery to $1.75. The 4h and 1d charts confirm price is at the 15th percentile of range, RSI 35.8, -13.7% below SMA20, -14.0% below SMA50, and -23.3% below SMA200 — a full-blown downtrend, not a mere pullback. Support sits at the recent $1.56–1.57 low (also the 52-week low); resistance stacks at $1.85 (gap fill zone), then $2.00–2.05 (prior consolidation), then $2.15–2.25. The AI forecast band is uniformly bullish (1d/1wk/1d target ~$2.32–$2.40, monthly $3.46) but the model's directional accuracy of 26% at 1d vs a 90% naive baseline is a red flag — this forecast has been systematically wrong in this regime and needs to be discounted heavily. The one genuine positive is that the flush appears climactic (2.11x relative volume, +6.2% intraday reversal off the low), which often marks tradeable short-term bottoms even in downtrends.
The signal in the news is the CEO's open-market buying: Barclay Corbus bought 25,000 shares at $1.62 on Aug 10 (~$41k), following a 14,000-share buy at $1.77 on June 24. Repeat, open-market CEO purchases at fresh lows are a meaningful conviction signal, though small in dollar terms relative to a $377M market cap. Q2 earnings on Aug 6 were the dominant catalyst — revenue of $106.4M beat one consensus by 2.6% but missed another by 6.8% depending on source, and the stock dropped ~15% into the print, indicating the market focused on the miss and continued cash burn narrative rather than the FCF improvement. Noise to filter: the TotalEnergies Form 144 is a historical restricted-stock filing rather than a fresh divestment signal, and the retail sentiment (63% bullish) is elevated but low-volume. Analyst consensus remains Reduce with a $4.65 price target that was just cut 8.5% from $5.08 — the direction of estimate revisions is negative even as the absolute target looks high.
- Puerto Rico LNG infrastructure contract providing visible, contracted revenue over multiple years
- Western Canada CNG station buildout with Tourmaline offering incremental demand visibility
- Dairy/livestock waste RNG projects — highest-margin segment and clearest path to gross margin expansion
- LCFS/RIN credit pricing tailwind provides direct EBITDA leverage with negligible variable costs
- Q2 2026 delivered $24.2M FCF and $28.8M operating cash flow — first sign of possible inflection if repeatable
- $322.6M total debt vs $57M cash and only $13.9M TTM EBITDA — refinancing/dilution risk is real
- Analyst consensus is Reduce and price target was just cut from $5.08 to $4.65 (-8.5%)
- Forward EPS estimate revisions went from +864% to +98% (L3 bearish signal) — earnings power expectations collapsing
- AI forecast model has 26% directional accuracy at 1d vs 90% naive baseline — bullish signal unreliable in current regime
- Q2 revenue miss triggered ~15% drawdown; Nov 4 earnings carries similar tail risk
- TTM net margin of -21% and 4 consecutive quarters of operating losses — no clear inflection track record
- Micro-cap liquidity risk and thin analyst coverage (only 2 analysts) mean volatility remains elevated
Get AI analysis on any stock
This is one of hundreds of Kronos AI reports — scored fundamentals & technicals, bull/base/bear price targets, a multi-horizon plan, and continuously-updated forecasts across the market. Create a free account to explore them all.
Create your free account →Already a member? Sign in · Join our Discord