CLNE — AI Stock Forecast & Price Targets
Published 8/10/2026 · A free sample of K3vl4r’s AI-powered analysis.
Kronos price forecasts, scored fundamentals & technicals, and a multi-horizon plan.
View the live CLNE price forecast →
CLNE remains fundamentally challenged by persistent negative margins (-21% TTM) and significant debt overhang ($323M vs $57M cash), despite Q2 revenue beat of 3.7% YoY to $106.4M. Technicals show a breakdown below key support at $1.57 with AI forecasts suggesting mean-reversion but sub-baseline accuracy, while the market regime indicates risk dial neutral with no immediate catalyst for structural improvement.
Hold below $1.60; if price breaks above $1.60 with volume, consider a small position (1-2% of portfolio). Invalidation is a drop below $1.57, which would signal further downside to the 52-week low.
Wait for evidence of margin inflection—positive operating margins in Q3 or sustained FCF growth. Current base target ($1.70) is +8% from live price; if Q3 cash balance exceeds $24M and LCFS/RIN credits stabilize, consider a small accumulation at $1.65-1.70.
Long-term viability depends on achieving positive operating margins through RNG projects or regulatory tailwinds. The biggest structural risk is debt maturity forcing dilution without margin expansion; if the company fails to turn around cash burn by 2027, the stock faces significant downside risk.
Revenue grew 3.7% YoY to $106.4M in Q2, but net margins remain deeply negative at -21.27% TTM due to high debt ($323M) and cash burn. Operating margins are also negative (-4.82%), with FCF turning positive only recently at $24.17M (Q2). The balance sheet shows a debt-to-equity ratio of 57.74%, indicating severe leverage, while the company's P/B is 0.63 and EV/Sales is 1.21—both reflecting poor profitability rather than value. Recent news highlights revenue misses on earnings day (-15.3% drop) despite positive contract wins, underscoring that operational improvements are insufficient without margin inflection.
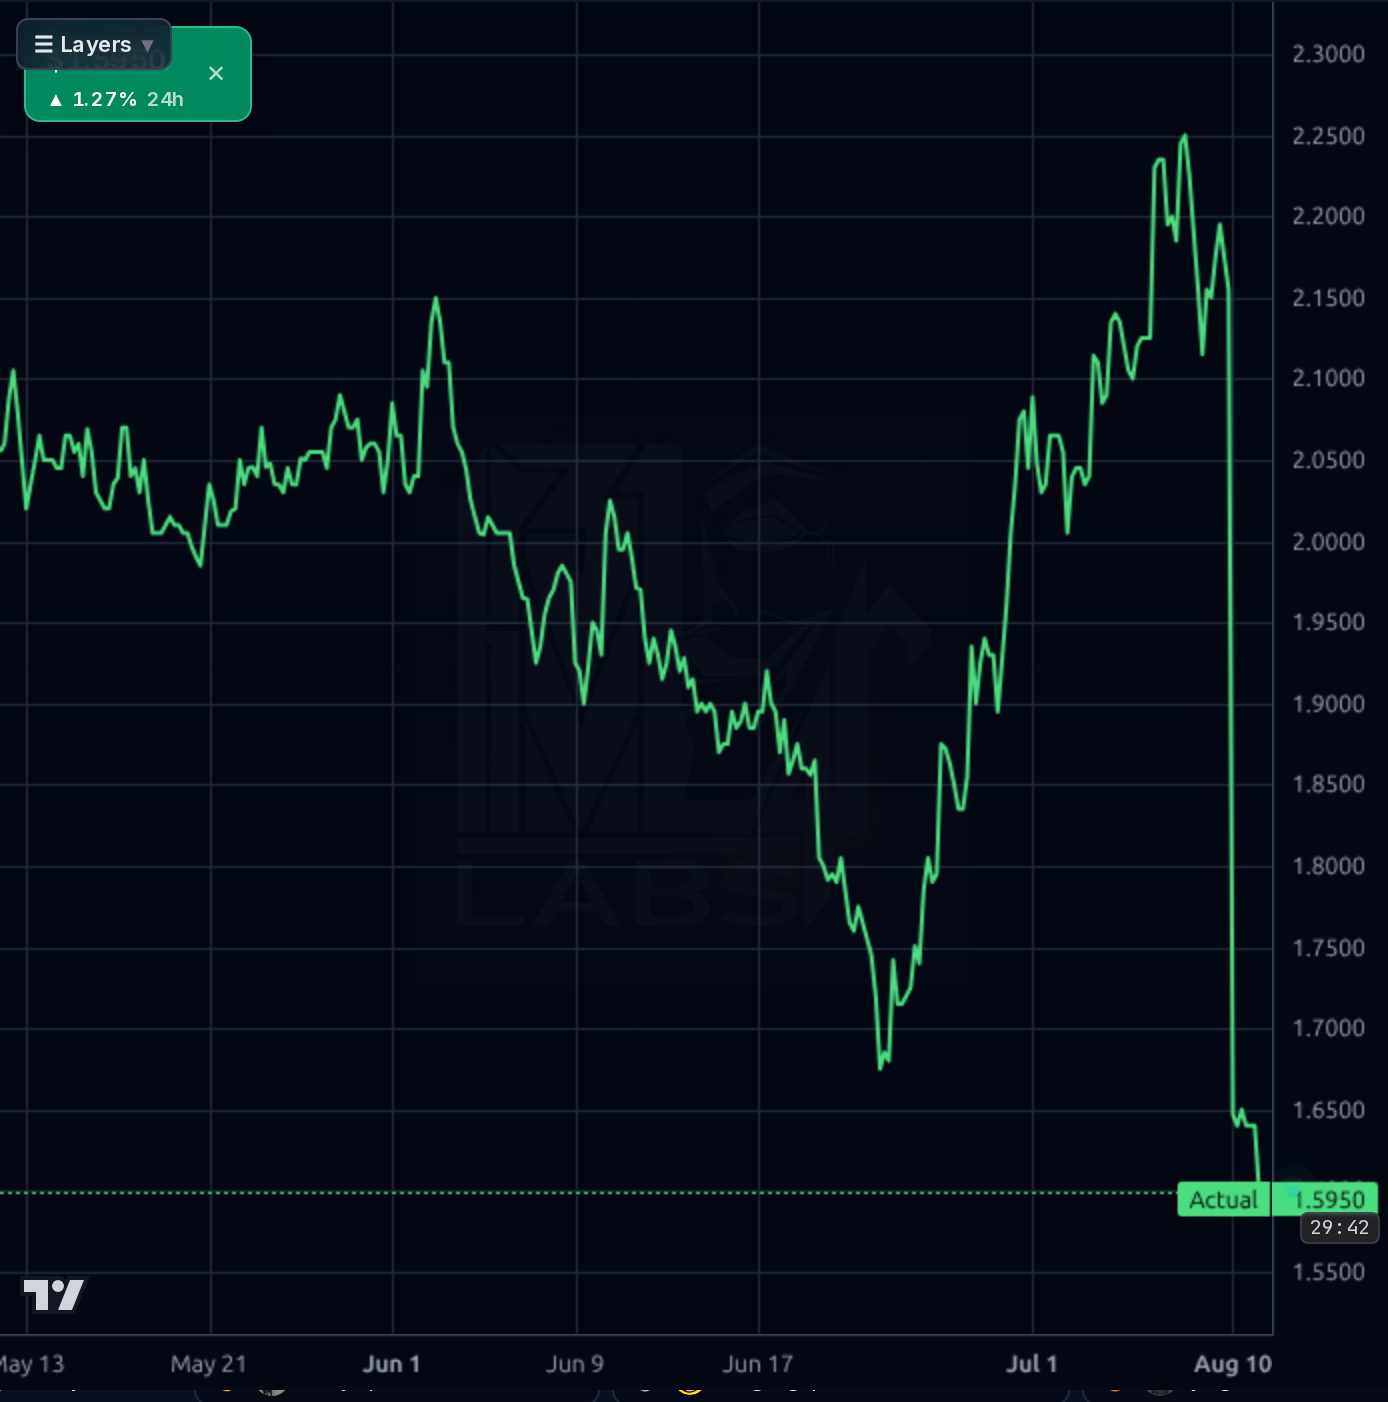
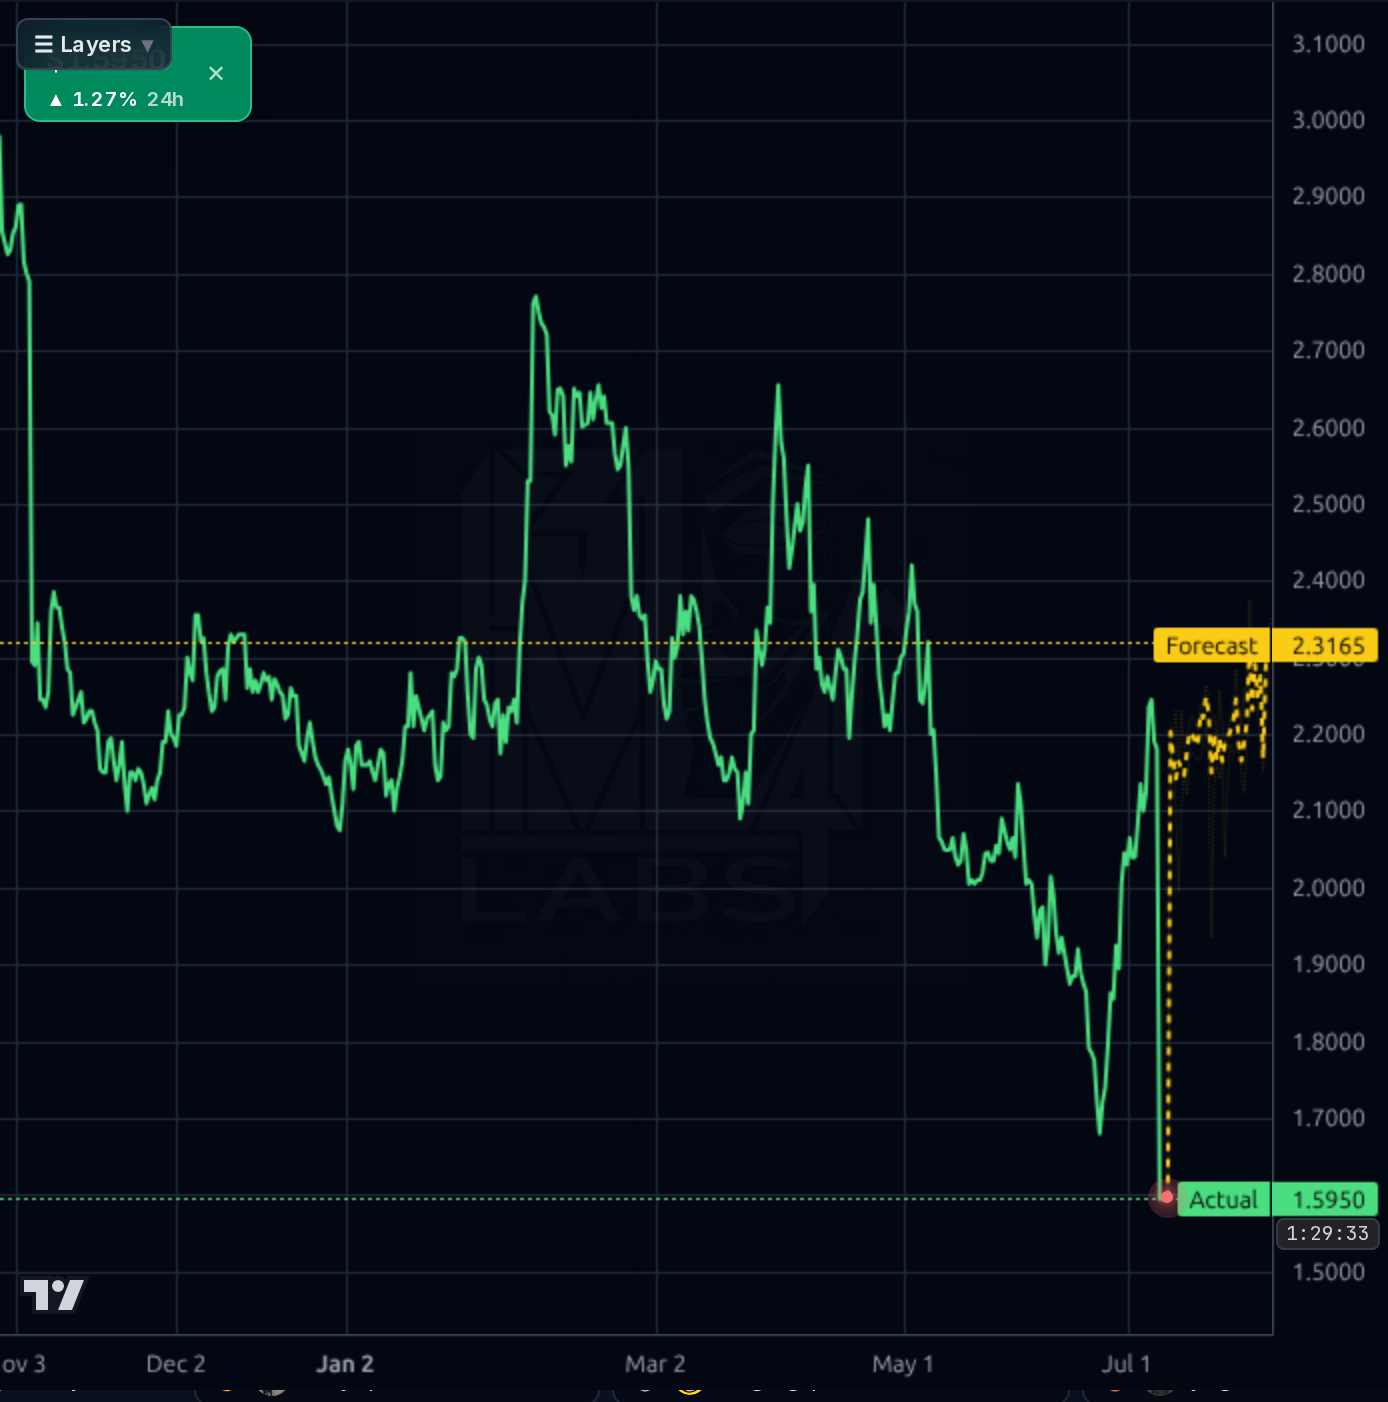
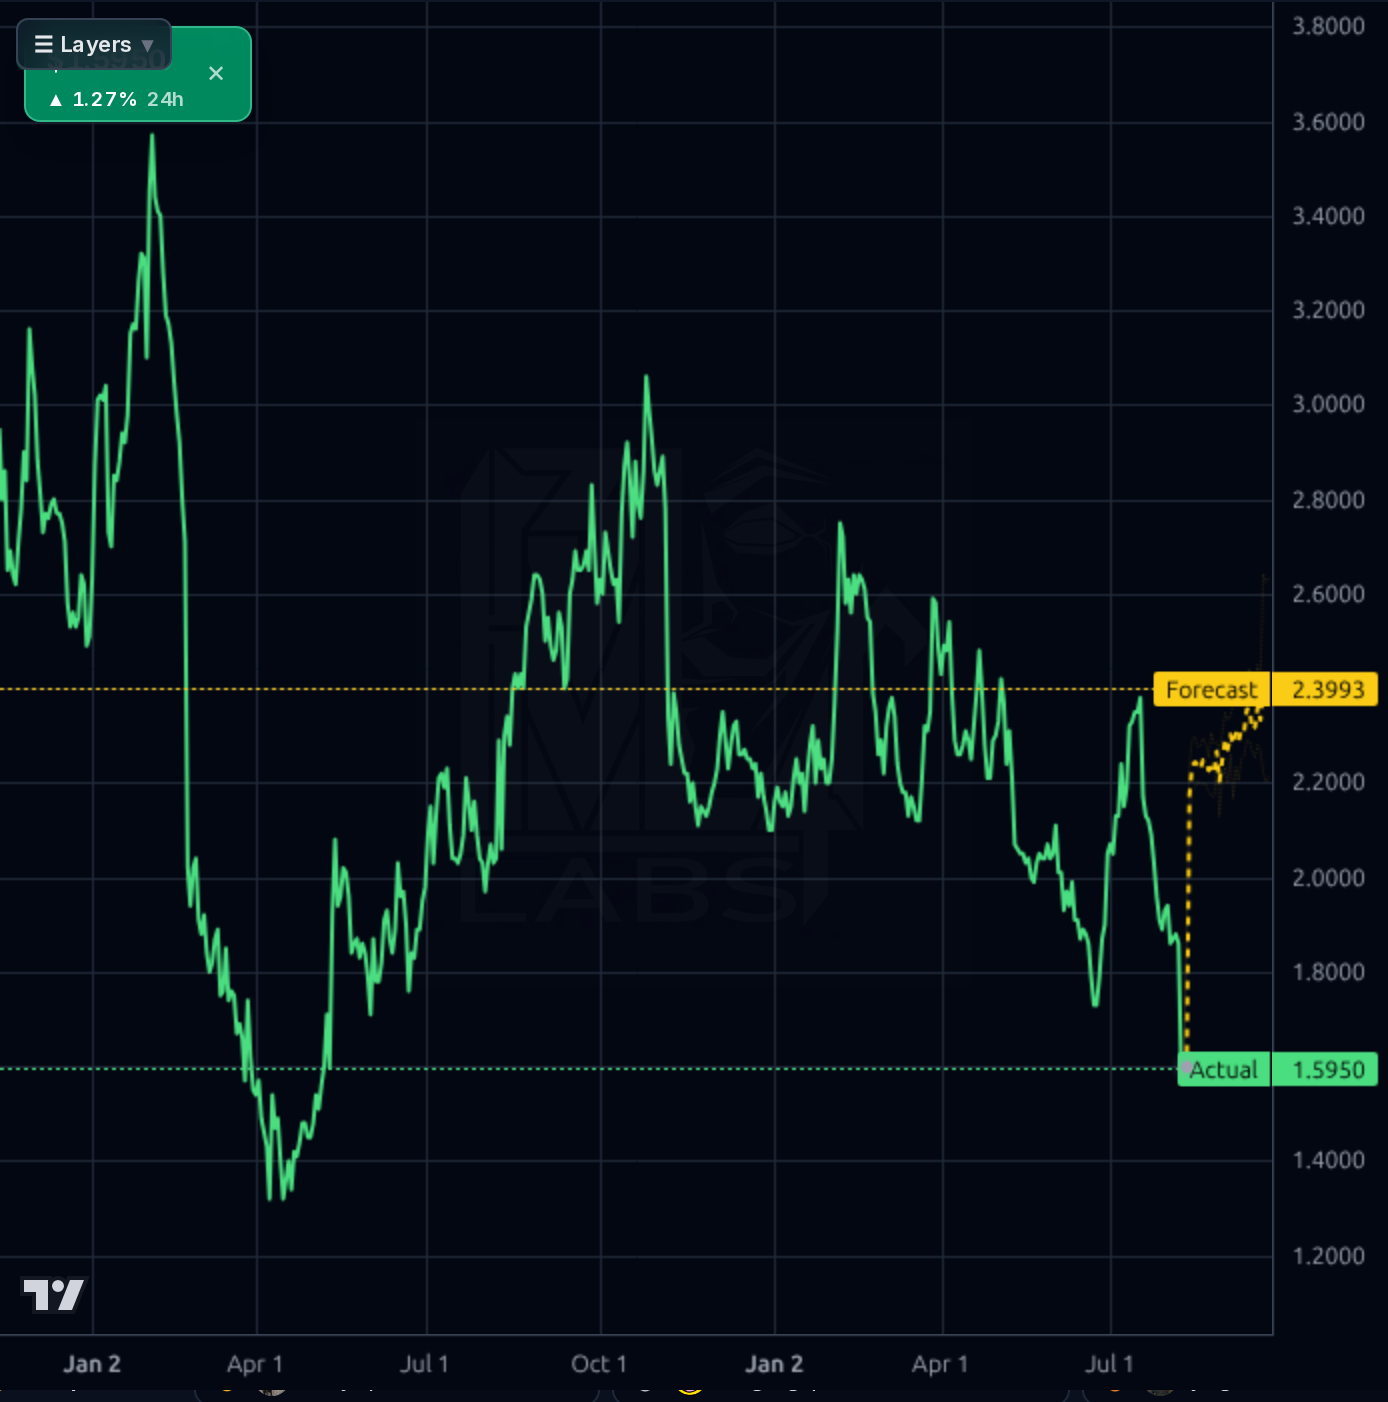
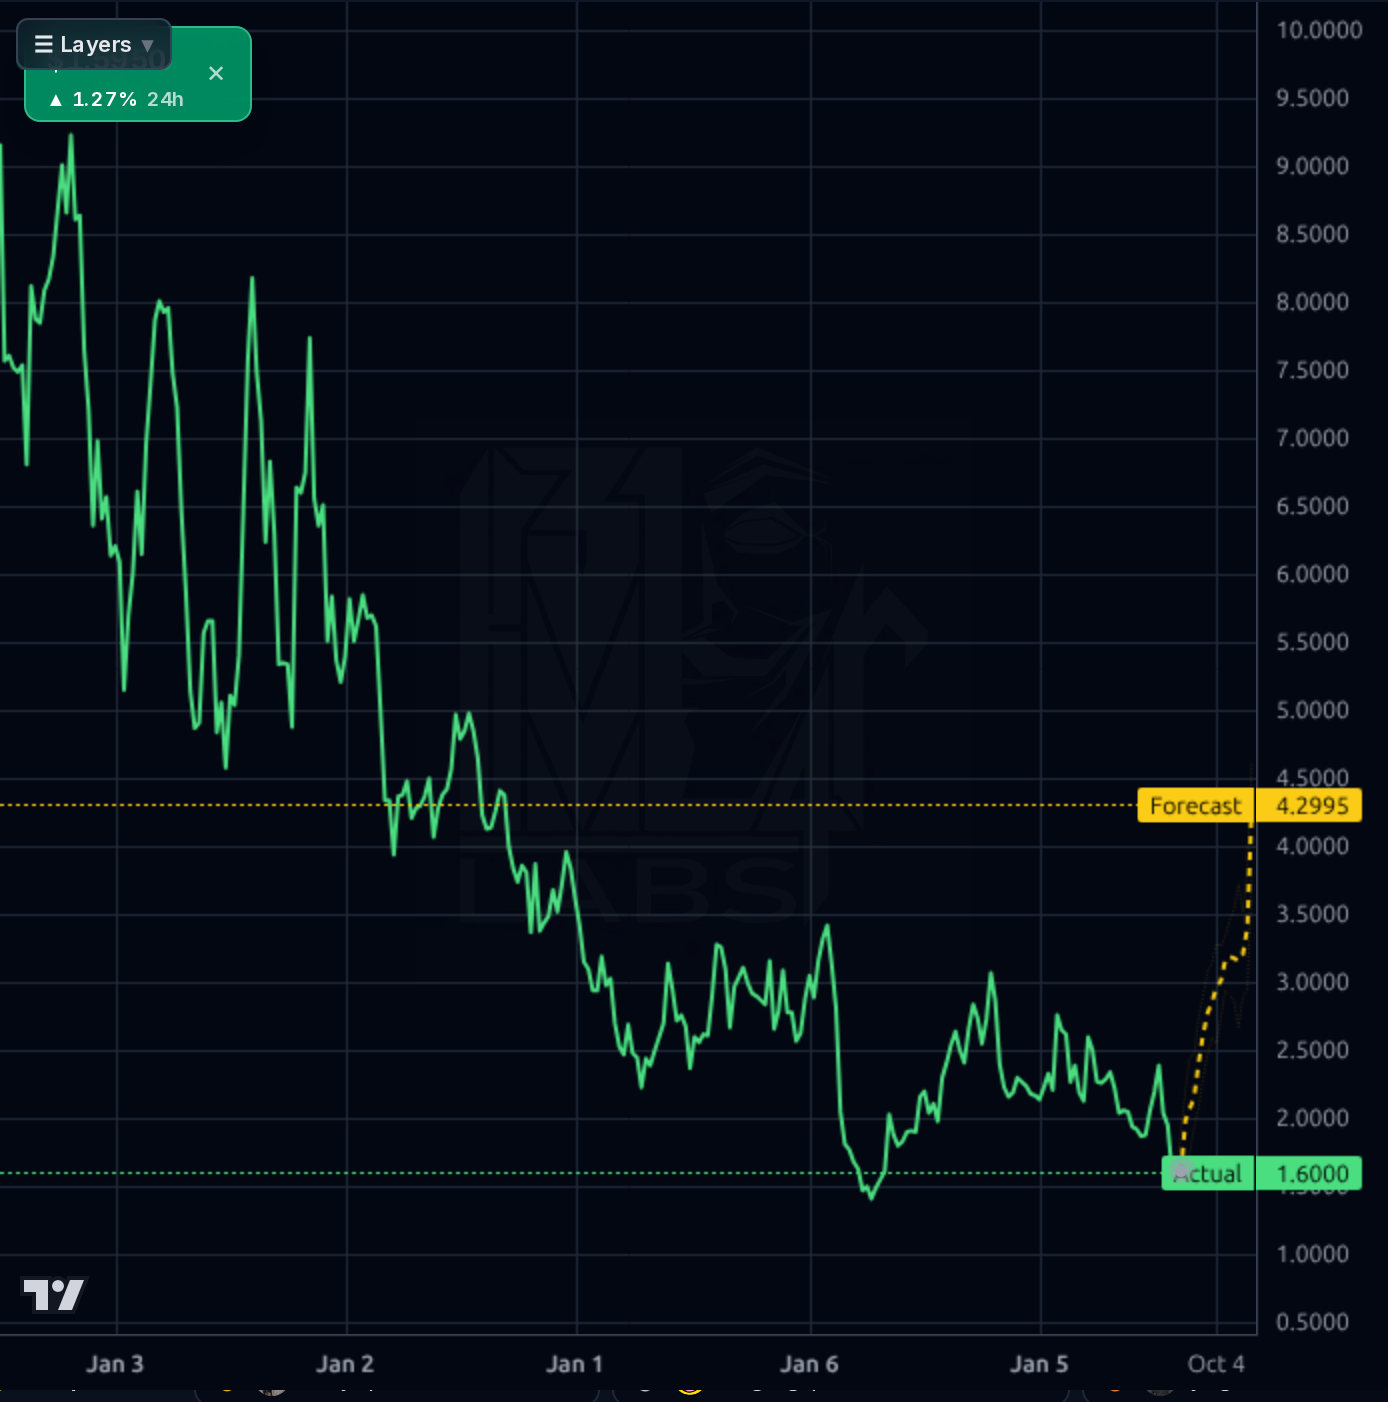
The chart shows a breakdown below the $1.57 support level (52-week low), with price currently at $1.58 and RSI at 24—indicating oversold conditions but no clear reversal signal. Kronos AI forecasts suggest upside to $2.3993 (1d) and $4.2995 (1wk), but directional accuracy for the model is only 32% on a 1-day horizon, making these forecasts unreliable. The stock has been trending downward since Q2 results, with technical momentum failing to overcome fundamental weaknesses.
Q2 results beat revenue expectations by 3.7% YoY ($106.4M) but missed consensus by 6.8%, triggering a -15.3% drop in price. The company reported non-GAAP loss of $0.01 per share, with positive contract wins (e.g., Western Canada stations) offsetting revenue misses. However, persistent negative margins (-21.27% TTM) and high debt ($323M vs $57M cash) overshadow these positives. The market regime shows risk dial neutral but no immediate catalyst for structural improvement.
- RNG dairy/livestock waste projects: Recent news highlights expansion in Western Canada with Tourmaline partnership, offering incremental revenue visibility.
- LCFS/RIN credit pricing: Positive regulatory tailwinds could boost EBITDA leverage if credit prices stabilize or increase
- Cash burn & debt maturity: $323M debt vs $57M cash creates persistent risk of forced dilution or unfavorable refinancing terms
- Margin inflection failure: Negative operating margins mean revenue beats are insufficient catalysts without corresponding, sustainable margin expansion
Get AI analysis on any stock
This is one of hundreds of Kronos AI reports — scored fundamentals & technicals, bull/base/bear price targets, a multi-horizon plan, and continuously-updated forecasts across the market. Create a free account to explore them all.
Create your free account →Already a member? Sign in · Join our Discord