CLVT — AI Stock Forecast & Price Targets
Published 8/25/2026 · A free sample of K3vl4r’s AI-powered analysis.
Kronos price forecasts, scored fundamentals & technicals, and a multi-horizon plan.
View the live CLVT price forecast →
CLVT is a highly-leveraged information services turnaround trading at ~$2.13 with a distressed valuation (0.30x P/B, 2.94x fwd P/E) but persistent GAAP losses and a $268.6M Q2 net loss driven by likely impairments. Recent director Cornick insider buying (~$1.7M cluster) and a modest technical recovery from $1.66 offset a bearish fundamental change (analyst PT cut to $2.98) and a CFO transition; risk/reward is balanced but skewed to a range-bound hold given deleveraging execution risk.
Range trade with a tactical long bias above $2.00. The Cornick insider buy at ~$2.00 provides a soft floor, and price has reclaimed SMA20/50. Entry zone $2.05-2.15, tight stop below $1.95 (invalidates the insider-support thesis). First target $2.30 (recent range top), stretch $2.50 (Citi PT and prior resistance). Size small (1-1.5% of book) given 15.8% short float and 5.4-7.6% daily volatility. Invalidation: close below $1.90 on volume triggers exit and reassessment toward $1.66 retest.
Hold with defined risk. Thesis: FCF of ~$464M TTM supports debt service and LS&H divestiture proceeds should visibly reduce the $4.26B debt stack by year-end; if execution is credible, the stock re-rates toward the sell-side blended PT of $2.88. Expected return range: -20% to +35% skewed to the base case of $2.40-$2.60. Catalysts: Oct 28 Q3 earnings (must show sequential FCF recovery from $44M, deleveraging progress, and clarity on the Q2 impairment), LS&H sale proceeds deployment, and Cortellis agentic AI monetization commentary. What changes my mind: another quarter of negative EBITDA, cash burn, or a covenant scare pushes this to SELL; conversely, a debt paydown announcement of >$400M with FCF stabilization pushes to ACCUMULATE.
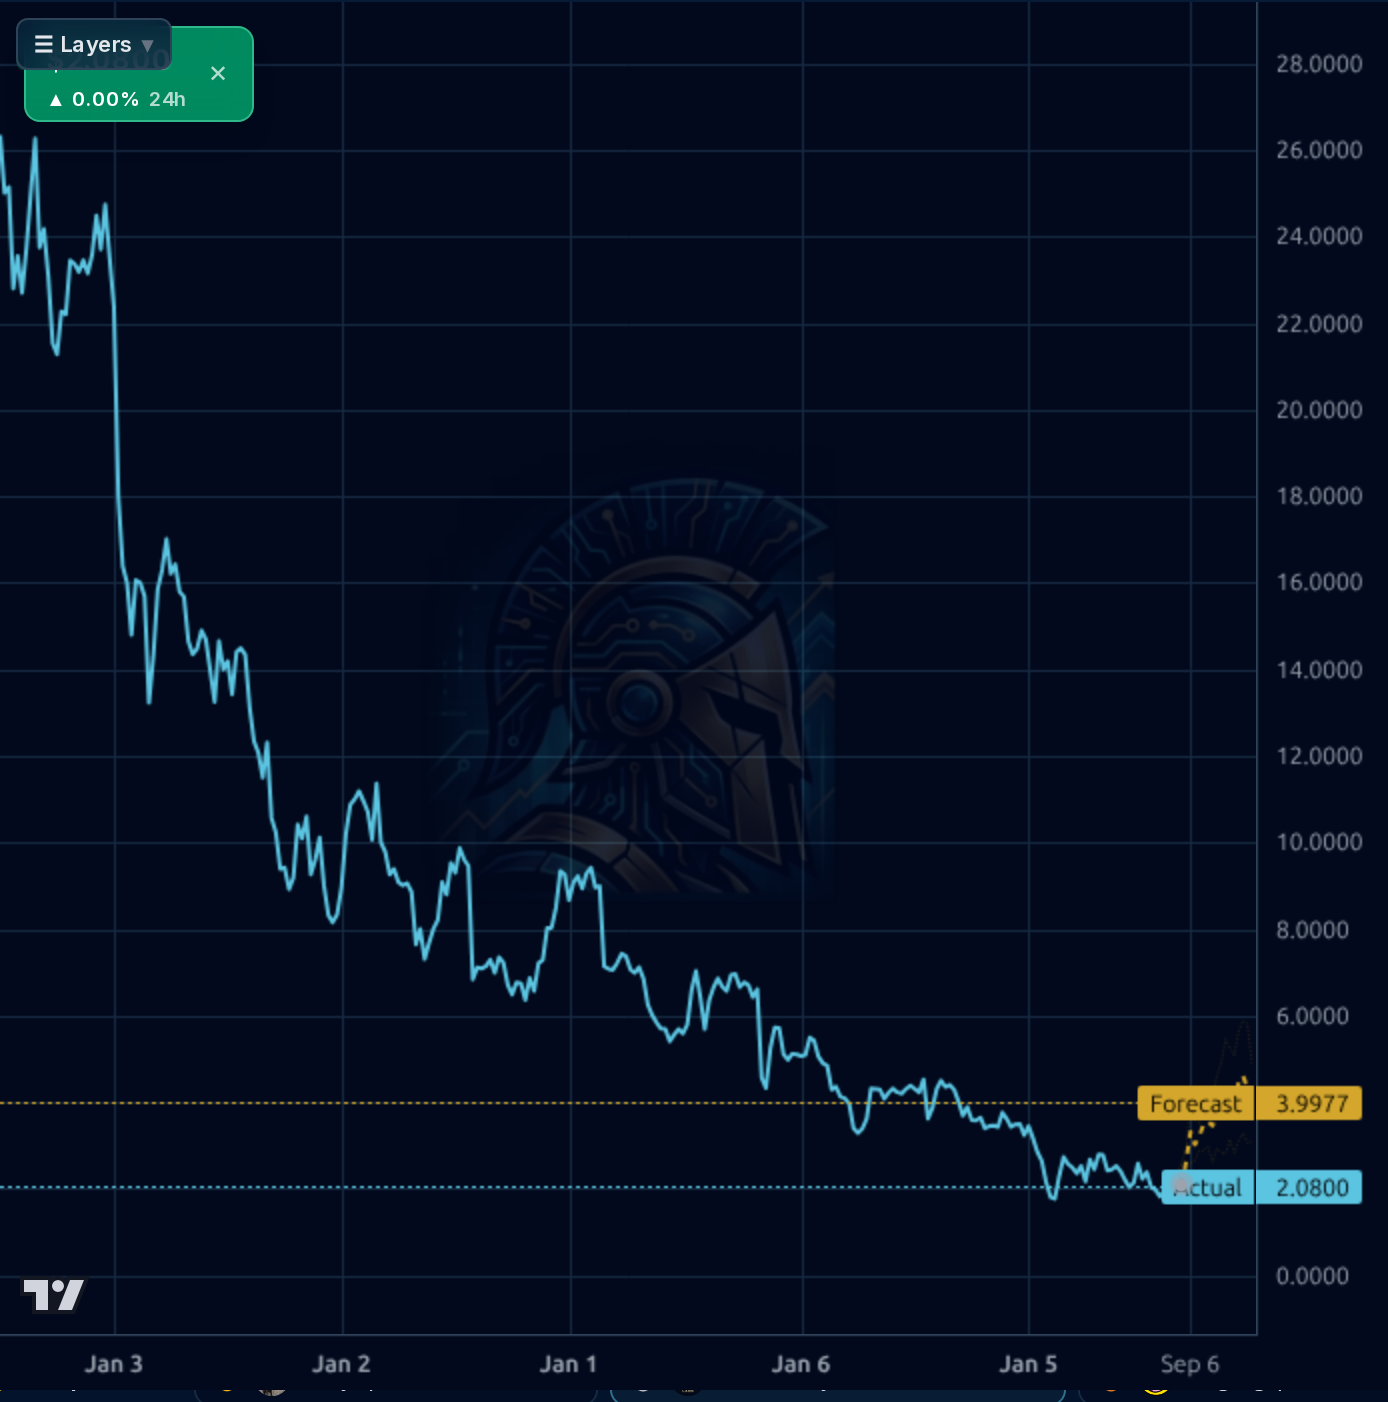
Terminal thesis is skeptical. CLVT owns genuinely valuable IP and information assets (Web of Science, Derwent, Cortellis) with 68% gross margins, but the equity is a leveraged call option on management executing a multi-year deleveraging while defending subscription revenue against AI-native competitors. The multi-year chart shows a -91% five-year drawdown from $26 to $2 — this is not a one-time cycle, it's structural. Base case is a $3-5 range if debt normalizes to <3x EBITDA and revenue reflates via AI products; bear case is a distressed refinancing or dilutive equity raise. Biggest structural risk: AI-native competitors (agentic search) commoditizing the Cortellis/Derwent moat faster than CLVT can integrate its own AI stack.
Revenue trend is deteriorating: Q2 2026 revenue of $587.3M is down from $623.1M in Q3 2025 (roughly -5.7% Y/Y trend), and TTM sales are $2.41B with Sales Q/Q at -5.49%. Gross margin remains a bright spot at ~68% (Q2 68.4%), but operating margin has compressed to ~6.1% and net income swung sharply negative at -$268.6M in Q2 (net margin -45.7%), suggesting an impairment or restructuring charge given EBITDA turned to -$14.5M vs. $214.2M the prior quarter. The balance sheet is the core problem: $4.26B total debt against $217.7M cash, D/E ~0.94 (per Finviz) though trailing metrics show leverage over 90x on book equity, negative working capital of -$221.5M, and a current ratio of 0.85. On the positive side, free cash flow remains real — $464.6M TTM FCF supports a P/FCF of 4.16 and an EV/EBITDA of 5.8x, meaning the cash engine still funds interest, but Q2 FCF stepped down to $44M from $115.5M in Q3 2025, a concerning deceleration. Capital allocation is dominated by asset sales (LS&H divestiture) and debt service rather than growth investment.
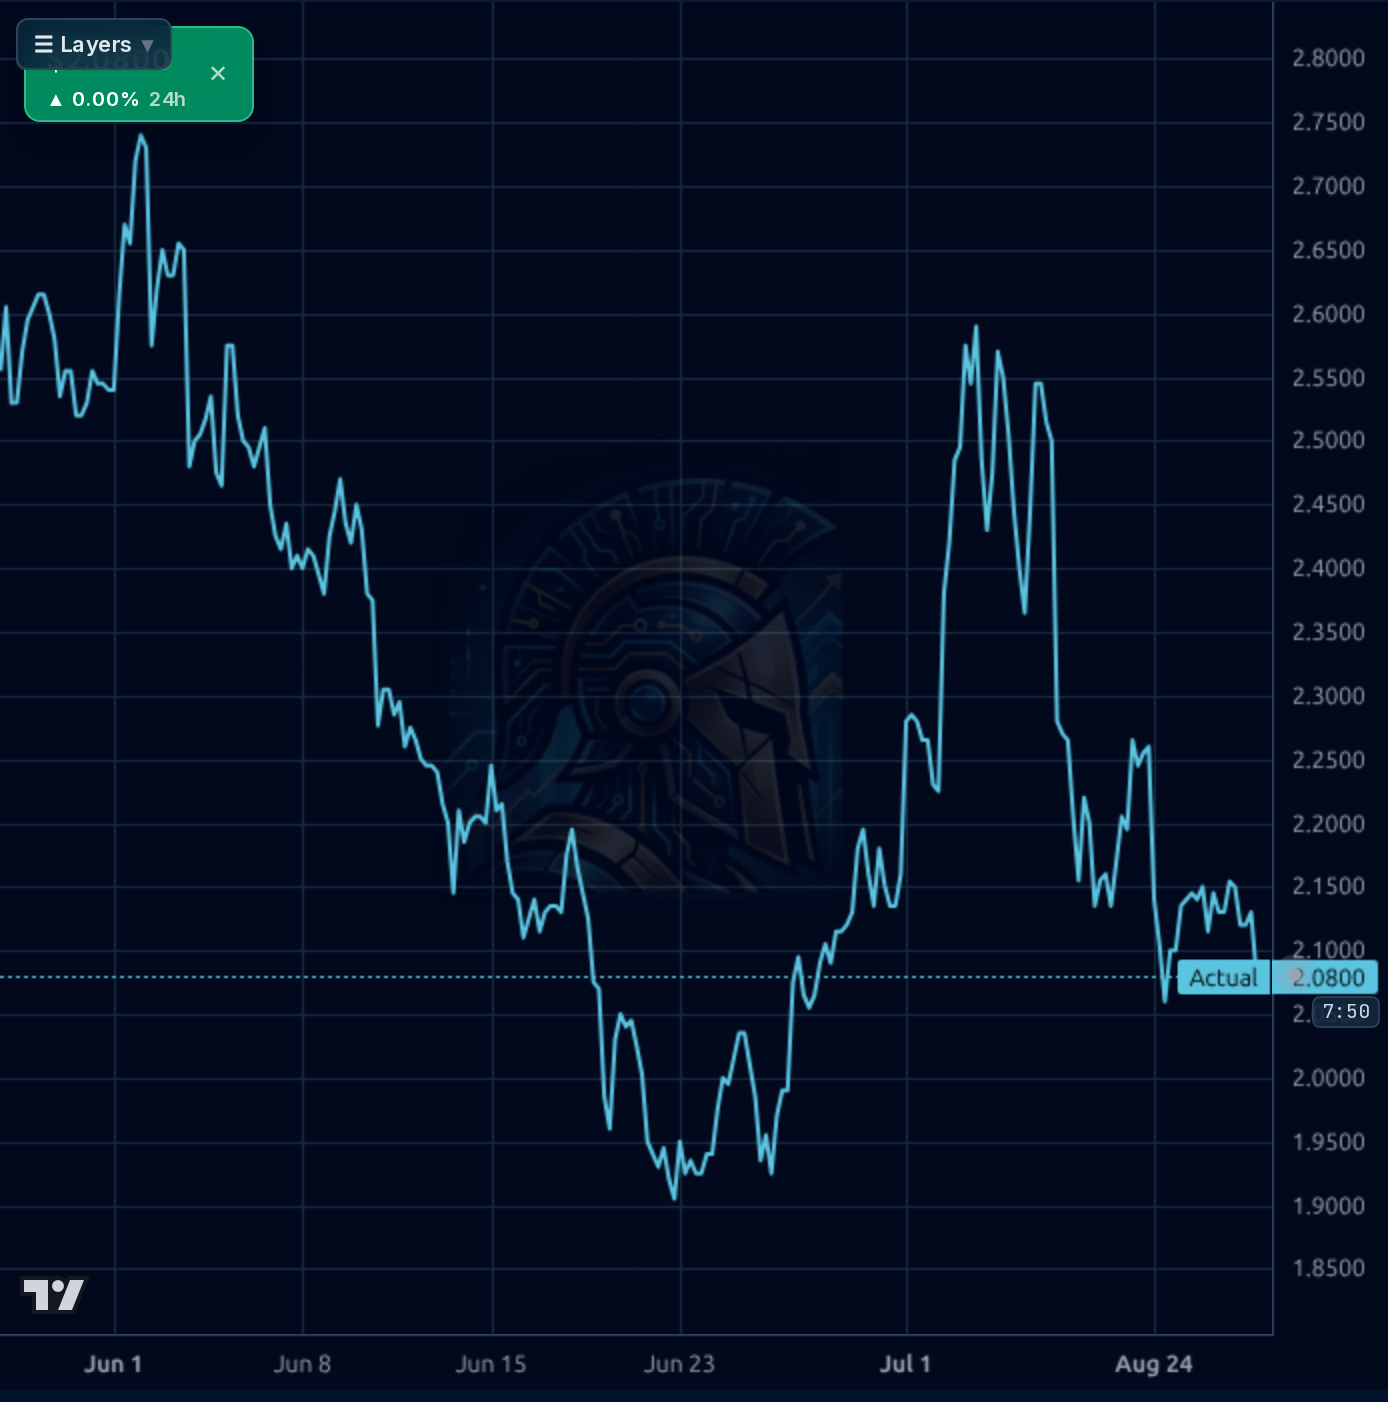
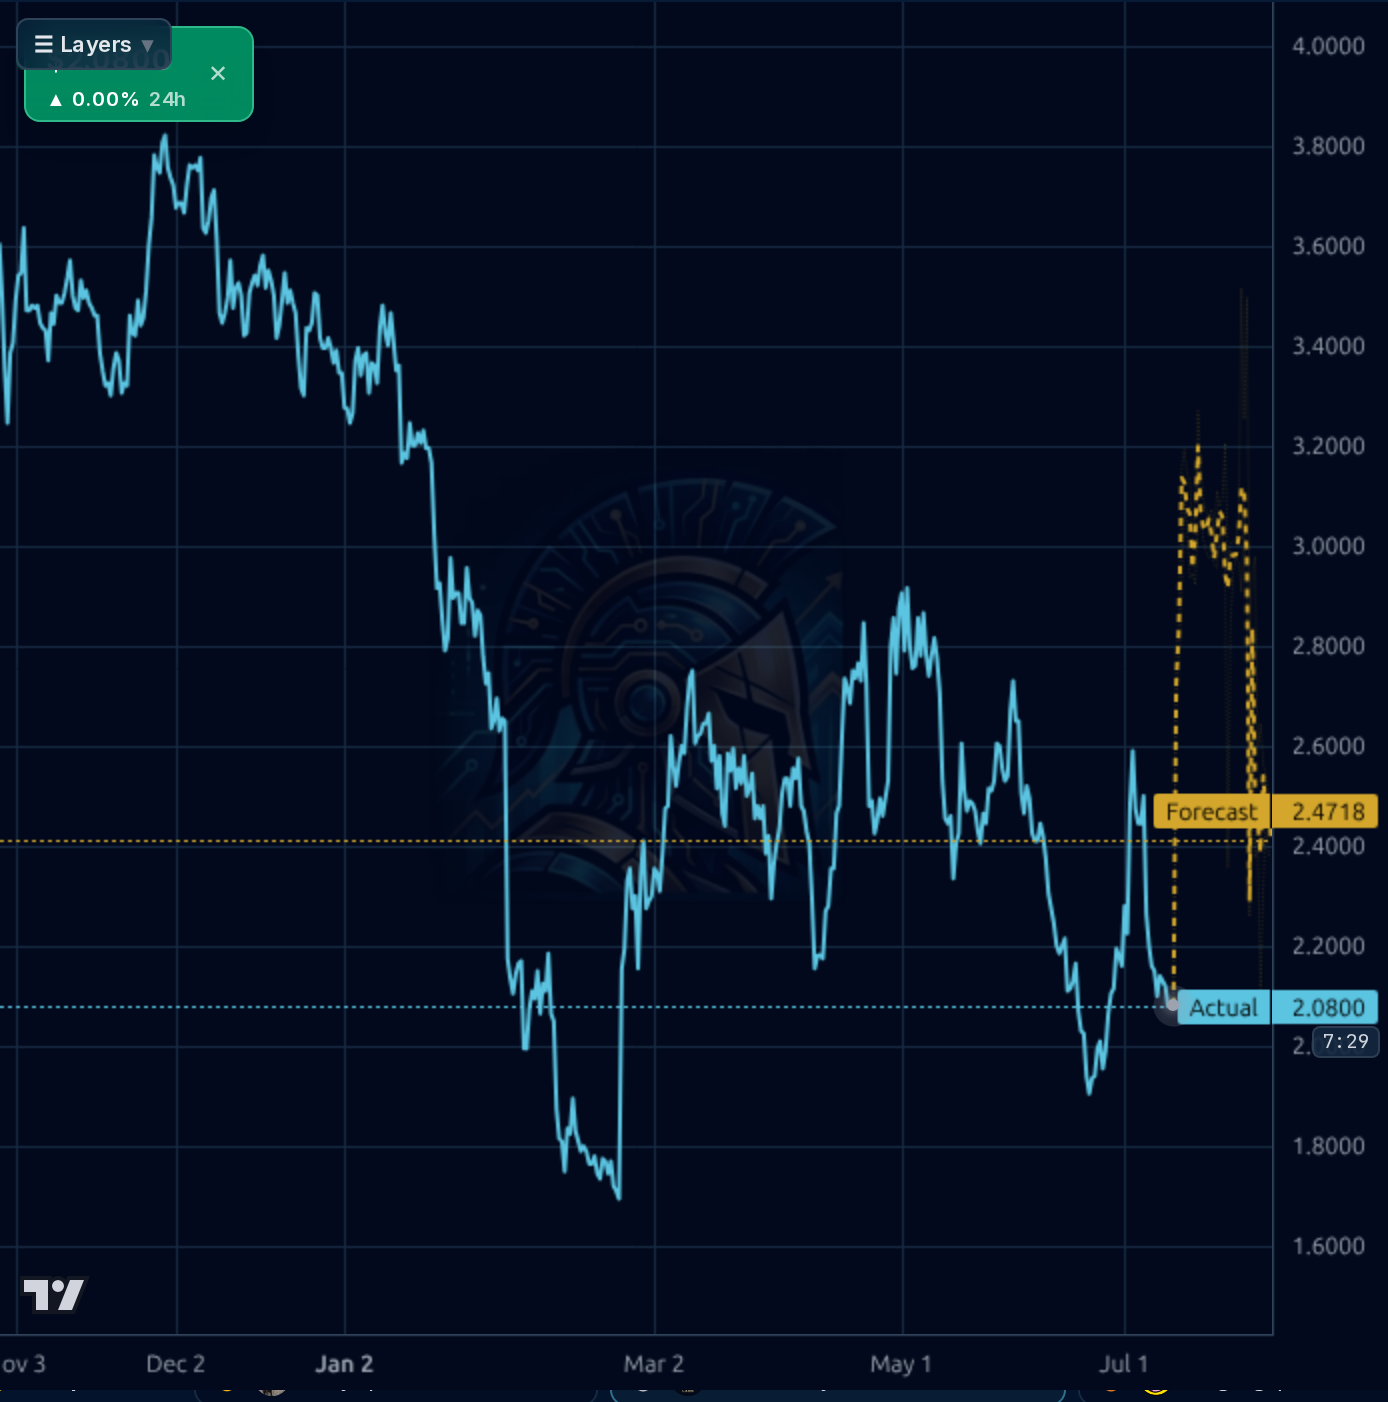
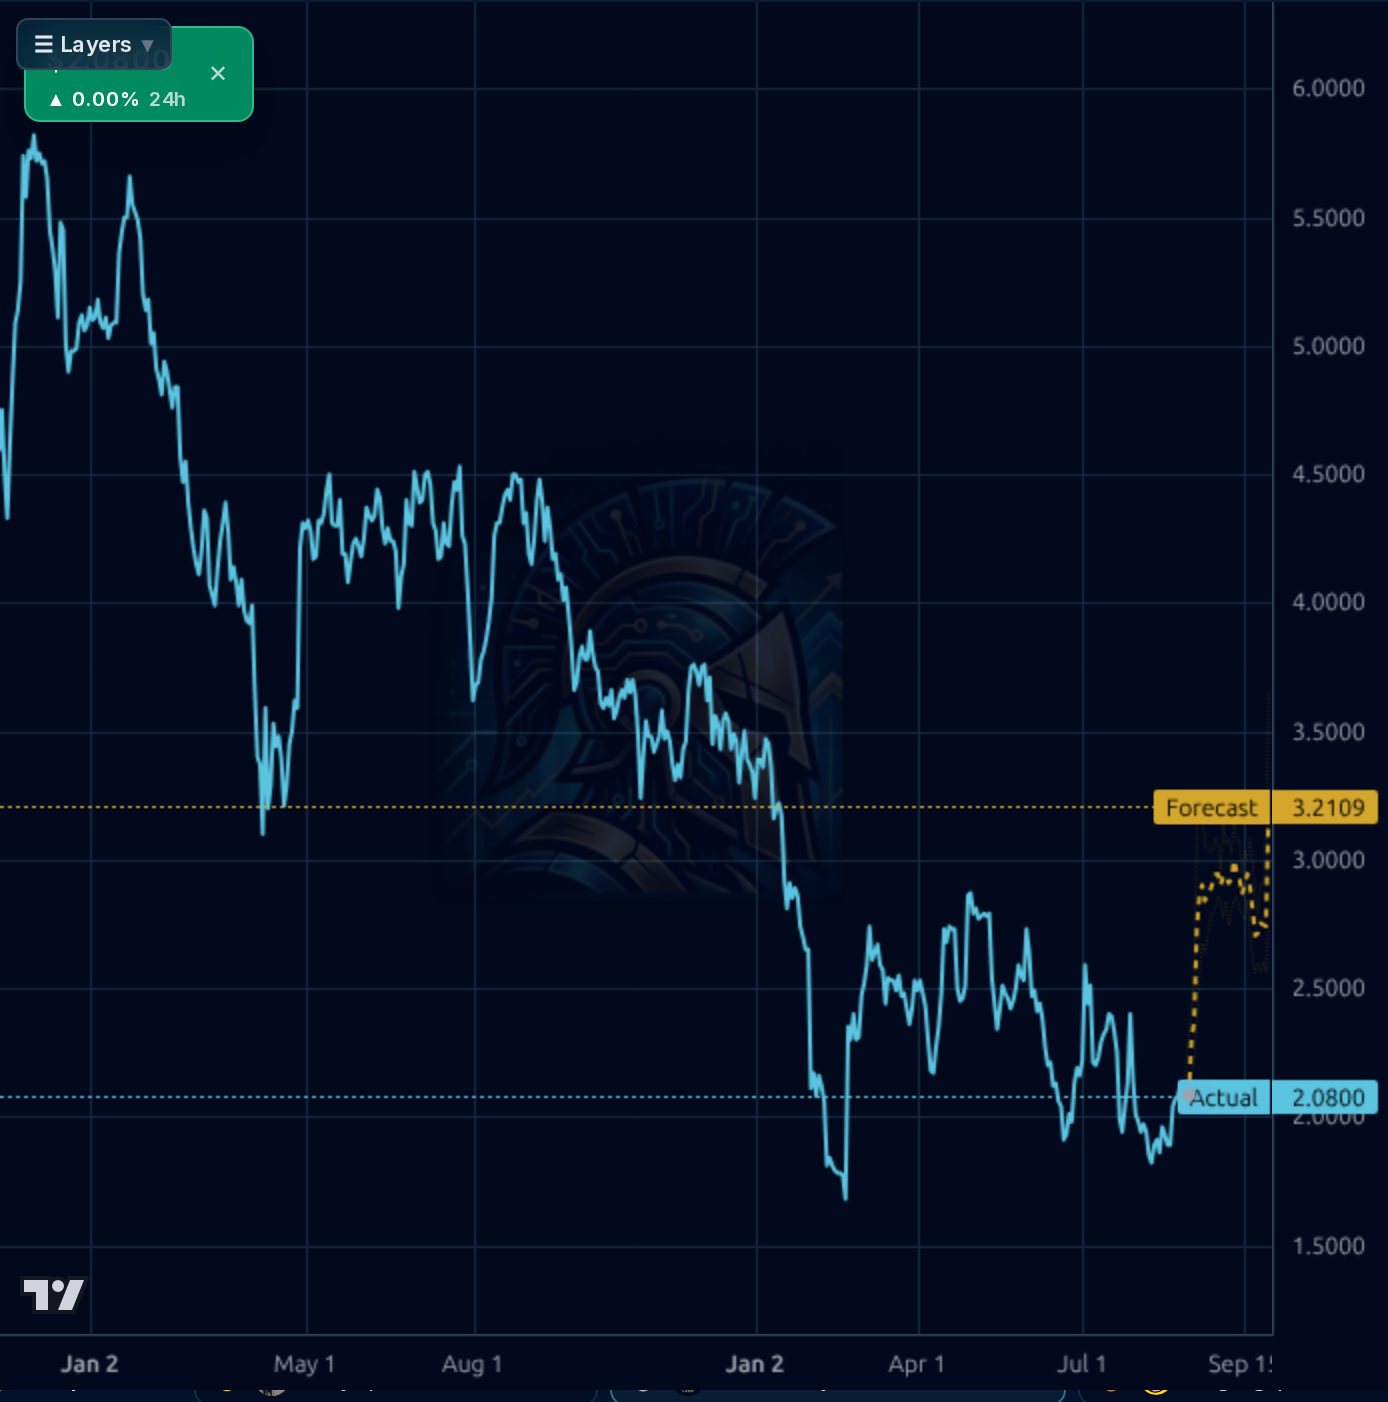
The 1h chart shows CLVT reclaimed the ~$2.00 zone after a sharp June selloff to $1.90, rallied to $2.58 in early July, then faded to current $2.13 — trading just above the June low band. On the 4h/1d frames, price sits near the lower end of a multi-quarter downtrend from $3.80 (Dec 2025) with the 200d SMA still -18.9% overhead; SMA20 (+7.3%) and SMA50 (+1.0%) show a nascent short-term recovery from the $1.66 52-week low (+28% off lows). RSI at 55 is neutral-constructive, weekly performance +12.7% and 6-month +26.8% show building base momentum. The model's forecast bands are contradictory and unreliable here — 1d/1wk directional accuracy (42%/33%) is worse than a naive baseline, and the 1d/4h forecasts point to $2.47 while the weekly $3.99 target is implausible given trend structure. Key resistance: $2.30, then $2.58 and $2.75; key support: $2.00 psychological, then $1.90 and $1.66 52-week low. A break of $1.90 opens downside toward the $1.66 low.
The material signal is the Cornick director cluster buy on Aug 6-7 totaling ~$1.7M (a 74% increase in his holdings per Motley Fool coverage), which is a genuine conviction signal that partially offsets the noisier Snyder director sales (~$4.8M on Aug 3). Q2 earnings on July 29 triggered a CFO transition (8-K Item 5.02) and updated guidance, and sell-side responded with cuts: Citi to $2.50, Goldman to $2.60, Stifel to $5.00 (still Buy), and a fundamental-change signal shows the consensus PT drifted from $3.28 to $2.98 (-9.2%). The Aug 7 Simply Wall St piece on Cortellis agentic AI expansion is a legitimate product-level moat story for the Life Sciences segment, though revenue impact is unquantified. Social sentiment is dominated by pump-style solicitation posts referencing a stock picker — pure noise, discount entirely.
- Cortellis agentic AI rollout (Aug 7 announcement) embeds multi-agent tools into pharma R&D workflows — potential to defend/expand Life Sciences ARR
- LS&H unit divestiture (~$600M) proceeds directed at debt paydown, reducing interest burden on $4.26B total debt
- Web of Science Research Intelligence AI-native platform for Academia & Government segment (largest revenue segment)
- Portfolio rationalization strategy outlined by CEO Shem Tov on Q2 call (Aug 8 transcript) — potential margin uplift from divesting subscale assets
- IP segment monetization via RiskMark AI trademark evaluation tool and Derwent AI-powered patent search
- $4.26B total debt vs. $217.7M cash and negative working capital of -$221.5M creates refinancing/covenant risk
- Q2 net income of -$268.6M and EBITDA swinging to -$14.5M suggest impairment charges and unresolved cost structure issues
- FCF decelerated sharply from $115.5M (Q3 2025) to $44M (Q2 2026) — the cash-generation thesis is weakening
- CFO transition on July 29 during a leverage-critical period adds execution risk
- Sell-side PT cuts (Citi $2.50, Goldman $2.60, consensus -9.2% to $2.98) signal deteriorating institutional conviction
- 15.8% short float and 7.86 short ratio indicate crowded bearish positioning that could unwind violently either direction
- Forecast model directional accuracy (42% 1d, 33% 1wk) is worse than naive baseline — do not lean on model targets
- Secular AI competition risk to Cortellis/Derwent moats from AI-native entrants
Get AI analysis on any stock
This is one of hundreds of Kronos AI reports — scored fundamentals & technicals, bull/base/bear price targets, a multi-horizon plan, and continuously-updated forecasts across the market. Create a free account to explore them all.
Create your free account →Already a member? Sign in · Join our Discord