COF — AI Stock Forecast & Price Targets
Published 9/15/2026 · A free sample of K3vl4r’s AI-powered analysis.
Kronos price forecasts, scored fundamentals & technicals, and a multi-horizon plan.
View the live COF price forecast →
Capital One trades at ~8.6x forward earnings with a completed Discover integration ahead of schedule, becoming the largest US credit card issuer, yet the stock is down 14.6% YTD and 9% over the past month. Fundamentals are improving (Q2 net income $3.02B, sales +38% YoY, ROE recovering), but heavy insider selling, a risk-off macro backdrop, and near-term forecast weakness argue for patience rather than aggressive entry.
1-4 week view: Neutral-to-cautious into the Oct 20 earnings print. Price is in a downtrend below all key SMAs with weakening momentum (RSI 40). Do NOT initiate a full position ahead of earnings — that is binary risk. Tactical setup: small starter position ($195-200 zone), stop below $190 (recent flash low). A break above $212 with volume would confirm reversal and permit adding. Invalidation for any bullish tilt: daily close below $192.
1-6 month view: Constructive. The Discover integration completion and 8.6x forward P/E create asymmetric setup if consumer credit doesn't deteriorate materially. Base case sees rerating toward $230-240 as synergies flow through 2027 EPS estimates. Catalysts: Oct 20 earnings (guidance on synergy pacing, credit trends), monthly credit metrics 8-Ks, conference commentary next week. What changes my mind: Q3 NCOs materially worse than Q2, guidance cut, or macro credit stress event pushing recession probability higher.
1-3 year view: COF is now the #1 US card issuer with a scaled two-sided network (Discover payment rails). Terminal thesis: ROE normalizes to 12-14%, EPS approaches $28-32, and multiple expands modestly to 10-11x for a $280-350 stock. Multi-year drivers: interchange economics on the Discover network, cross-sell to Discover cardholders, commercial banking expansion. Biggest structural risk: credit-cycle downturn combined with regulatory pressure on interchange/late fees materially compressing the unit economics that justify the acquisition premium.
Revenue trajectory is strong: quarterly revenue rose from $15.39B (Q4'25) to $15.85B (Q2'26), with TTM sales of $78.55B up 38% YoY reflecting Discover consolidation. Net income of $3.02B in Q2'26 nearly matched pre-integration Q3'25 levels, with net margin recovering to 19.1% from a depressed 14.3% in Q1'26. Operating cash flow of $8.4B in Q2 and FCF of $8.1B are robust, easily covering the 1.55% dividend (64.5% payout). Balance sheet shows $54.7B cash against $44.7B debt and $113.8B stockholders' equity — P/B of just 1.12x against book value of $185.49/sh is notably cheap for a bank of this scale. ROE at 8.9% and ROA at 1.5% are still sub-optimal relative to peers, reflecting integration drag; the bull case requires ROE to normalize to 12%+ as synergies flow through. Forward P/E of 8.6x and PEG of 0.71 look attractive if EPS estimates ($24.04 forward) are achievable. The $1.5B new bond issuance is manageable given the liquidity profile.
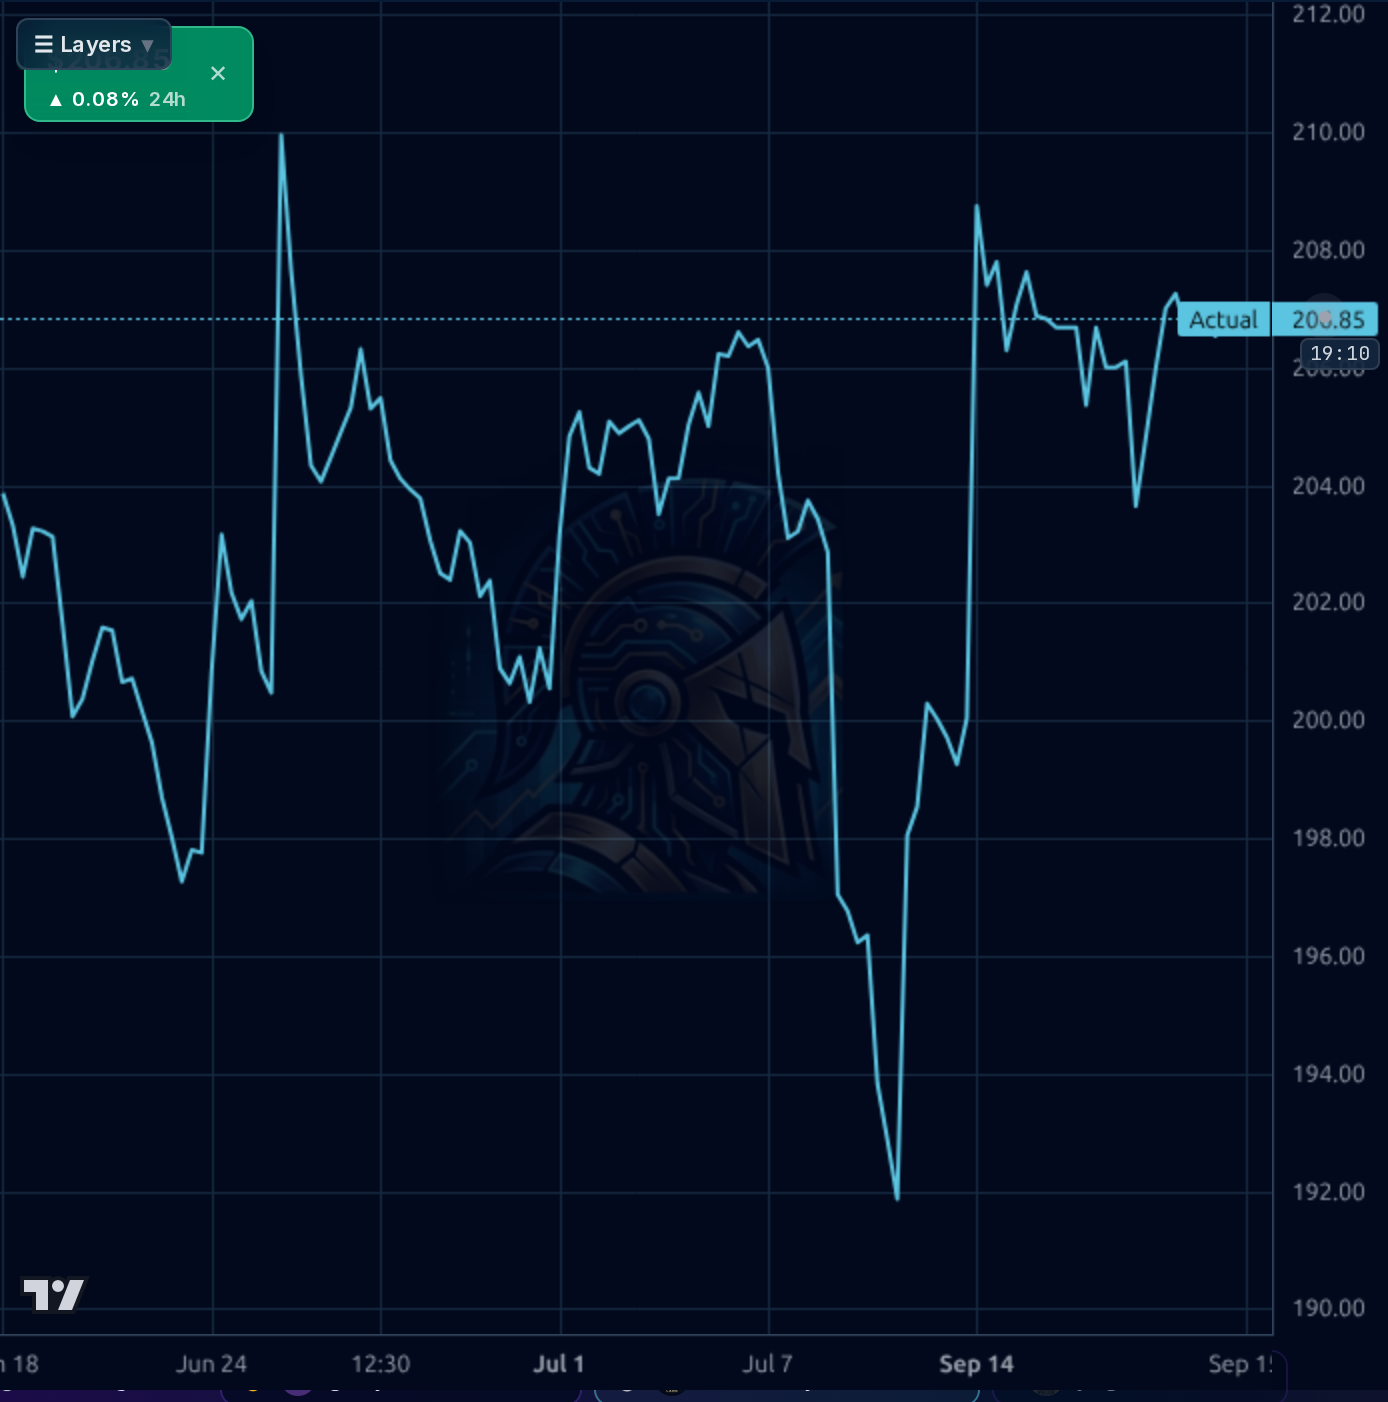
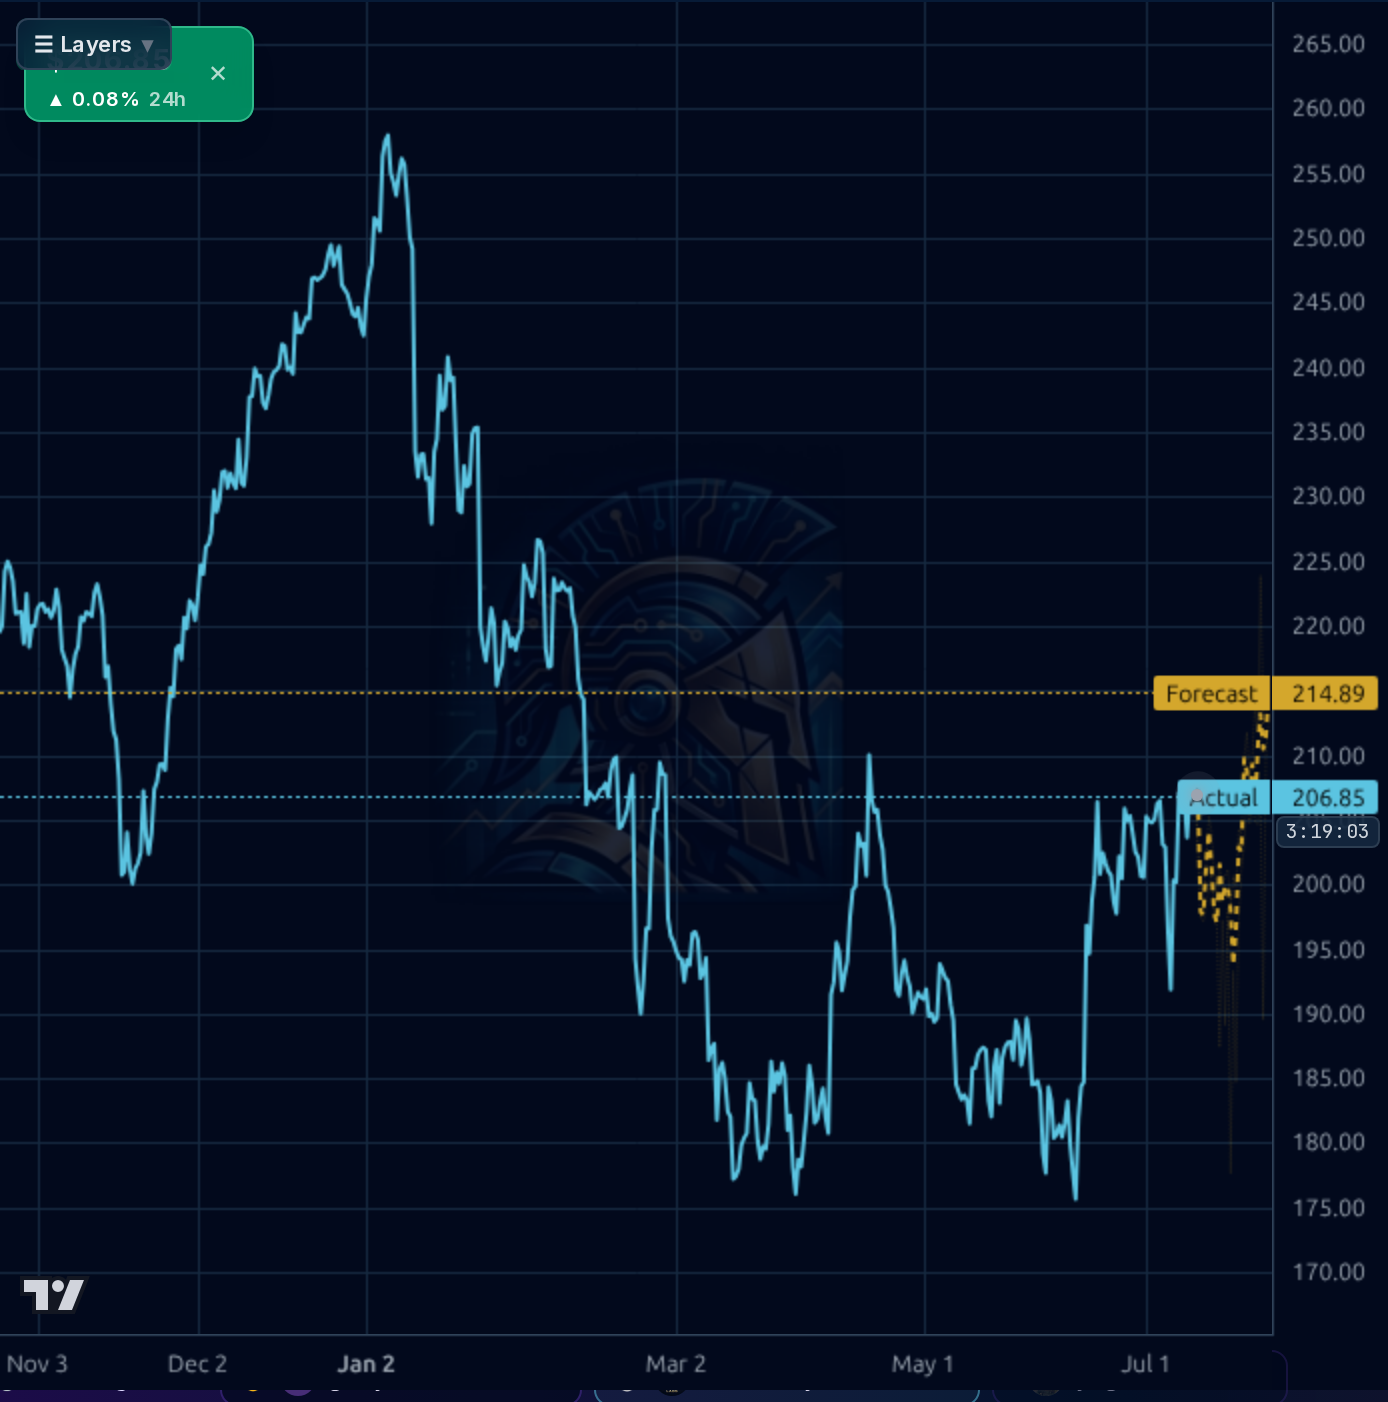
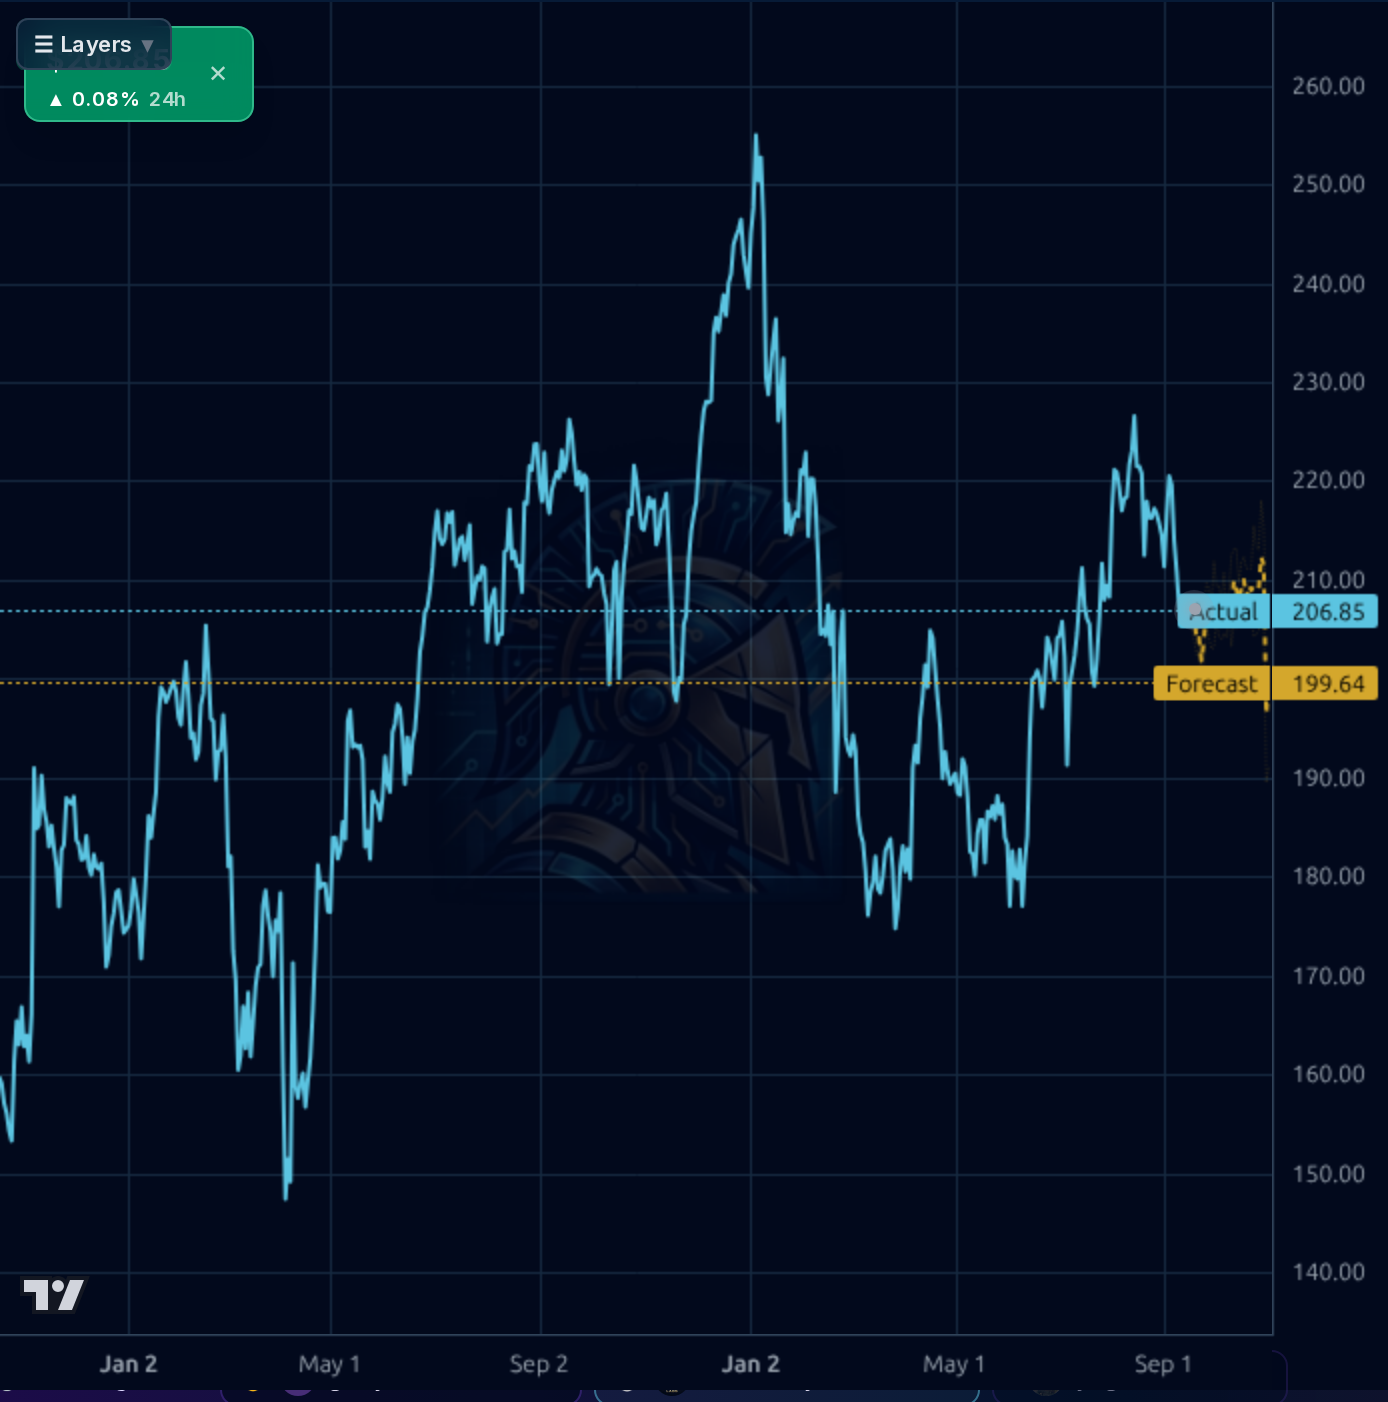
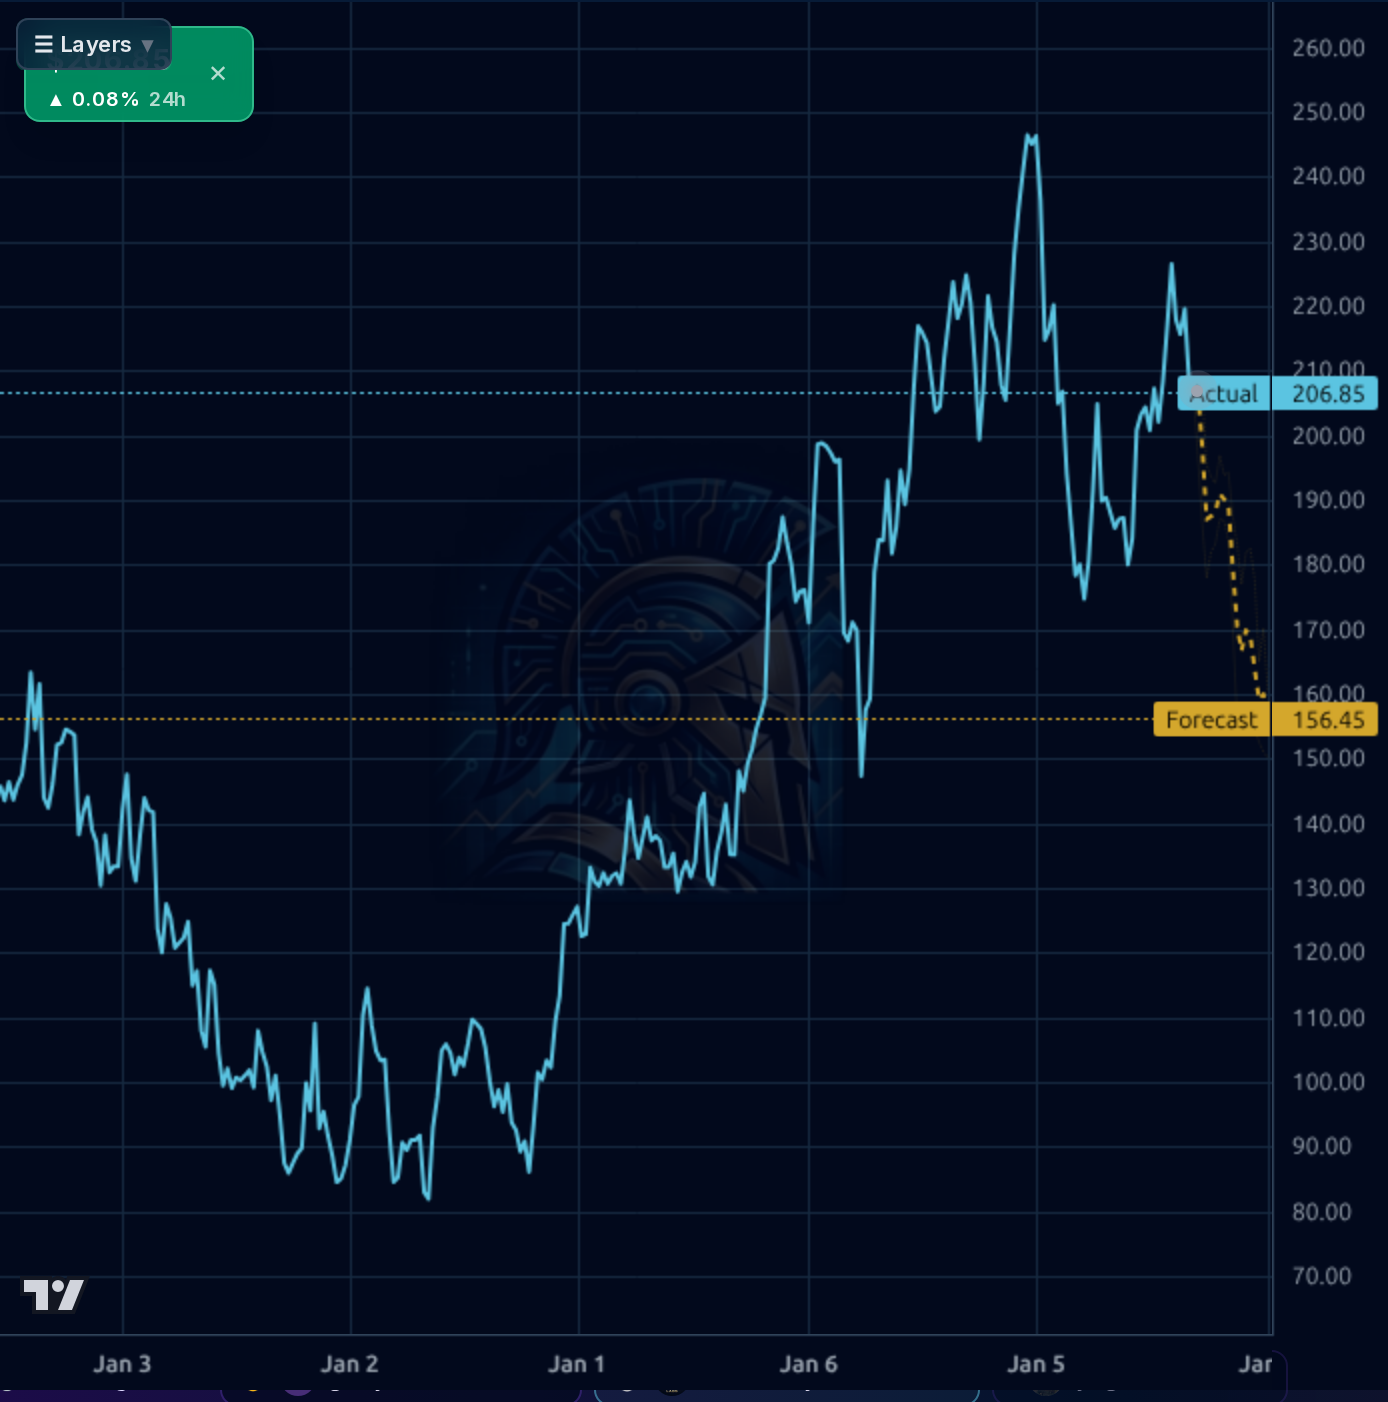
Multi-timeframe picture is mixed-to-weak. The 1h chart shows a sharp v-shaped recovery from ~$192 (early Sep flash low) back to $206.85, but price is capped below the recent $208-210 swing highs. The 4h chart shows a broader recovery from June lows near $175 with the forecast band ($214.89) pointing modestly higher but with wide downside skew to ~$190. The daily chart reveals a bearish setup: price rejected from $259 highs in early 2026, forming a lower-high pattern, with the forecast at $199.64 implying near-term downside. The weekly forecast is starkly bearish at $156.45 — though this should be discounted given the wide error bands at that horizon. Price sits -3.6% below SMA20, -2.6% below SMA50, and -0.4% below SMA200, with RSI at 40.24 (weak but not oversold). Perf YTD -14.65% and Perf Month -9.01% confirm the downtrend, though the stock has held critical support at $192-195. Key resistance: $212-216 (must clear for bullish continuation); key support: $195, then $174 (52W low).
Signal: Capital One has completed the Discover integration ahead of schedule and become the largest US credit card issuer — a genuine structural positive that the market appears to be underpricing given the compressed forward P/E. The 8-K on Aug/Sep 2026 monthly loan losses is a critical read-through on consumer credit health; management is also presenting at a financial conference next week, offering a potential positive catalyst. The Series M preferred redemption cleans up the capital stack. Noise: general credit-cycle worry pieces (subprime bankruptcy trends, high-end card competition pressure) are macro-industry headwinds rather than COF-specific. The $1.5B bond issuance is routine funding, not distress. Broader market news is not COF-specific.
- Discover integration completed ahead of schedule per Sep 14 coverage — synergy realization now a 2027 EPS tailwind
- COF is now the largest US credit card issuer, unlocking network economics from owned Discover payment rails
- Sales +38% YoY TTM ($78.55B) and Q2'26 net income rebounded to $3.02B (+42% QoQ) as integration one-timers roll off
- Forward EPS of $24.04 (vs. TTM $18.15) implies 32% earnings growth if consensus holds
- Series M preferred redemption and $1.5B senior debt issuance optimize the post-deal capital stack
- Management presenting at major financial conference next week — potential catalyst for updated guidance
- Heavy cluster of insider selling in July-August 2026 ($5M+ across 6+ executives including Chief Credit Risk Officer) — not a buy signal from those closest to the numbers
- Stock down 14.6% YTD in a risk-off regime with breadth deteriorating (44% >200dMA); credit-sensitive names typically underperform in this backdrop
- Consumer credit deterioration risk — 24/7 Wall St piece flags 40-59yr bankruptcy surge; monthly NCO 8-Ks are the key tell
- Earnings on Oct 20 is binary — a miss on credit metrics or 2027 guidance could push price to $180s
- ROE still only 8.9% and ROA 1.5% — integration synergies must materialize to justify rerating
- Weekly forecast model points to $156 downside band (albeit low-confidence at that horizon) — implies fat left tail if recession materializes
- Regulatory overhang on late fees, interchange, and card practices could compress the unit economics underpinning the Discover deal
Get AI analysis on any stock
This is one of hundreds of Kronos AI reports — scored fundamentals & technicals, bull/base/bear price targets, a multi-horizon plan, and continuously-updated forecasts across the market. Create a free account to explore them all.
Create your free account →Already a member? Sign in · Join our Discord