CPRT — AI Stock Forecast & Price Targets
Published 7/24/2026 · A free sample of K3vl4r’s AI-powered analysis.
Kronos price forecasts, scored fundamentals & technicals, and a multi-horizon plan.
View the live CPRT price forecast →
Copart is a fundamentally elite, debt-free compounder (33.5% net margin, 17.6% ROE, $3.35B cash) whose stock has been cut nearly in half to fresh multi-year lows at $27.20, sitting -45.7% from the 52W high and -25% below SMA200. The tape is decisively broken with revenue growth decelerating to ~1% Y/Y TTM, and while forward P/E of 16.2x is the cheapest in a decade, the technical structure and PEG of 3.13 argue for patient, methodical accumulation rather than chasing bounces into the Sept 3 earnings print.
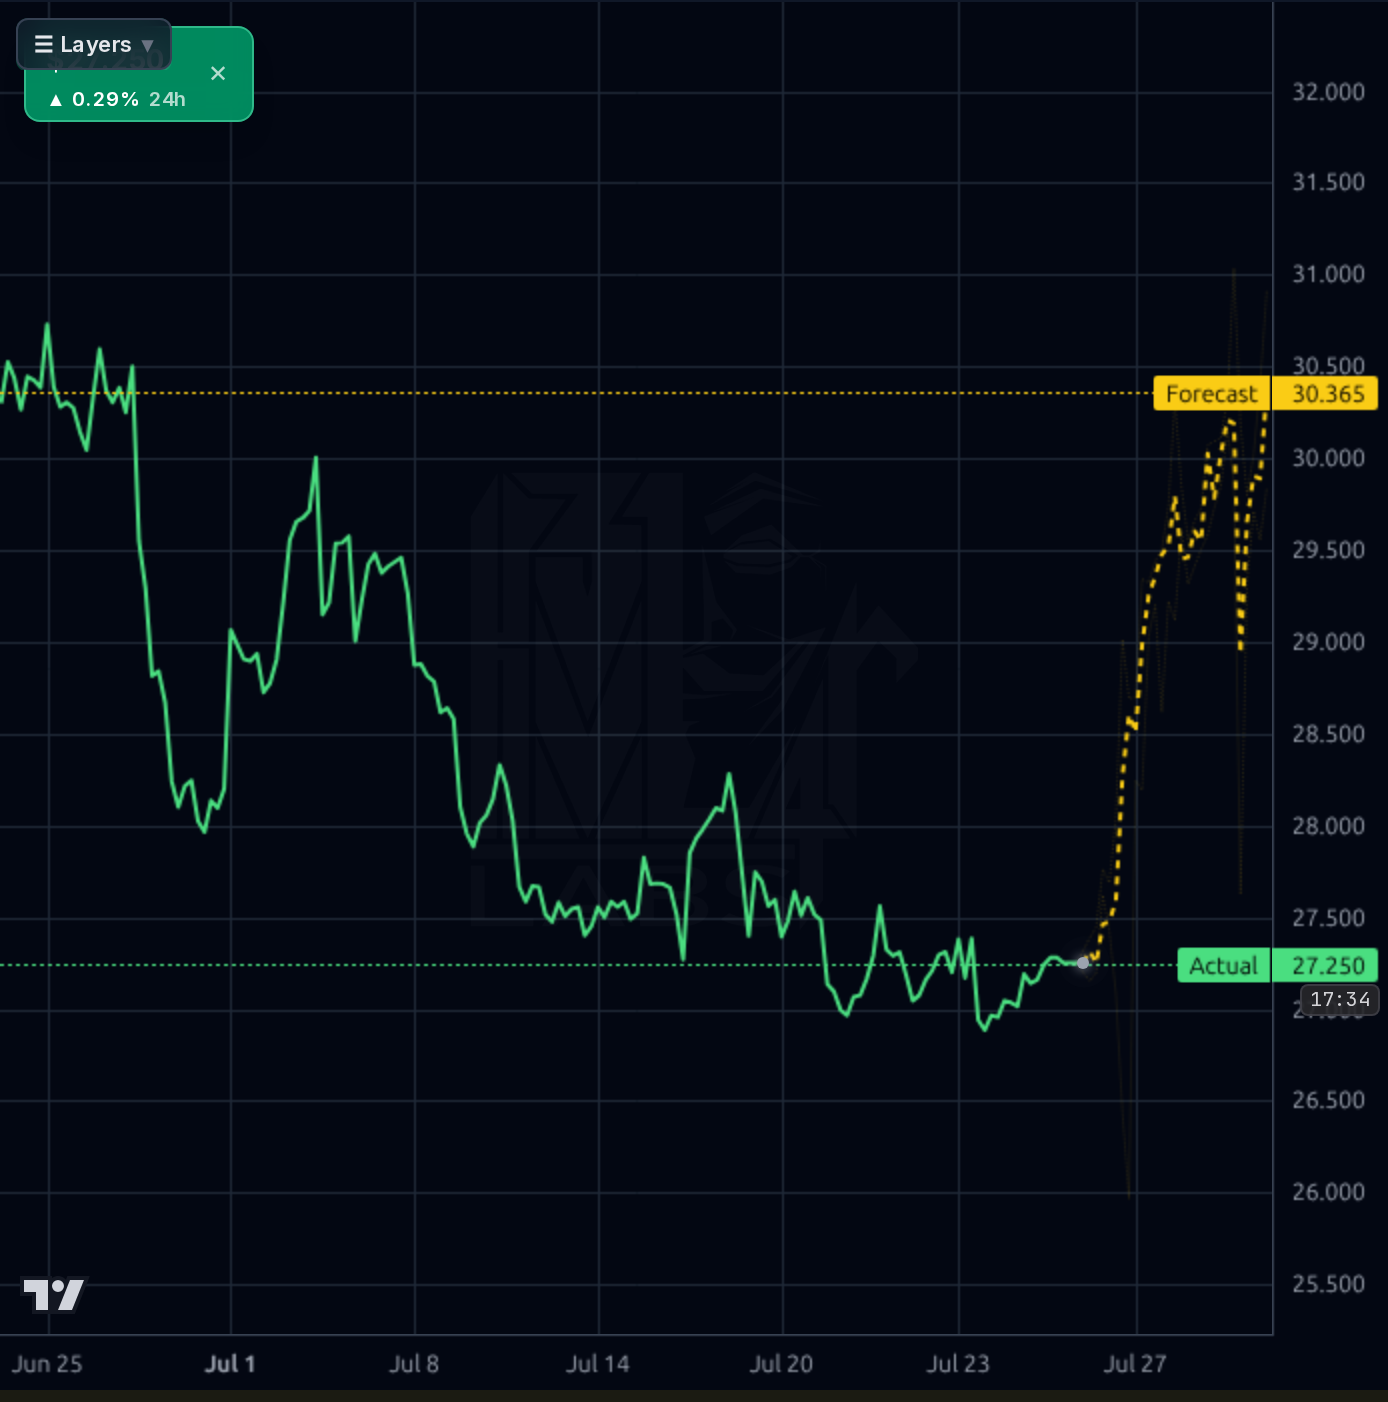
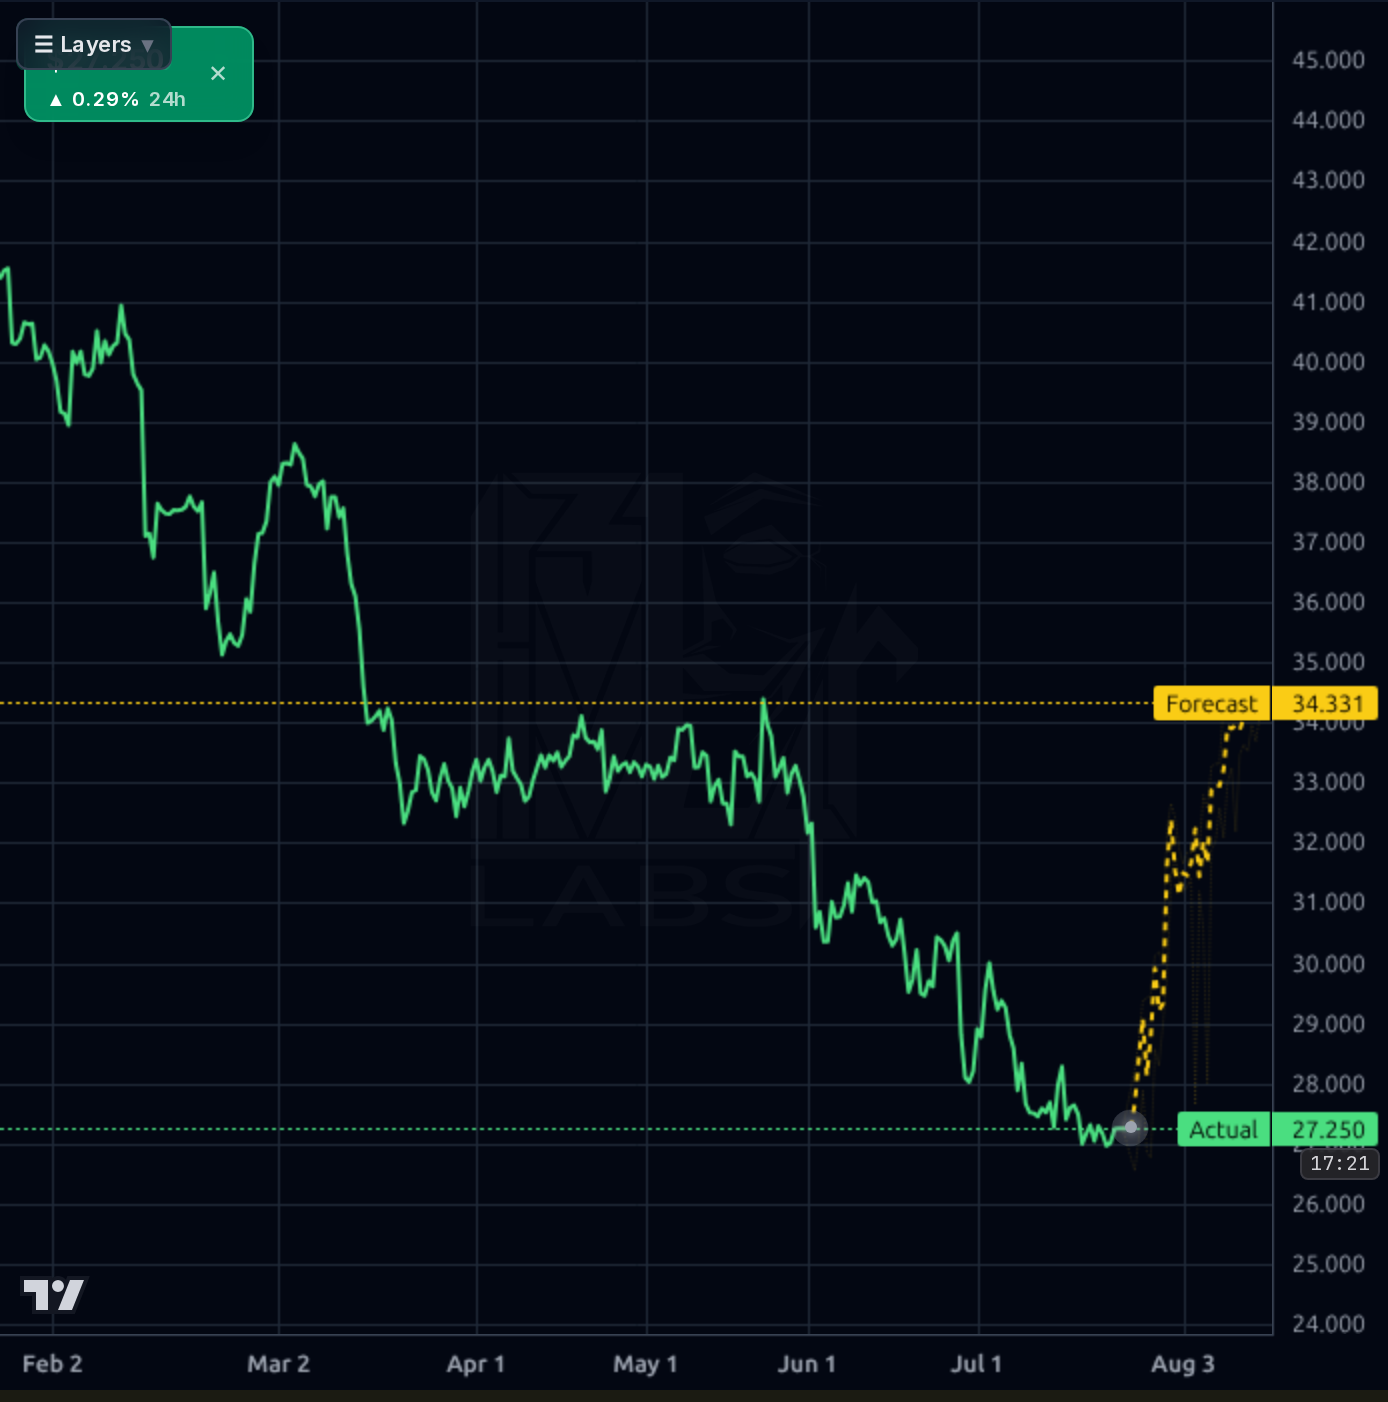
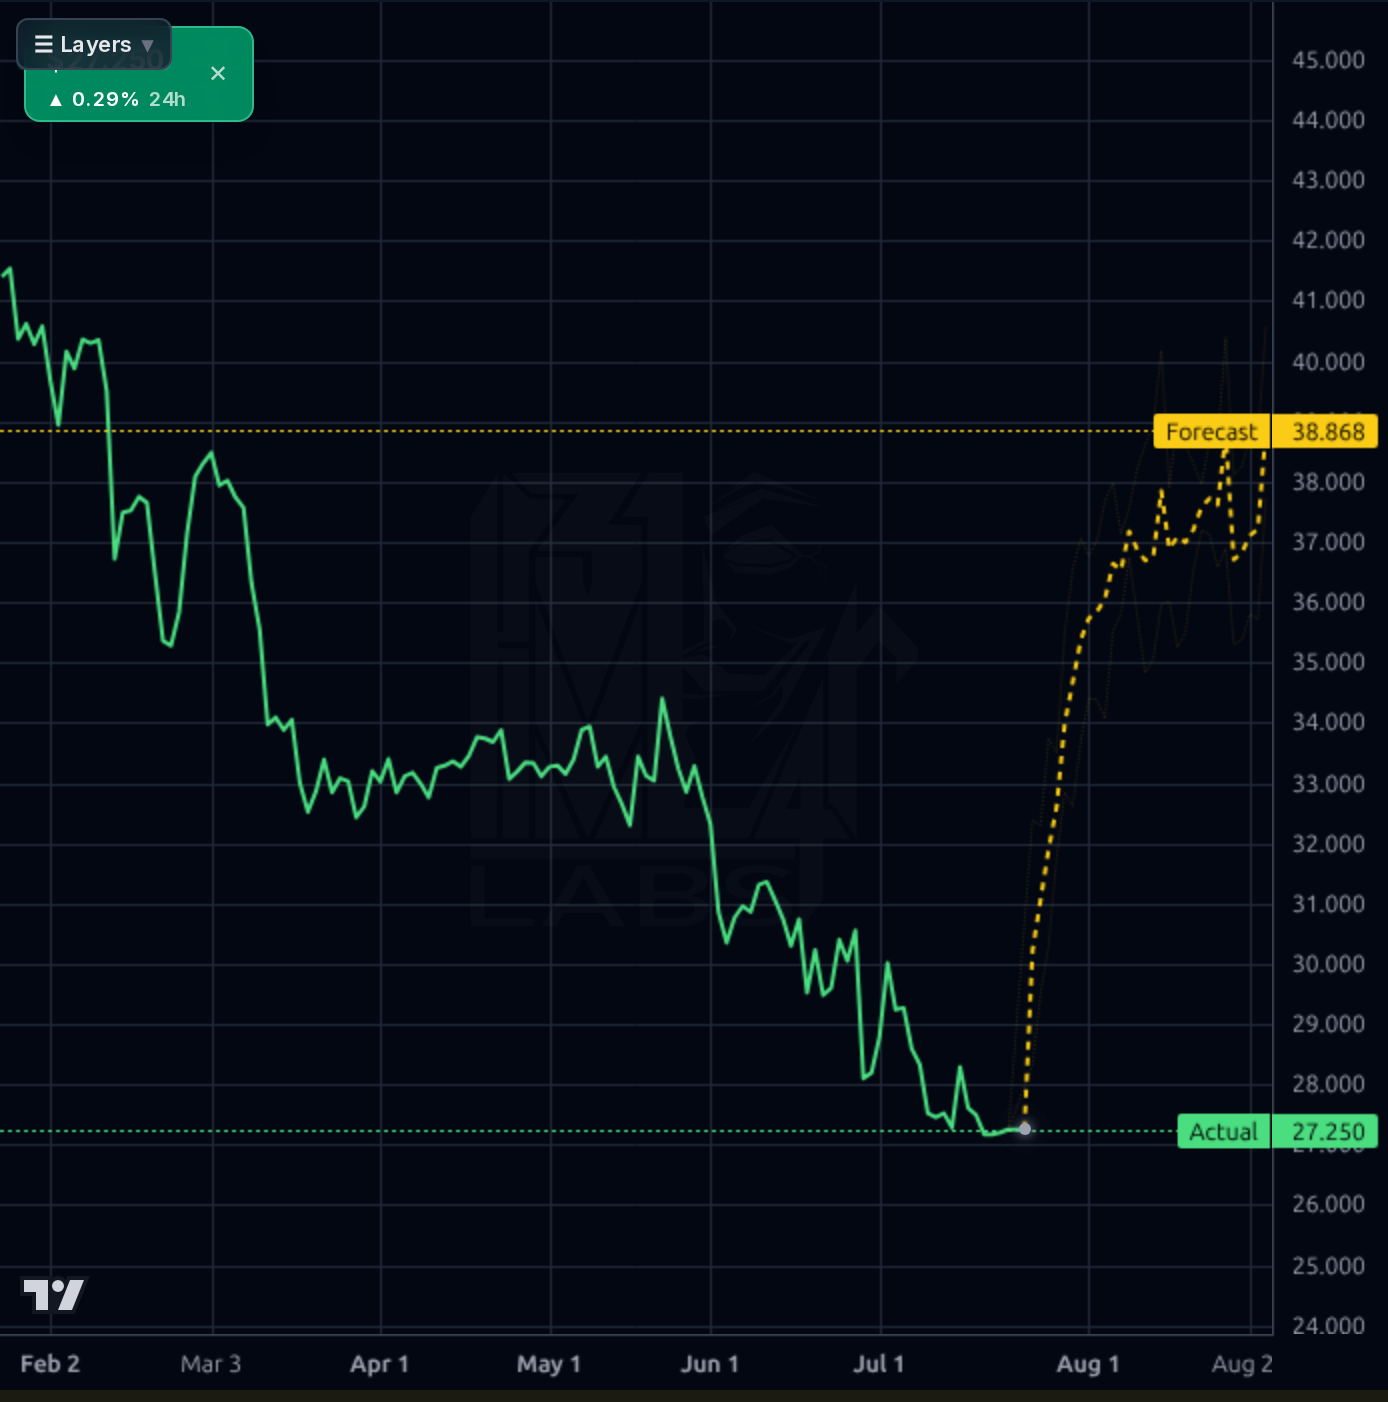
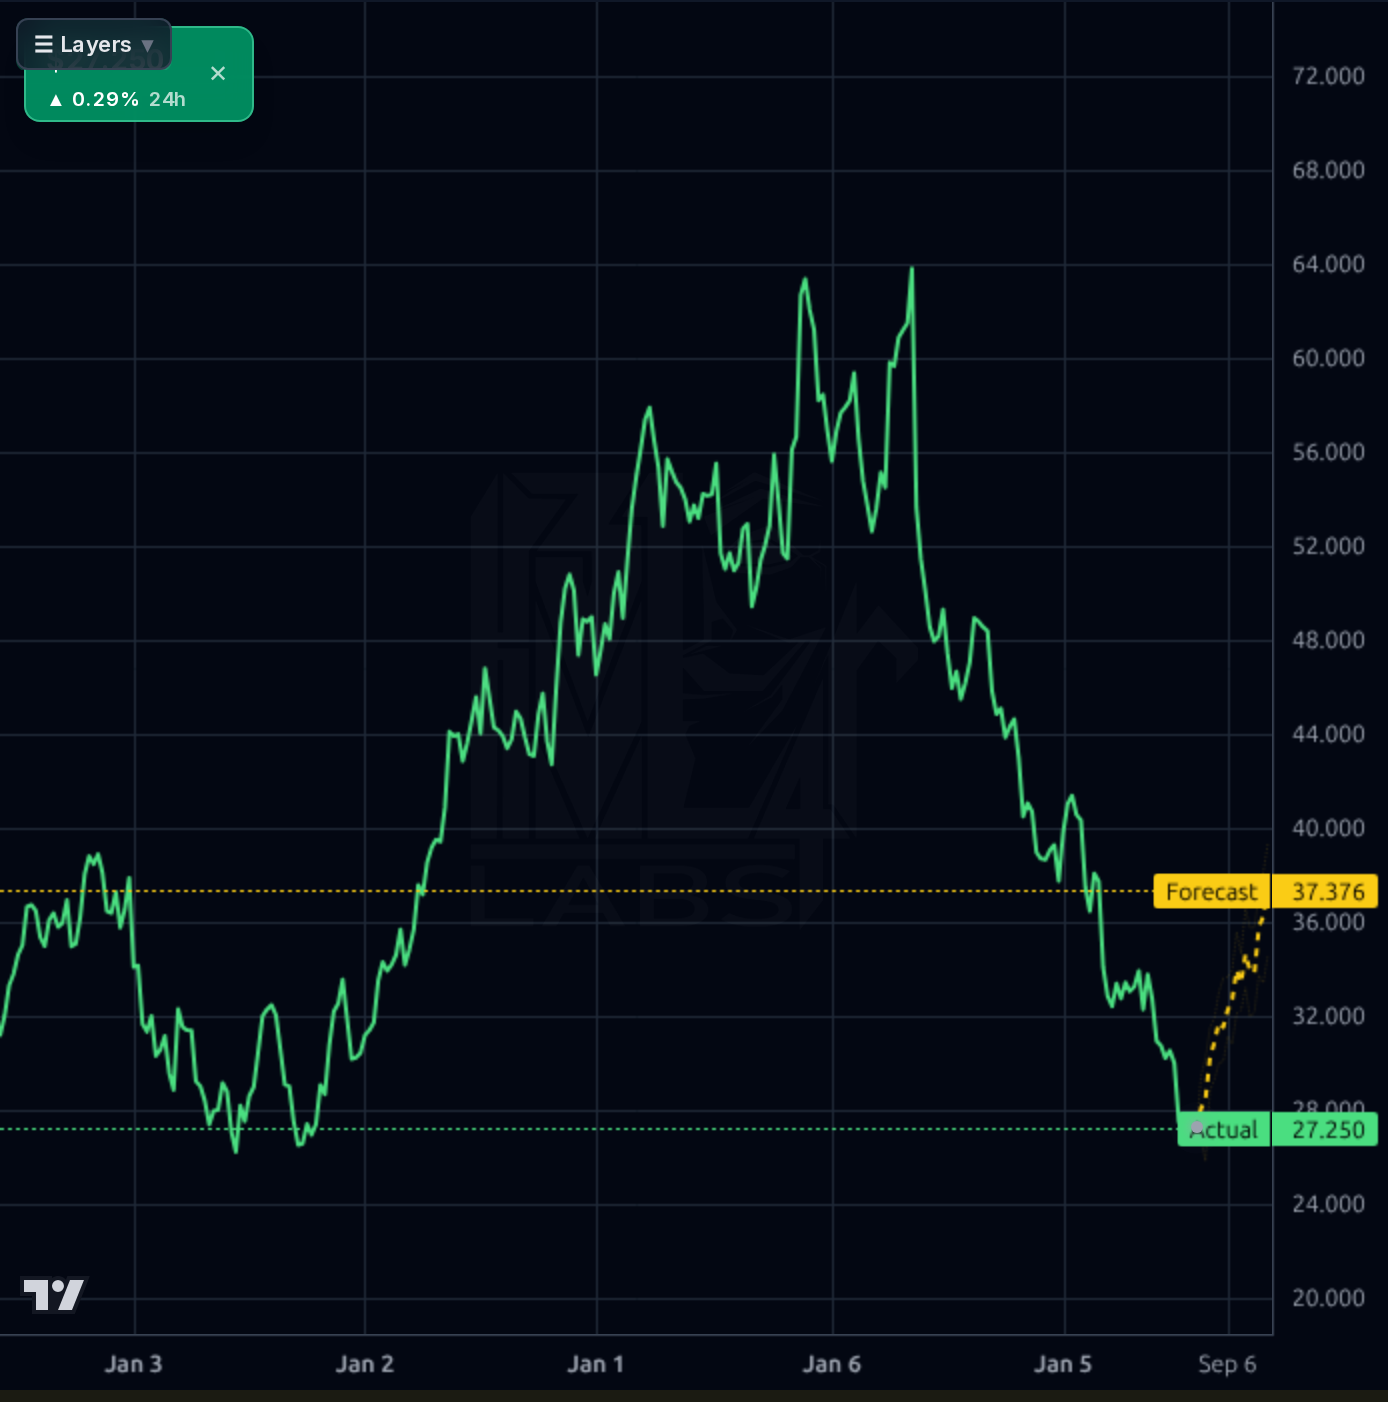
1-4 week view into the Sept 3 earnings print (~41 days out). This is a binary catalyst — do NOT size aggressively pre-print. Small starter position acceptable in the $26.85-$27.50 base; hard invalidation on a daily close below $26.60 (fresh air pocket). Upside is capped near-term by the $28.50 SMA20 and then the $30.50-$31.00 shelf — take partial profits into any tag of $30+ before the print. Earnings stance: NEUTRAL into the print; the Q/Q cash decline of $1.75B needs explanation and the Y/Y revenue trajectory needs to show >1% reacceleration to justify holding through. Discount the model's aggressive bullish forecast — 1D/1wk model accuracy is beaten by naive baseline.
1-6 month view: ACCUMULATE methodically on weakness. The setup requires a confirmed reversal — reclaim of $28.50, then decisive close above $31-32 — before adding aggressively. Key catalysts: (1) Sept 3 earnings — does revenue growth reaccelerate above +1% Y/Y and did operating margin hold >37%? (2) Any formal capital allocation announcement (buyback authorization or M&A — Liquidity Services rumor is worth tracking). (3) Explanation of the Q/Q cash decline. Expected return range: -5% to +20% from $27.20; base target $31 (reclaim of prior shelf, ~14% upside) assumes stable fundamentals and one catalyst printing. Change my mind on the downside if Q1 revenue turns negative Y/Y or operating margin drops below 35%.
1-3 year view: Copart remains a structurally advantaged duopoly operator with best-in-class margins, a fortress balance sheet, and secular tailwinds from ADAS/EV total-loss frequency. If used-vehicle price deflation stabilizes and management deploys the $3.35B cash productively (buyback at these levels would be highly accretive), the stock can re-rate back toward historical ~22-25x forward earnings on normalized $2.00+ EPS = $44-50 range. Terminal thesis intact. Biggest structural risk: permanent revenue growth reset to low-single-digits due to used-car deflation and EV replacement-cost dynamics that reduce total-loss volume growth, which would compress the multiple to a mid-cycle industrial ~15x — pinning the stock in the $25-32 range for years.
Copart's fundamentals remain elite in absolute terms but decelerating on the margin. FQ3 (Apr'26) revenue of $1.237B was +10% Q/Q but only +2.1% Y/Y TTM, confirming a growth reset. Margins actually expanded sequentially — gross margin 46.3% (vs 43.9% prior Q), operating margin 37.5%, net margin 32.5% — validating the AI-driven productivity story (IntelliSeller, Copart 360). Balance sheet is a fortress: $3.35B cash, only $93M total debt (Debt/Eq 0.01), current ratio 7.6, and stockholders' equity of $8.77B. TTM FCF is ~$1.0B against a $25.2B market cap (P/FCF ~19x). The one flag worth explaining: cash dropped from $5.10B (Jan'26) to $3.35B (Apr'26) — a $1.75B swing — with no announced buyback or M&A. This is the single biggest unanswered question and needs clarification on the Sept 3 print. ROE of 17.6% and ROIC of 17.6% are excellent but have compressed from historical 20%+ norms. Valuation has reset to 16.2x forward P/E (vs. long-term average >25x), though PEG of 3.13 flags that growth is not keeping pace with the still-premium multiple.
The tape is decisively broken across all timeframes shown. On the 1D/weekly view, CPRT collapsed from $64 (early Jan cycle high) to $27.20 — a ~57% drawdown — with the stock trading -3.85% below SMA20, -10.4% below SMA50, and -25.1% below SMA200. YTD -30.5%, 1Y -41.9%, Half-Year -34.2%. The 1h and 4h charts show a clear multi-week base attempt in the $26.85-$27.50 zone, holding the 52-week low at $26.85 — the critical line in the sand. RSI(14) at 36.8 is depressed but not classically oversold, and prior calibration on this name shows RSI is NOT a reliable mean-reversion signal here. The model's forecast band projects bullish reversion (1D forecast $30.37, 4H $34.33, 1D $38.87), but the accuracy audit is damning: 1-day directional accuracy 25% vs 82% naive baseline, and horizons ≥6 days score effectively 0% directional. Forecast must be heavily discounted. Structure: a reclaim of $28.50 (SMA20 vicinity) and then decisive break above the $31-32 shelf would be the earliest confirmed reversal signal. Loss of $26.85 opens an unmapped air pocket toward $24-25.
News flow is mixed but leans constructive on valuation while confirming near-term weakness. Yahoo/Simply Wall St. (Jul 23) published two pieces flagging CPRT as potentially 45% below fair value on DCF, and separately as an undervalued name with 1Y TSR -42%. Trefis (Jul 22) speculated on CPRT as a possible acquirer of Liquidity Services — an interesting capital deployment angle that ties directly to the $3.35B cash pile. Counterweight: Barclays' John Babcock (Jul 22) MAINTAINED an Underweight rating and CUT price target from $32 to $26, essentially forecasting no upside from current levels. ChartMill flagged CPRT as a Peter Lynch GARP candidate (PEG 0.85 in their calc — differs from Finviz PEG of 3.13, likely different growth window). SEC 8-Ks in the last month were operational: new UK President named (Jul 8) and another executive change (Jun 29) — housekeeping under the new CEO regime, no capital return announcement yet. Insider signal is negative: Director Daniel Englander sold $2.2M on Jul 13, consistent with the prior pattern of insider selling into weakness.
- Sept 3, 2026 FQ4 earnings print — key test for revenue reacceleration above +1% Y/Y and margin sustainability above 37%
- Potential M&A optionality: Trefis (Jul 22) flagged Liquidity Services as a target and named CPRT as a plausible buyer — would deploy part of the $3.35B cash pile productively
- New UK President appointment (Jul 8) signals continued international operational focus under the new CEO
- Proprietary AI stack (IntelliSeller, Copart 360) driving sequential margin expansion — gross margin +240bps Q/Q in FQ3
- Capital return optionality: with 16x forward P/E at multi-year lows and $3.35B cash, a buyback authorization would be immediately accretive and is the single most likely upside catalyst
- Structural revenue deceleration: TTM sales growth of only 1.05% Y/Y vs. 3/5Y CAGR of 9.9%/16.1% — the growth engine has materially slowed
- Sept 3 earnings binary risk — a miss or soft guide could break the $26.85 52W low and open downside to $24
- Q/Q cash decline of $1.75B (from $5.10B to $3.35B) is unexplained — could indicate off-cycle capex, tax payment, or hidden buyback; needs disclosure
- PEG of 3.13 (Finviz calc) suggests valuation is NOT cheap relative to forward growth — the 'cheap' narrative depends on multiple re-rating, not earnings growth
- Insider selling continues: Director Englander sold $2.2M on Jul 13 into weakness — directionally negative signal
- Barclays Jul 22 downgrade of PT from $32 to $26 (Underweight) — sell-side capitulation on valuation floor
- Broken tape: -25% below SMA200, -30.5% YTD; quality fundamentals do not arrest broken technical structures per prior calibration lessons on this name
- Model forecast unreliable — 1D directional accuracy 25% vs 82% naive baseline; the bullish forecast band should be heavily discounted
Get AI analysis on any stock
This is one of hundreds of Kronos AI reports — scored fundamentals & technicals, bull/base/bear price targets, a multi-horizon plan, and continuously-updated forecasts across the market. Create a free account to explore them all.
Create your free account →Already a member? Sign in · Join our Discord