CPRT — AI Stock Forecast & Price Targets
Published 7/16/2026 · A free sample of K3vl4r’s AI-powered analysis.
Kronos price forecasts, scored fundamentals & technicals, and a multi-horizon plan.
View the live CPRT price forecast →
Copart is a pristine, debt-free compounder (33% net margins, 17.6% ROE, $3.35B cash) whose stock has been cut nearly in half from $50 highs to fresh 52-week lows at $27.28 as growth decelerated to ~1% Y/Y and the multiple compressed. The setup is attractive for patient accumulation — RSI 33.7, oversold, at long-term support — but the tape is broken (below all major SMAs, -25.9% vs 200d) and there's no visible catalyst before the May 21 earnings, so this is a scale-in, not a hero trade.
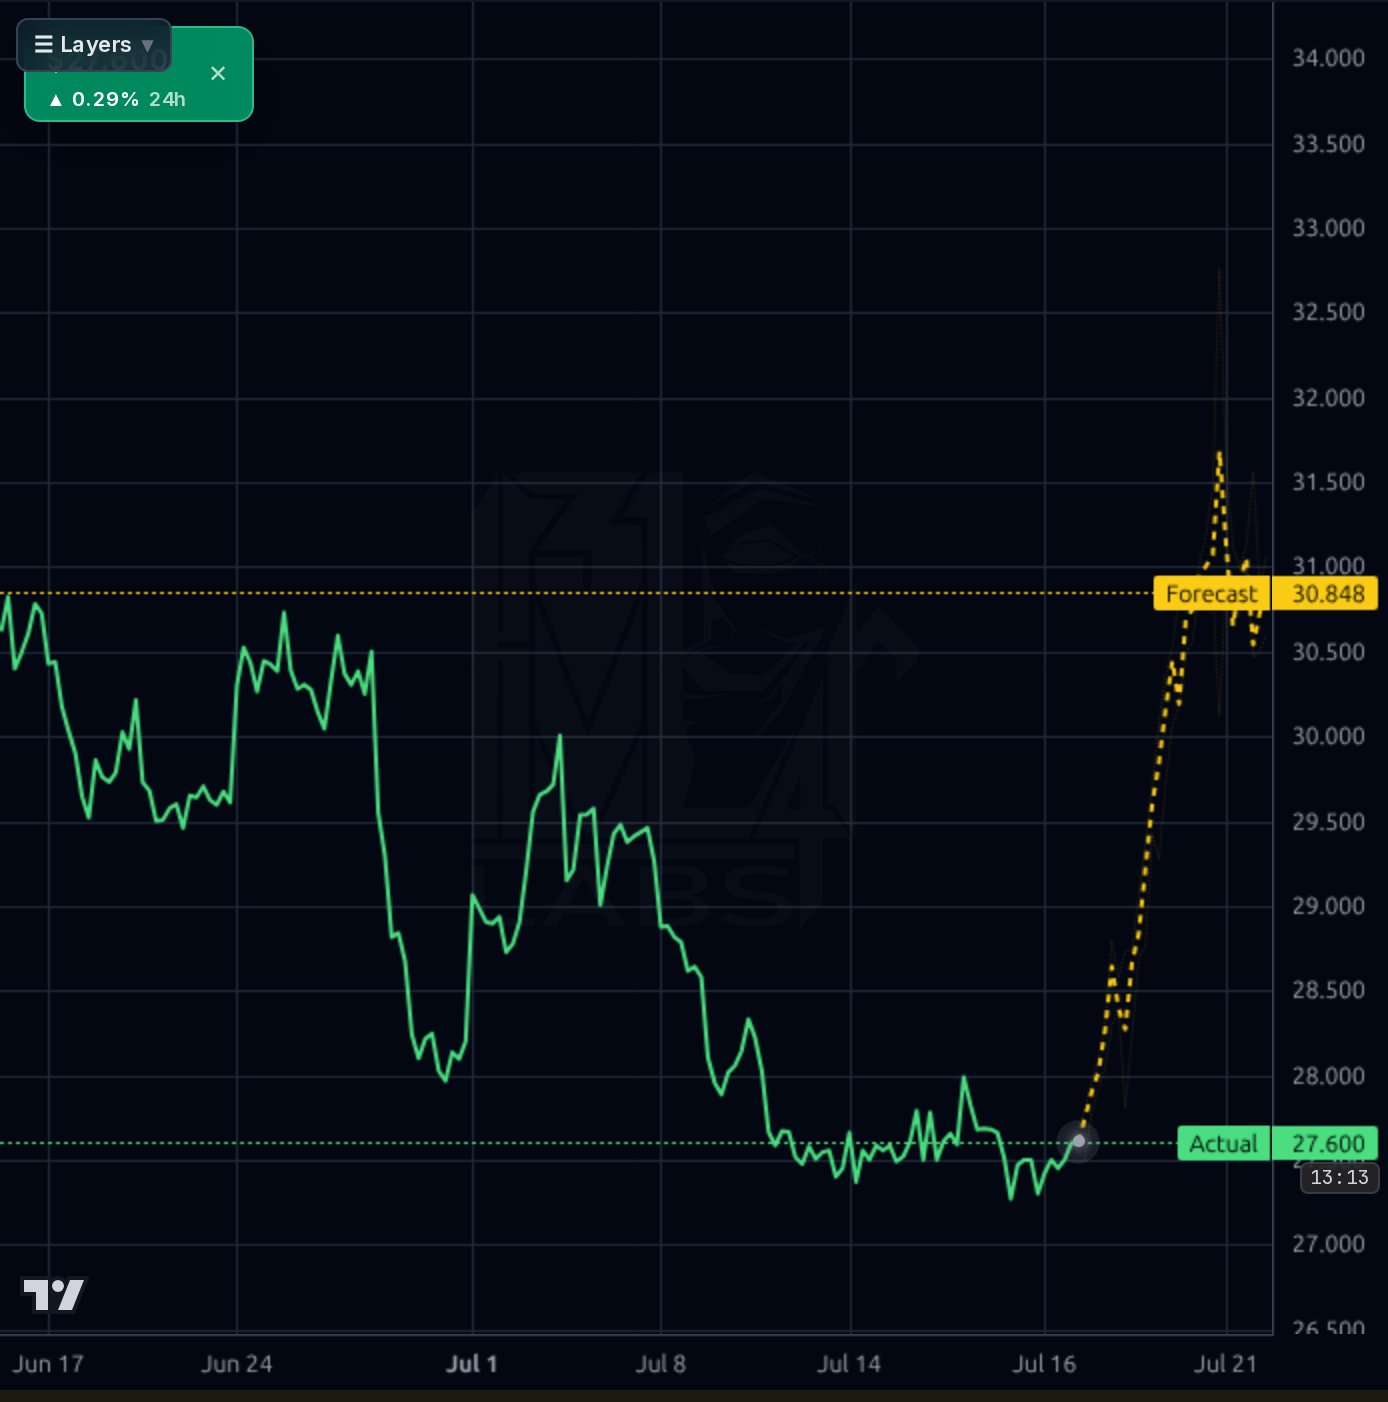
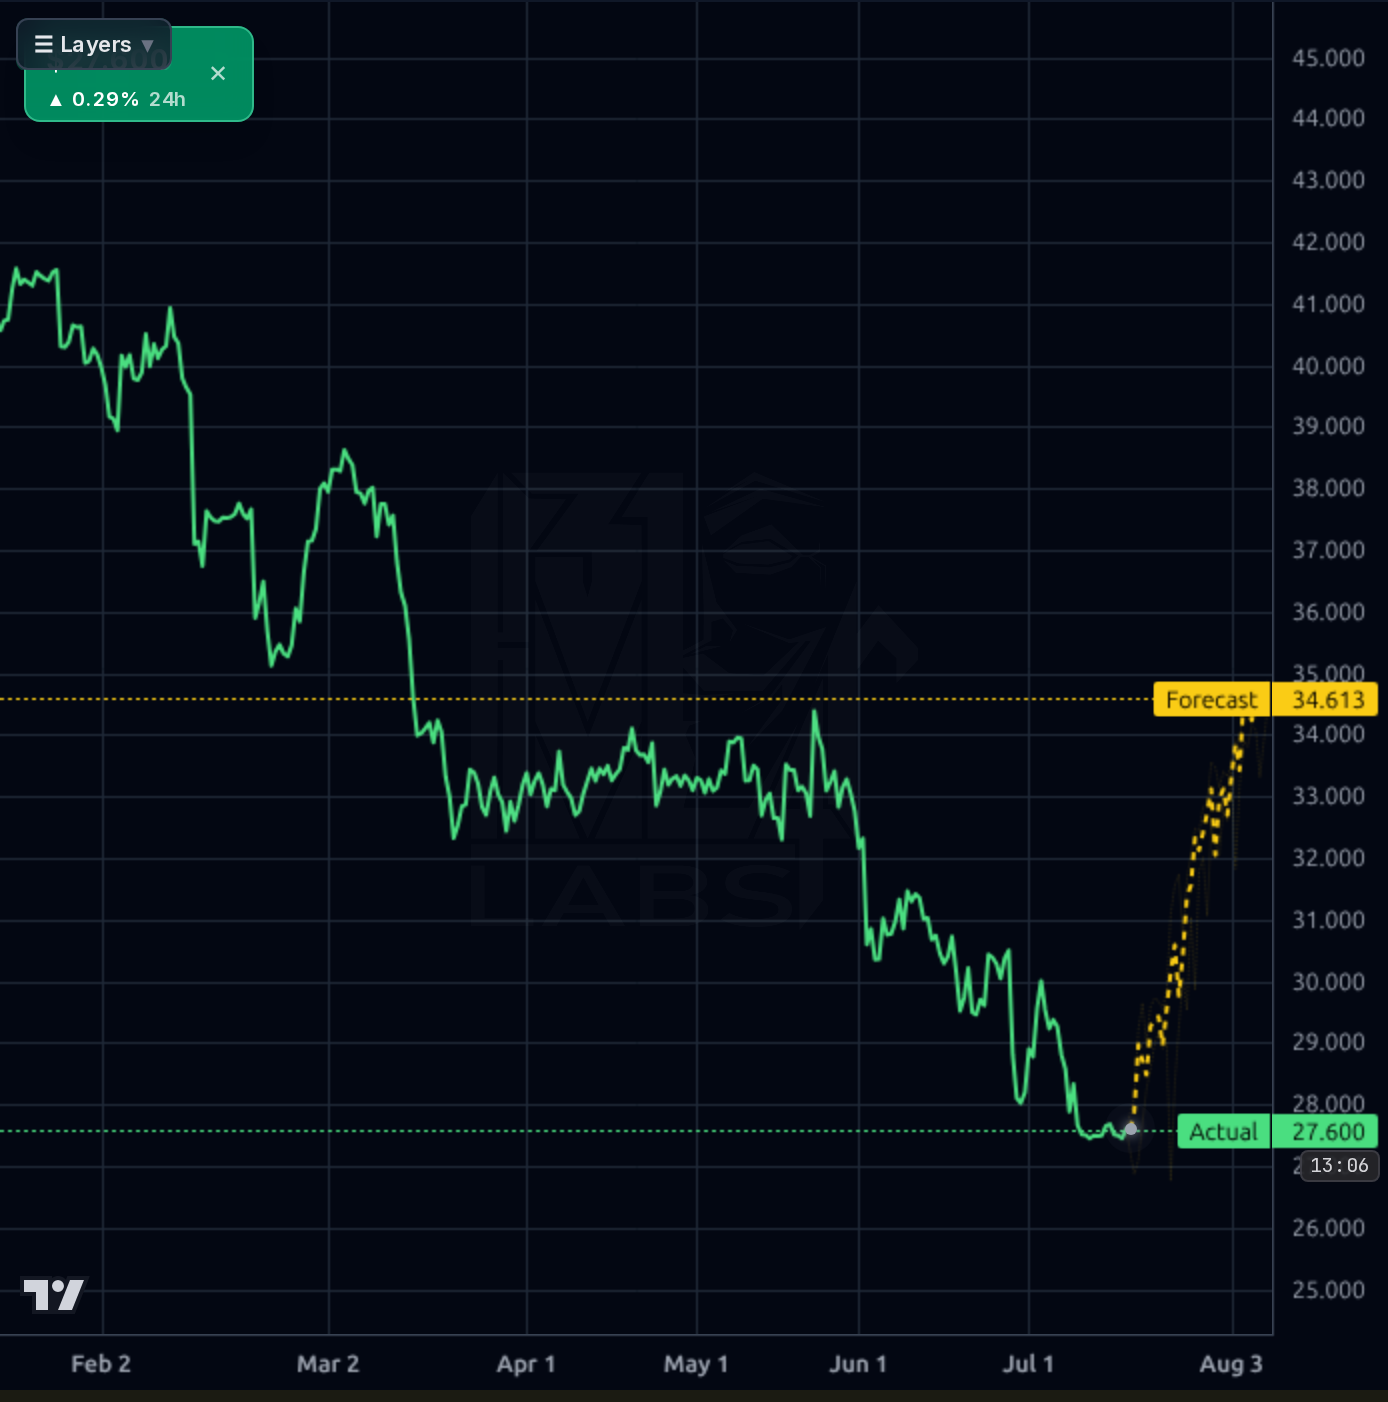
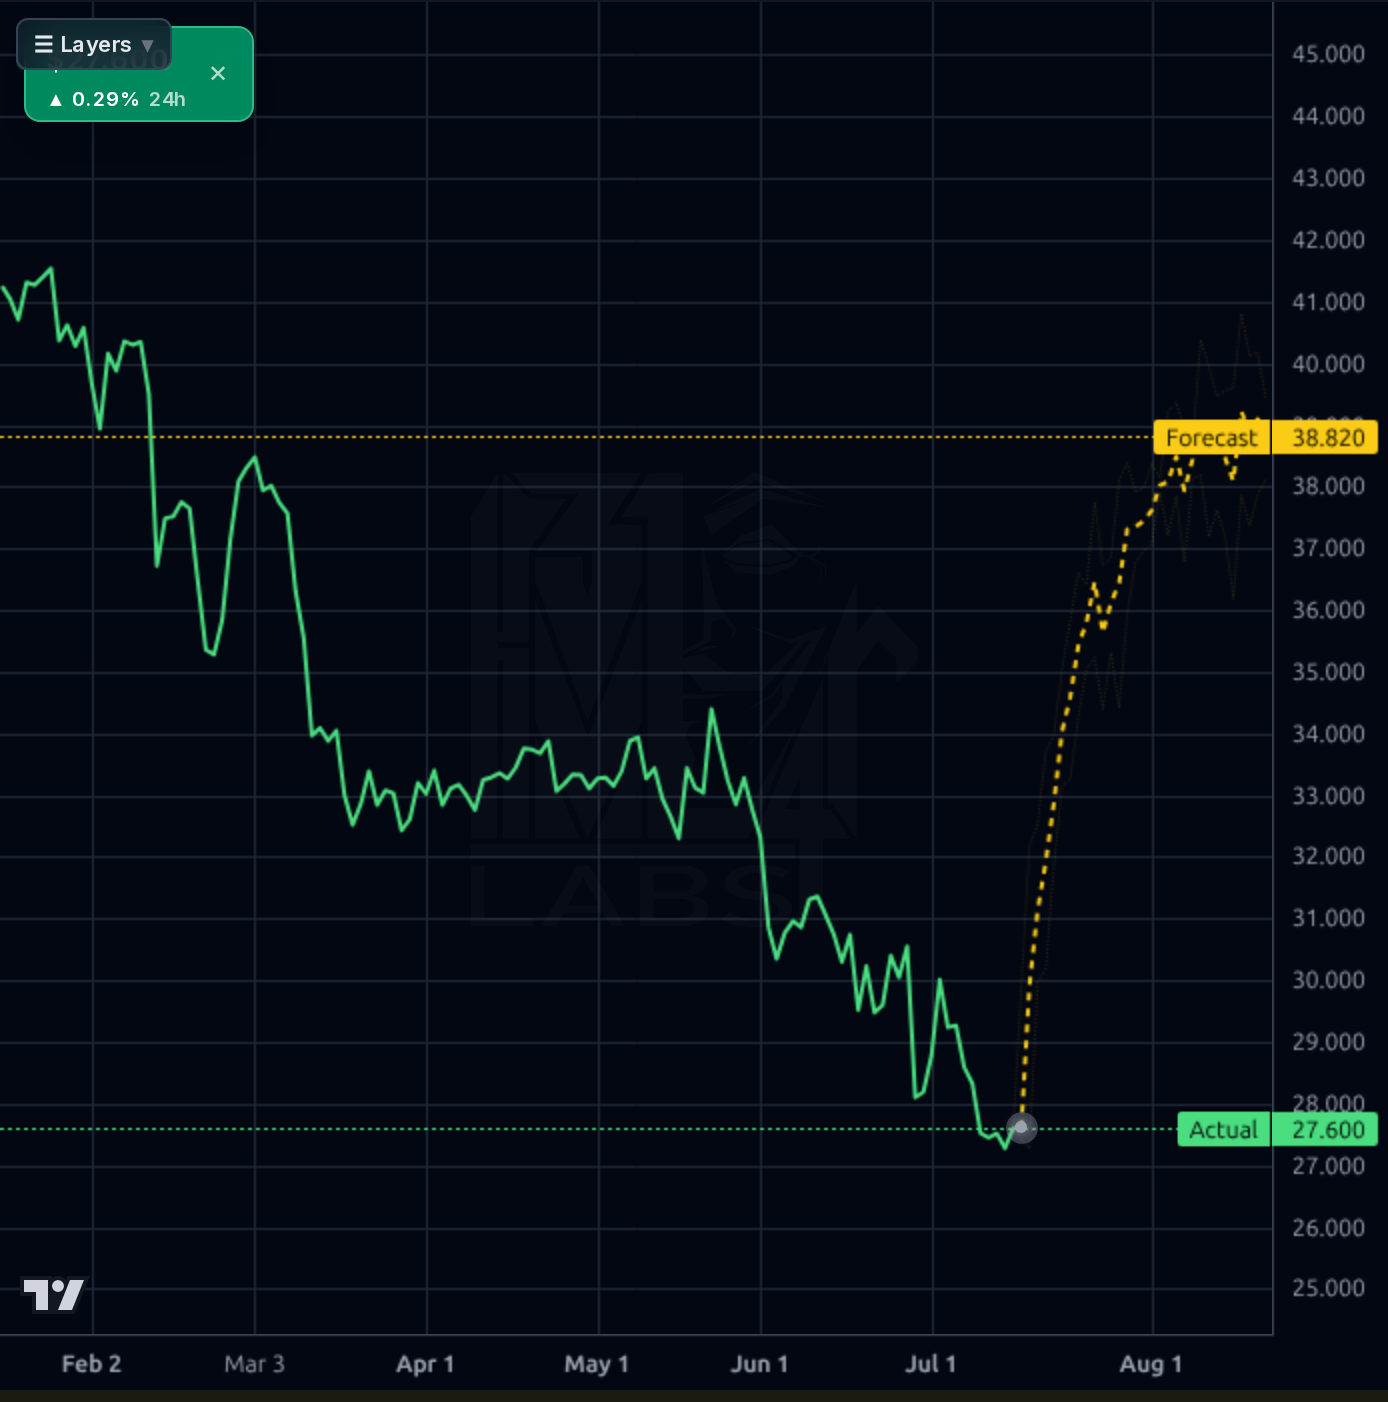
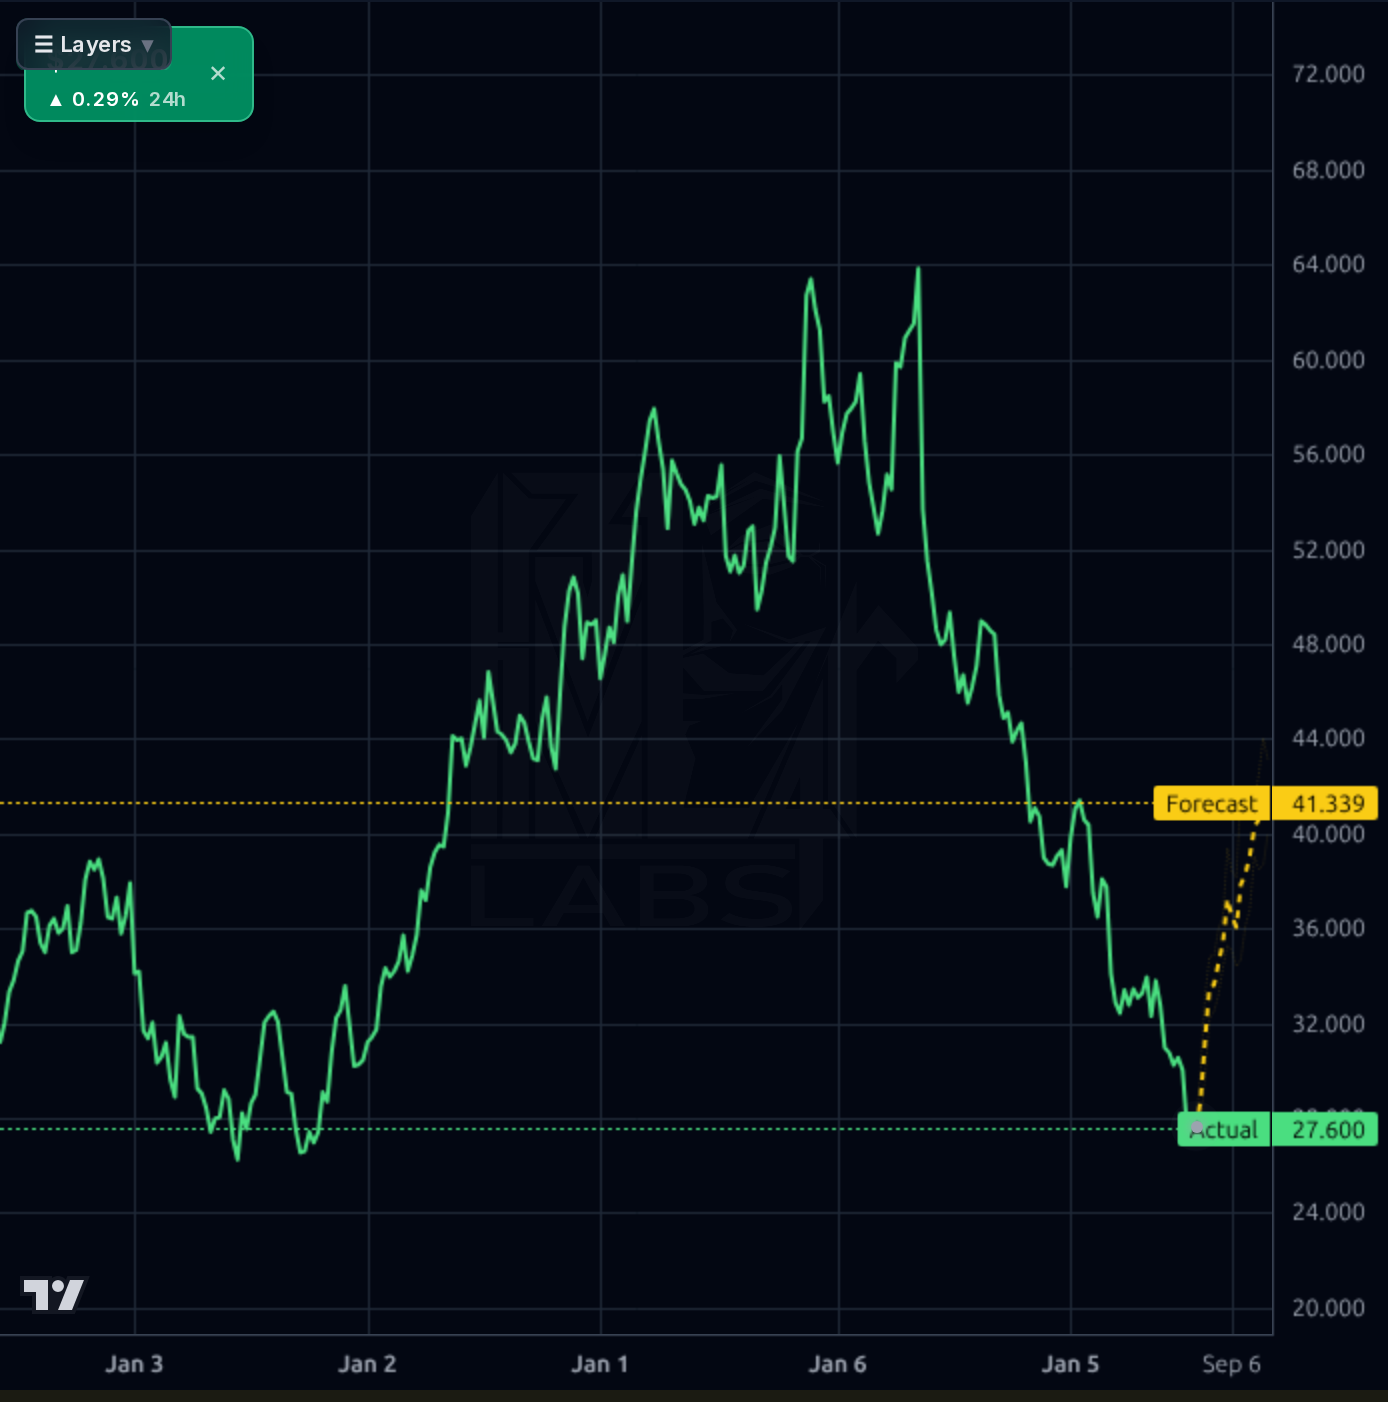
Stock is sitting right on the 52-week low at $27.23 with RSI 33.7 and no imminent catalyst. I'd start a small starter position (1/3 of intended size) at $27.20-27.60, add on either (a) a reclaim of $28.50 with volume or (b) a flush to $25.50-26.00 that holds. Invalidation is a weekly close below $25.00, which would open air down to $22. Do not chase the model's $34+ 1-day forecast — its directional accuracy has been below random here.
Over 1-6 months the setup is a mean-reversion / re-rating trade into the May 21 earnings print and CEO Adair's strategic reset. Base case return: $27 → $33-35 (+22-30%) if margins stabilize and management articulates a credible growth reacceleration. What kills the thesis: another quarter of sub-2% revenue growth combined with margin erosion below 35% operating, or an insurer/IAA competitive commentary that suggests share loss. Watch working capital and any announcement of a capital return (buyback would be a strong signal given the $3.35B cash pile).
Copart's structural moat — two-sided auction network, insurer relationships, physical yard footprint, and copart 360 tech — remains intact and largely unassailable in North America. Over 1-3 years the terminal thesis is high-single-digit revenue growth, sustained mid-30s net margins, ROIC compounding, and optional M&A upside (powersports, international, Purple Wave). The biggest structural risk is secular: if EV adoption reduces total-loss frequency and if repair-vs-total-loss economics shift with insurers, unit growth could permanently flatten. At 16x forward earnings, you're paying a fair-not-cheap price for durability — long-term IRR probably 8-12% absent multiple expansion.
Business quality remains elite: TTM revenue $4.64B with 47.5% gross / 37.5% operating / 33.5% net margins, ROE 17.6%, ROIC 17.6%, and a fortress balance sheet ($3.35B cash + $846M ST investments implied by working capital of $4.53B vs only $93M total debt; Debt/Eq 0.01, current ratio 7.6). FCF conversion is strong — TTM FCF ~$1.34B against $1.69B operating cash flow. The problem is growth: TTM sales growth of just 1.05% Y/Y and EPS Y/Y TTM +5.6%, well below the 3/5Y sales CAGRs of 9.9%/16.1%. Sequentially, Q3 (Apr-26) revenue of $1.24B was up modestly and net margin rebounded to 32.5%, but the trajectory is a clear step-down from the 35%+ margin prints of mid-2025. There is no dividend and no buyback signal in the data, so capital is piling up on the balance sheet — a latent optionality (M&A per the incoming CEO commentary) but also a drag on ROE. At 17x trailing / 16.2x fwd P/E and PEG 3.14, valuation is finally reasonable for a business of this quality, though not screaming cheap given decelerating growth.
All four timeframes point the same direction: down. The weekly shows a clean lower-highs/lower-lows pattern from $64 → $27, a ~57% drawdown. The daily is in a persistent downtrend since April with price -6.1% below SMA20, -12.2% below SMA50, and -25.9% below SMA200 — a textbook broken chart. The 4h and 1h show price probing the $27.23 52-week low with a very small bounce to $27.60. RSI(14) at 33.7 is oversold but not washed out. The forecast band is aggressively bullish across every timeframe (1d target $34.6, 1wk $38.8, monthly $41.3), but calibration is a red flag: the daily model's realized directional accuracy is 23% vs a 79% naive baseline — actively worse than random — so its shape is unreliable at this horizon. Only the weekly model shows genuine skill (100% vs 83% baseline). Key levels: support $27.23 (52wk low) then a gap to $25; resistance $28.5 (Jul consolidation), $30 (psychological + Jun breakdown), $31.5-$32 (SMA20/50 cluster), then $34.5.
The signal-heavy items are governance and strategy: incoming CEO Jay Adair (returning to the role, explicitly not interim) publicly signaled an acceleration in growth initiatives, M&A, and AI investment, and Jane Pocock was promoted to President effective Aug 1, 2026. That's a coherent management refresh at the exact moment the stock is under pressure, and both were formalized via 8-K filings (Items 5.02). The offsetting negative is a $2.2M open-market insider SELL by director Daniel Englander on Jul 13 — noisy but not encouraging given the price level. The rest is noise: a generic "stock down while market up" recap, a 52-week-low screener list, and social sentiment that is 100% bullish on tiny volume (18 messages) — a mild contrarian yellow flag suggesting retail is trying to bottom-fish alongside the tape. No earnings until May 21, 2026, so there is a catalyst vacuum near-term.
Get AI analysis on any stock
This is one of hundreds of Kronos AI reports — scored fundamentals & technicals, bull/base/bear price targets, a multi-horizon plan, and continuously-updated forecasts across the market. Create a free account to explore them all.
Create your free account →Already a member? Sign in · Join our Discord